 🏗️ New Construction
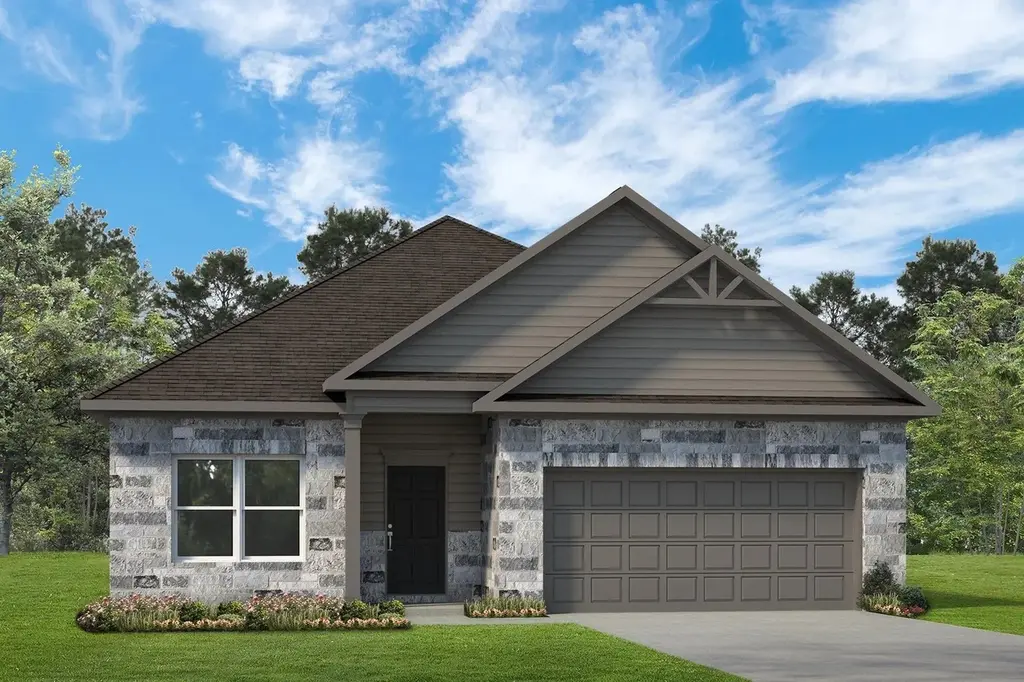
The Davenport II Plan · Iowa Colony, TX
Flood risk 1/10 · Minimal
- FEMA flood zone
- X (unshaded)
- Chance of flooding over 30 yrs
- 0.0%
- Est. flood insurance / yr
- $507 – $1,088
Fire risk 6/10 · Moderate
- Est. fire insurance / yr
- $1,222 – $2,270
Heat risk 9/10 · Severe
- Hot days now (above 110°F)
- 7 days/yr
- Hot days in 30 yrs
- 23 days/yr
Wind risk 9/10 · Severe
- Chance of severe wind over 30 yrs
- 99.0%
Air-quality risk 3/10 · Minor
- Unhealthy air days now
- 2 days/yr
- Unhealthy air days in 30 yrs
- 3 days/yr
Risk factors via First Street. Map © Google.
Why this score? — see what drove the D grade
The composite is a weighted blend of 9 inputs, each scored 0–100. Each bar is that input's sub-score; the figure is the points it added to the 100-point composite (weight × sub-score).
- Cash flow +11.5/30.0
- ARV discount +7.5/15.0
- Condition / age +5.0/5.0
- Schools +3.9/10.0
- DSCR +3.4/10.0
- 1% rule +3.3/10.0
- Livability +3.2/5.0
- Rent growth +2.6/5.0
- Appreciation +0.0/10.0
$306,990
🖨 Deal sheet 📄 Offer letter ✓ Due diligence
Listing remarks MLS
The Davenport II offers expansive single level living space with so much flexibility. When entering the front of the home you'll have the choice of a living room, study or dining room. The spacious kitchen opens up to the family room with a large kitchen island, perfect to gather round. If you don't need 4 bedrooms, you may choose to build the home with 3 and use the flex area for a hobby space. If you need more bedrooms or just wish to have a loft, you may choose to add the optional bonus which can be configured as a large entertaining area or as a loft with additional 5th bedroom and full bathroom.
Key facts
- 2 parking spots
- Listed 581 days
Neighborhood map
What this means for you Summary
Snapshot
- This is a 4-bed/2.0-bath single-family listed at $307k. Condition is rated excellent.
Deal economics
- At list price, monthly cash flow is $-111 ($-1k/yr) — negative.
- The deal already cash-flows at list — no discount required.
- To meet the 1% rule (rent ≥ 1% of price), the offer needs to be $287k (6.4% below list).
- Recommended offer: $270k (12.0% below list) — sets the bar for market timing.
- Cap rate 5.9% vs local median 4.2% in Iowa Colony — top-decile yield for the area; either an underpriced asset or a hidden risk that comps aren't pricing in. Stress-test before assuming the spread holds.
Location & tenants
- Location reads 64/100 on livability (#757 in TX) — a middle-class / working-renter tenant base. Strengths: crime A+, employment A+, cost of living A+; Watch: schools F, amenities F, commute F.
- Alvin ISD (suburban): math 39% / reading 48% proficiency, ranked #255 of 826 in TX (top 31%) — families likely to look elsewhere, expect single-tenant / working-renter base with shorter leases.
- Market conditions: Rents flat; 1139 active listings in the ZIP; 15 comparable units currently listed for rent nearby; rentals at typical pace (median 22d on market — plan ~3-4 weeks tenant-placement turnaround); 47% of comp listings sitting > 30 days — soft ceiling on asking rent; high-income renter base; 3,960 units permitted in Brazoria County in 2024 (593 in 5+ unit buildings).
Forward outlook
- Local home prices are declining (-3.0%/yr); year-one equity from $2k of loan paydown is wiped out by about $10k of value loss. Plan a longer hold.
- Brazoria County population projected at +44% by 2050 — long-run rental-demand tailwind backs the buy-and-hold thesis.
Negotiation context
- It's been on market 582 days — a 12% lower offer ($270k) is reasonable based on typical stale-listing flexibility.
Risks & watch-outs
- Climate carrying-cost: severe wind risk, 99% chance of damaging wind over 30y; major wildfire risk; extreme-heat days projected 7→23/yr by 2055 (HVAC capex compounding) — expect insurance premiums to compound above CPI over the hold.
Questions for the listing agent
- What do current leases actually rent for vs. the listed asking? Can we see a recent rent roll and the last 12 months of T-12 income?
- It's been on market 582 days. Have you received any prior offers? Is the seller open to a 12% concession, seller financing, or rate buy-down credit?
- Why hasn't it sold? Are there any deal-killer items the seller is aware of (foundation, flood, title, zoning, code violations)?
- Is there a deadline driving the sale (1031 exchange, divorce, estate, relocation)? That informs how much negotiation room exists.
- Schools are F-rated, which usually means shorter tenancies and higher turnover. Who's the typical renter profile here, and what's been the actual vacancy rate?
- The area grade is low — what's the realistic commute time and amenity access for the typical tenant pool here? Any planned neighborhood developments (good or bad) we should know about?
- What's the average days-on-market for RENTAL listings here right now (not sales)? A rising rental-DOM trend means longer vacancies and softer asking-rent achievability than the comps imply.
- What's the recent tenant-quality profile in this submarket — average credit score on applications, eviction rate, late-payment / NSF rate, and stable-employment percentage? A property-management company in the area should have these aggregated.
- How much new for-sale + rental construction is in the pipeline within 1–3 miles? Heavy new supply typically softens prices + rents 12–24 months out; constrained supply supports both.
Investment metrics
- 1% rule
- 0.83% ✗
- Cap rate
- 5.91%
- Cash-on-cash
- -1.38%
- DSCR
- 0.94
- GRM
- 10.0
CMA / ARV
- ARV (median comp)
- $344,503
- List price
- $306,990
- Delta
- -10.89%
- Verdict
- UNDERPRICED
- Comps
- 20 within 1.0 mi
Show comp detail 12 sales within ~0.75 mi
| Address | Dist | Beds/Ba | Sqft | Sold | Price | $/sf | Match |
|---|---|---|---|---|---|---|---|
| 9822 Garnet Springs Dr | 0.49mi | 4/2.0 | 1,879 (+0%) | 1mo | $260,000 | $138 | 76 |
| 9911 Garnet Springs Dr | 0.43mi | 4/2.0 | 1,879 (+0%) | 8mo | $270,000 | $144 | 73 |
| 2614 Matterhorn Mist Dr | 0.11mi | 4/2.0 | 2,099 (+12%) | 8mo | $309,000 | $147 | 68 |
| 9902 Smokey Quartz Ln | 0.58mi | 4/2.0 | 1,930 (+3%) | 6mo | $249,900 | $129 | 64 |
| 2442 Goddard Green Dr | 0.63mi | 3/2.0 (-1) | 1,809 (-4%) | 0mo | $279,000 | $154 | 59 |
| 9927 Pearl Creek Ln | 0.58mi | 3/2.0 (-1) | 1,879 (+0%) | 12mo | $249,000 | $133 | 58 |
| 2421 Abbot Brook Dr | 0.67mi | 3/2.0 (-1) | 1,931 (+3%) | 9mo | $299,900 | $155 | 52 |
| 2445 Abbot Brook Dr | 0.65mi | 4/2.0 | 2,070 (+10%) | 9mo | $309,900 | $150 | 45 |
| 2409 Abbot Brook Dr | 0.68mi | 4/2.0 | 2,070 (+10%) | 8mo | $324,900 | $157 | 44 |
| 9930 Opal Rock Dr | 0.66mi | 3/2.5 (-1) | 1,659 (-12%) | 1mo | $235,000 | $142 | 42 |
| 2429 Abbot Brook Dr | 0.66mi | 3/2.0 (-1) | 1,641 (-13%) | 2mo | $210,000 | $128 | 41 |
| 2449 Abbot Brook Dr | 0.65mi | 3/2.0 (-1) | 1,616 (-14%) | 11mo | $324,900 | $201 | 32 |
Match score weights: distance 35% · size 25% · config 20% · recency 20%. Top-matched comps best support the ARV.
Projected returns pro-forma
-3.0% appreciation · 0.44% rent growth · sell at horizon
- IRR
- -21.5%
- Equity multiple
- 0.27×
- Total profit
- $-70,044
- Equity at exit
- $51,367
- IRR
- -22.6%
- Equity multiple
- -0.02×
- Total profit
- $-98,026
- Equity at exit
- $29,786
Cash invested: $96,461 (down + closing). Projections, not guarantees.
Landlord ↔ Tenant lean methodology
- Overall (STATE)
- 87 Strongly Landlord-Friendly
- State Texas
- 87 Strongly Landlord-Friendly · R+5
- County
- — inherits STATE
- City
- — inherits STATE
ZIP-level market 77583
- Rents YoY
- 0.4%
- Active inventory
- 1139
- Price-to-rent
- 8.9×
Monthly cashflow live
- Estimated rent
- $2,874 high interval (Pro) →
- Mortgage (P&I)
- −$1,807
- Tax est. 1.5%
- −$431 /mo · $5,168/yr
- Insurance
- −$144
- HOA
- −$0
- Vacancy / Maint / Mgmt
- −$603
- Net cashflow
- $-111
Break-even live
UW: 25.0% down · 7.5% · 30yr · 1.5% tax · 5.0% vac · 8.0% maint · 8.0% mgmt
Financing live
Cash to close
- Down payment
- $86,126
- Closing costs
- $10,335
- Reserves months
- —
- Total cash needed
- —
Loan-product check · same deal, 3 products live
Conventional
25% down · 7.5% · 30yr
- Down + closing
- —
- Monthly P&I
- —
- Monthly cashflow
- —
- DSCR
- —
- Eligible?
- —
Personal DTI + credit; lowest rate.
DSCR
20% down · 8.5% · 30yr
- Down + closing
- —
- Monthly P&I
- —
- Monthly cashflow
- —
- DSCR
- —
- Eligible?
- —
No personal income docs; deal must DSCR.
Hard money
10% down · 12.0% · 12mo
- Down + closing
- —
- Monthly P&I
- —
- Monthly cashflow
- —
- DSCR
- —
- Eligible?
- —
Short-term bridge; refi at stabilization.
Rent comps 15 comps
| Address | Beds | Baths | Sqft | Rent | $/sqft | DOM | Units | Dist |
|---|---|---|---|---|---|---|---|---|
| 2314 Red Slate Dr Rosharon, TX | 4.0 | 4.0 | 2531 | $2,850 | $1.13 | 44d | 1 | 0.33mi |
| 10211 Alpine Lake Ln Rosharon, TX | 3.0–4.0 | 2.0–2.5 | 1731 | $2,875 | $1.66 | 44d | 7 | 0.41mi |
| 10211 Alpine Lake Ln Rosharon, TX | 3.0–4.0 | 2.0–2.5 | 1731 | $3,025 | $1.75 | 1d | 6 | 0.41mi |
| 9518 Peridot Green Dr Rosharon, TX | 4.0 | 2.0 | 1593 | $1,886 | $1.18 | 22d | 1 | 0.62mi |
| 9901 Kilkenny St Iowa Colony, TX | 3.0–4.0 | 2.5 | 1735 | $2,726 | $1.57 | 4d | 1 | 0.72mi |
| 1816 Corsica Creek Ln Rosharon, TX | 3.0–4.0 | 2.0–2.5 | 1653 | $2,719 | $1.64 | 1d | 21 | 0.77mi |
| 10313 Malta Trace Dr Rosharon, TX | 4.0 | 2.0 | 1802 | $2,545 | $1.41 | 44d | 1 | 0.87mi |
| 9439 Ruby Mist Dr Rosharon, TX | 5.0 | 2.5 | 2605 | $2,456 | $0.94 | 7d | 1 | 0.99mi |
| 2510 Green Jasper Dr Rosharon, TX | 3.0 | 2.0 | 1561 | $2,375 | $1.52 | 44d | 1 | 1.17mi |
| 9423 Grand Spark Dr Rosharon, TX | 3.0 | 3.0 | 1999 | $2,600 | $1.30 | 44d | 1 | 1.20mi |
| 2523 Topaz Hill Ln Rosharon, TX | 3.0–4.0 | 2.0–2.5 | 1857 | $2,950 | $1.59 | 17d | 1 | 1.41mi |
| 10327 Armstrong Dr Rosharon, TX | 3.0 | 2.0 | 1956 | $2,291 | $1.17 | 44d | 1 | 1.43mi |
| 10539 Dolce Ln Rosharon, TX | 4.0 | 2.5 | 2258 | $2,391 | $1.06 | 13d | 1 | 1.47mi |
| 10610 Cascade Creek Dr Rosharon, TX | 3.0 | 2.0 | 1548 | $2,700 | $1.74 | 44d | 1 | 1.49mi |
| 1403 Cascade Hills Dr Rosharon, TX | 4.0 | 3.0 | 2067 | $3,450 | $1.67 | 7d | 1 | 1.49mi |
Listing history 17 events
-
2026-06-18days on market $306,990 Active 582 DOM
-
2026-06-17days on market $306,990 Active 581 DOM
-
2026-06-16days on market $306,990 Active 580 DOM
-
2026-06-15days on market $306,990 Active 579 DOM
-
2026-06-13days on market $306,990 Active 577 DOM
-
2026-06-13days on market $306,990 Active 576 DOM
-
2026-06-09days on market $306,990 Active 573 DOM
-
2026-06-08days on market $306,990 Active 572 DOM
-
2026-06-07days on market $306,990 Active 571 DOM
-
2026-06-04days on market $306,990 Active 568 DOM
-
2026-06-03days on market $306,990 Active 567 DOM
-
2026-06-02days on market $306,990 Active 566 DOM
-
2026-06-01days on market $306,990 Active 565 DOM
-
2026-05-31days on market $306,990 Active 564 DOM
-
2026-04-02price $306,990 607-char remark
Show marketing remark (607 chars)
The Davenport II offers expansive single level living space with so much flexibility. When entering the front of the home you'll have the choice of a living room, study or dining room. The spacious kitchen opens up to the family room with a large kitchen island, perfect to gather round. If you don't need 4 bedrooms, you may choose to build the home with 3 and use the flex area for a hobby space. If you need more bedrooms or just wish to have a loft, you may choose to add the optional bonus which can be configured as a large entertaining area or as a loft with additional 5th bedroom and full bathroom.
-
2025-02-04price $316,990 607-char remark
Show marketing remark (607 chars)
The Davenport II offers expansive single level living space with so much flexibility. When entering the front of the home you'll have the choice of a living room, study or dining room. The spacious kitchen opens up to the family room with a large kitchen island, perfect to gather round. If you don't need 4 bedrooms, you may choose to build the home with 3 and use the flex area for a hobby space. If you need more bedrooms or just wish to have a loft, you may choose to add the optional bonus which can be configured as a large entertaining area or as a loft with additional 5th bedroom and full bathroom.
-
2024-11-13$322,990 Active 607-char remark
Show marketing remark (607 chars)
The Davenport II offers expansive single level living space with so much flexibility. When entering the front of the home you'll have the choice of a living room, study or dining room. The spacious kitchen opens up to the family room with a large kitchen island, perfect to gather round. If you don't need 4 bedrooms, you may choose to build the home with 3 and use the flex area for a hobby space. If you need more bedrooms or just wish to have a loft, you may choose to add the optional bonus which can be configured as a large entertaining area or as a loft with additional 5th bedroom and full bathroom.
ⓘ Source: listings_history table (triggers on properties + properties_extension) + one-shot
backfill from property_details.listing_events for pre-trigger history.
Climate risk First Street
- Flood 1/10 Low FEMA zone X (unshaded) · 0% chance over 30 yrs
- Wildfire 6/10 Major
- Heat 9/10 Extreme 7 d/yr ≥110°F today · 23 d/yr by 30 yrs out
- Wind 9/10 Extreme 99% chance of damaging wind over 30 yrs
- Air quality 3/10 Moderate 2 unhealthy d/yr today · 3 by 30 yrs out
Nearby sold comps map
Loading sold comps map…
Walkable amenities ~0.75 mi
Loading nearby amenities…
Taxation est. · year 1
- Rental income
- $34,483
- − Mortgage interest
- −$19,298
- − Property taxes
- −$5,168
- − Insurance
- −$1,723
- − Repairs & maintenance
- −$2,759
- − Management
- −$2,759
- − Depreciation
- −$10,022
- Taxable loss
- −$7,243
- Est. tax savings @ 24.0%
- +$1,738
- After-tax cash flow
- $411/yr
For passive investors: Depreciation is non-cash, so a rental often shows a tax loss while cash-flowing — sheltering income. Rental losses are passive: they offset passive income freely, and up to $25,000/yr can offset ordinary (W-2) income if you actively participate and your MAGI is under $100k (phasing out to $0 by $150k); unused losses carry forward. On sale, claimed depreciation is recaptured at up to 25%, and gains may owe capital-gains tax (a 1031 exchange can defer both). Figures are a year-1 estimate at your 24.0% rate — not tax advice; consult a CPA.
Condition & rehab AI · 12 photos
This single-family home is in excellent condition with modern amenities and a well-maintained exterior. It's move-in ready and would benefit from a fresh coat of paint and smart home integration to further enhance its value.
Value-add opportunities
- Resale Paint interior walls — Fresh paint can enhance curb appeal and interior aesthetics
- Both Install smart home devices — Modern technology can increase both resale and rental value
- Both Add smart thermostat — Energy-efficient systems can lower utility costs and attract eco-conscious buyers
Renovation cost estimate screening
Value-add ROI direction
- Resale Paint interior walls — Fresh paint can enhance curb appeal and interior aesthetics ↑
- Both Install smart home devices — Modern technology can increase both resale and rental value ↑
- Both Add smart thermostat — Energy-efficient systems can lower utility costs and attract eco-conscious buyers ↑
ⓘ Cost ranges are severity-bucket heuristics (US national rule-of-thumb). Get contractor quotes + a written scope before underwriting a rehab budget.
Schools (NCES district)
- District
- Alvin ISD
- NCES district ID
- 4808090
- Math proficiency
- 39% ▼ -11.00%
- Reading proficiency
- 48% ▬ 0.00%
- Median HH income
- $66,740
- Composite
- 38.96/100
- National rank
- #4080
- State rank
- #255 of 826 in TX
Livability — Iowa Colony
- Score
- 64/100
- State rank
- #757
- US rank
- #13904
Category grades
Schools grade is shown separately in the Schools card above.
Census & demographics
- County
- Brazoria County · 374,982 people
- City population
- 52,747
- Metro
- Houston-The Woodlands-Sugar Land, TX
- Population (ZIP)
- 52,747
- Household income
- $119,287
- Rent vs Own
- Severe rent burden
- 251.0
Population outlook (Brazoria County) Hauer SSP2
- Today (2025)
- 420,414 people
- By 2030
- 457,585 · +8.8%
- By 2040
- 532,232 · +26.6%
- By 2050
- 605,399 · +44.0%
- By 2075
- 779,358 · +85.4%
- By 2100
- 883,759 · +110.2%
Race, ethnicity, and origin ACS 2023
- Neighborhood character
- Highly diverse neighborhood (Simpson 0.70)
- Race & ethnicity
- Hispanic / Latino 38% Black 34% White 20% Two or more races 18% Asian 5%
- Hispanic origin (detail)
- Mexican 31% Puerto Rican 2%
- Common ancestry
- Lithuanian 1% Slovak 1% Romanian 1%
- Foreign-born
- 16% · Canada, Vietnam, China
- Languages at home
- 64% English-only · Spanish 28% Other Asian/Pacific 2% Vietnamese 1%
Political lean MEDSL · Brazoria
- 2024 margin
- R (+19.7) · D 39.5% · R 59.2% · Other 1.3%
- 2008→2024 swing
- +9.9pp toward D · 2008: -29.6pp · 2024: -19.7pp
- All cycles
- 2024: R+19.7 2020: R+18.2 2016: R+24.6 2012: R+34.2 2008: R+29.6
Not yet ingested
- Civics
- —
Market trends
- HPI YoY
- ▼ -120.19%
- Current HPI
- 198.6559
- Rent YoY
- ▲ 0.44%
- Metro
- Houston-The Woodlands-Sugar Land, TX
- State GDP YoY
- ▲ 3.95%
- F500 in state
- 110
Industry mix (Fortune 500 HQ in TX)
| Industry | F500 HQs | Revenue |
|---|---|---|
| Energy | 16 | $1,198B |
|
||
| Technology | 5 | $198B |
|
||
| Engineering / Construction | 4 | $72B |
|
||
| Energy Services | 3 | $60B |
|
||
| Utilities | 3 | $41B |
|
||
| Healthcare | 2 | $330B |
|
||
Price history
-5.0% since first listed3 events — show timeline
- 2026-04-02 Price Changed $306,990 Zillow
- 2025-02-04 Price Changed $316,990 Zillow
- 2024-11-13 Listed $322,990 Zillow
Cash-flow waterfall
monthlySold comps — $/sqft
last 12 mo · ≤1 miLoading sold comps…