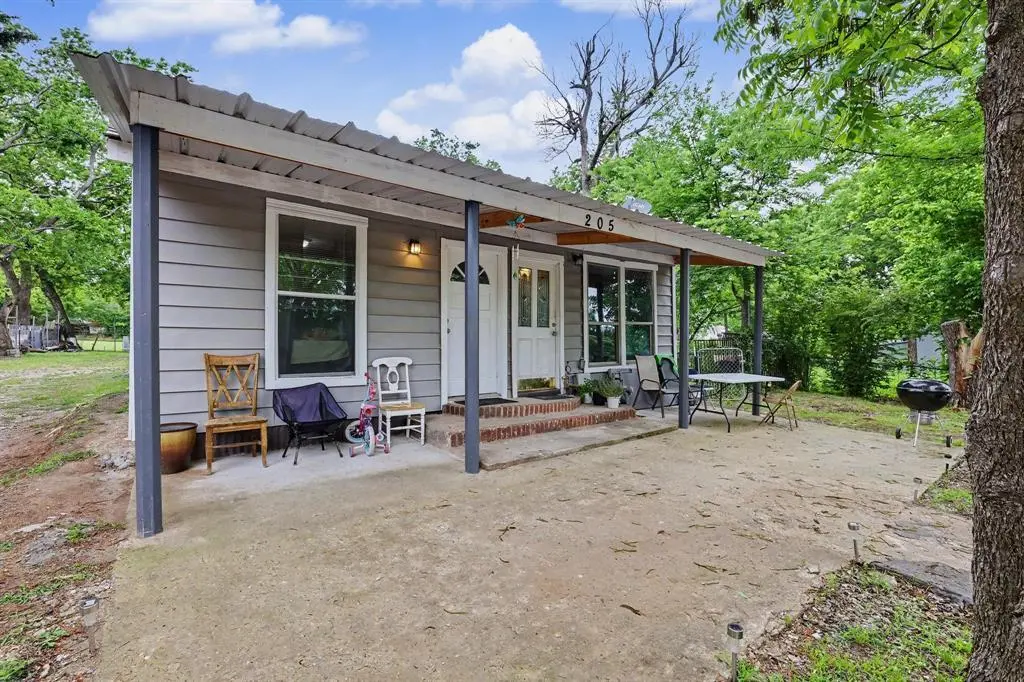
205 S Main St · Bonham, TX
Flood risk 1/10 · Minimal
- FEMA flood zone
- X (unshaded)
- Chance of flooding over 30 yrs
- 0.0%
- Est. flood insurance / yr
- $507 – $1,088
Fire risk 7/10 · Major
- Est. fire insurance / yr
- $1,222 – $2,270
Heat risk 7/10 · Major
- Hot days now (above 111°F)
- 7 days/yr
- Hot days in 30 yrs
- 22 days/yr
Wind risk 5/10 · Moderate
- Chance of severe wind over 30 yrs
- 26.0%
Air-quality risk 2/10 · Minimal
- Unhealthy air days now
- 1 days/yr
- Unhealthy air days in 30 yrs
- 1 days/yr
Risk factors via First Street. Map © Google.
Why this score? — see what drove the B- grade
The composite is a weighted blend of 9 inputs, each scored 0–100. Each bar is that input's sub-score; the figure is the points it added to the 100-point composite (weight × sub-score).
- Cash flow +24.6/30.0
- ARV discount +15.0/15.0
- DSCR +7.9/10.0
- 1% rule +6.4/10.0
- Schools +3.2/10.0
- Livability +3.2/5.0
- Rent growth +2.5/5.0
- Condition / age +2.5/5.0
- Appreciation +0.0/10.0
$120,000
🖨 Deal sheet 📄 Offer letter ✓ Due diligence
Listing remarks
Nestled in the heart of Bonham, this duplex offers a solid opportunity for investors or buyers looking to add value. Each side features 1 bedroom and 1 full bathroom, providing functional layouts for tenants or future improvements. Can also be converted to a two to three bedroom with 2 bathrooms as a non duplex home, if desired. Put in a little work or keep it as is, the options are endless! Just minutes from downtown, the property provides convenient access to local shops, dining, and community amenities, all while offering flexible multi-unit living and income potential.
Key facts
- Income potential
- Convenient access
- Functional layouts
Tags
Property features AI
Finance
- Other: No restrictions; Horse not permitted; Possession at closing/funding
- Financial info: Accepts cash and conventional financing; Treat as clear loan type; No second mortgage
- HOA & community: No association
Exterior
- Parking: Gravel parking; On-street parking
- Utilities: City water; City sewer; Electricity connected; Individual gas meter; Natural gas available; No municipal utility district
- Home design: Single family residence; Residential property; Built in 1941; Not attached (detached); Lot less than 0.5 acre (approximately 0.258 acres); Subdivision: Reich Add
- Construction: Wood construction; Composition shingle roof; Pillar/post/pier foundation
- Exterior features: Covered front and rear porches; Covered porch(es)
Interior
- Kitchen: Gas range; Microwave
- Bedrooms: 2 bedrooms (both on main level)
- Flooring: Luxury vinyl plank; Vinyl
- Bathrooms: 2 full bathrooms
- Heating & cooling: Central heating; Central air conditioning
- Interior features: High speed internet available; One level (single-story); 9 total rooms; 2 living areas; 2 dining areas
- Laundry & utility: Washer hookup
Neighborhood map
What this means for you Summary
Snapshot
- This is a 2-bed/1.0-bath single-family listed at $120k.
Deal economics
- At list price, monthly cash flow is $248 ($3k/yr) — positive.
- The deal already cash-flows at list — no discount required.
- Meets the 1% rule at list price ($1k rent vs $120k).
- Recommended offer: $116k (3.0% below list) — sets the bar for market timing.
- Cap rate 8.8% vs local median 3.5% in Bonham — top-decile yield for the area; either an underpriced asset or a hidden risk that comps aren't pricing in. Stress-test before assuming the spread holds.
Location & tenants
- Location reads 64/100 on livability (#785 in TX) — a middle-class / working-renter tenant base. Strengths: crime A+, cost of living A+, housing A+; Watch: employment D, schools D-, amenities F.
- Bonham ISD (town): math 37% / reading 38% proficiency, ranked #477 of 826 in TX (top 58%) — families likely to look elsewhere, expect single-tenant / working-renter base with shorter leases.
- Market conditions: 277 active listings in the ZIP; 11 comparable units currently listed for rent nearby; rentals lingering (median 44d on market — plan ~5-8 weeks vacancy on turnover, expect pricing pressure); 82% of comp listings sitting > 30 days — soft ceiling on asking rent; 82 units permitted in Fannin County in 2024 (0 in 5+ unit buildings).
Forward outlook
- Local home prices are declining (-3.0%/yr); year-one equity from $830 of loan paydown is wiped out by about $4k of value loss. Plan a longer hold.
- Fannin County population projected to shrink 6% by 2050 — rents likely to lag national; underwrite the cash flow, not the appreciation.
Negotiation context
- It's been on market 56 days — a 3% lower offer ($116k) is reasonable based on typical stale-listing flexibility.
Risks & watch-outs
- Watch-outs: built in 1941 — expect roof / HVAC / electrical / plumbing capex.
- Climate carrying-cost: moderate wind risk, 26% chance of damaging wind over 30y; major wildfire risk; extreme-heat days projected 7→22/yr by 2055 (HVAC capex compounding) — expect insurance premiums to compound above CPI over the hold.
Questions for the listing agent
- It's been on market 56 days. Have you received any prior offers? Is the seller open to a 3% concession, seller financing, or rate buy-down credit?
- Built in 1941 — when were the roof, HVAC, electrical panel, plumbing, and water heater last replaced?
- Is there a deadline driving the sale (1031 exchange, divorce, estate, relocation)? That informs how much negotiation room exists.
- Schools are D-rated, which usually means shorter tenancies and higher turnover. Who's the typical renter profile here, and what's been the actual vacancy rate?
- What's the average days-on-market for RENTAL listings here right now (not sales)? A rising rental-DOM trend means longer vacancies and softer asking-rent achievability than the comps imply.
- What's the recent tenant-quality profile in this submarket — average credit score on applications, eviction rate, late-payment / NSF rate, and stable-employment percentage? A property-management company in the area should have these aggregated.
- How much new for-sale + rental construction is in the pipeline within 1–3 miles? Heavy new supply typically softens prices + rents 12–24 months out; constrained supply supports both.
Investment metrics
- 1% rule
- 1.14% ✓
- Cap rate
- 8.77%
- Cash-on-cash
- 8.85%
- DSCR
- 1.39
- GRM
- 7.3
CMA / ARV
- ARV (median comp)
- $198,461
- List price
- $120,000
- Delta
- -39.53%
- Verdict
- UNDERPRICED
- Comps
- 20 within 1.0 mi
Show comp detail 7 sales within ~0.75 mi
| Address | Dist | Beds/Ba | Sqft | Sold | Price | $/sf | Match |
|---|---|---|---|---|---|---|---|
| 314 Braz St | 0.12mi | 3/2.0 (+1) | 1,218 (+6%) | 14mo | $239,000 | $196 | 64 |
| 501 S 5th St | 0.29mi | 3/2.0 (+1) | 1,217 (+6%) | 6mo | $224,900 | $185 | 63 |
| 502 S 3rd St | 0.25mi | 3/2.0 (+1) | 1,217 (+6%) | 12mo | $235,000 | $193 | 59 |
| 202 Pine St | 0.56mi | 3/2.0 (+1) | 1,265 (+10%) | 1mo | $219,000 | $173 | 47 |
| 906 Benton St | 0.52mi | 3/2.0 (+1) | 1,243 (+8%) | 11mo | $223,000 | $179 | 44 |
| 810 S 4th St | 0.50mi | 3/2.0 (+1) | 1,217 (+6%) | 17mo | $230,000 | $189 | 44 |
| 423 E 5th St | 0.67mi | 3/2.0 (+1) | 1,275 (+11%) | 4mo | $239,990 | $188 | 38 |
Match score weights: distance 35% · size 25% · config 20% · recency 20%. Top-matched comps best support the ARV.
Projected returns pro-forma
-3.0% appreciation · 3.0% rent growth · sell at horizon
- IRR
- -2.9%
- Equity multiple
- 0.89×
- Total profit
- $-3,639
- Equity at exit
- $17,892
- IRR
- 6.8%
- Equity multiple
- 1.51×
- Total profit
- $17,254
- Equity at exit
- $10,375
Cash invested: $33,600 (down + closing). Projections, not guarantees.
Landlord ↔ Tenant lean methodology
- Overall (STATE)
- 87 Strongly Landlord-Friendly
- State Texas
- 87 Strongly Landlord-Friendly · R+5
- County
- — inherits STATE
- City
- — inherits STATE
ZIP-level market 75418
- Home prices YoY
- -8.9%
- Active inventory
- 277
- Price-to-rent
- 7.3×
Monthly cashflow live
- Estimated rent
- $1,372 high interval (Pro) →
- Mortgage (P&I)
- −$629
- Tax from tax record
- −$157 /mo · $1,882/yr
- Insurance
- −$50
- HOA
- −$0
- Vacancy / Maint / Mgmt
- −$288
- Net cashflow
- $248
Break-even live
UW: 25.0% down · 7.5% · 30yr · 1.5% tax · 5.0% vac · 8.0% maint · 8.0% mgmt
Financing live
Cash to close
- Down payment
- $30,000
- Closing costs
- $3,600
- Reserves months
- —
- Total cash needed
- —
Loan-product check · same deal, 3 products live
Conventional
25% down · 7.5% · 30yr
- Down + closing
- —
- Monthly P&I
- —
- Monthly cashflow
- —
- DSCR
- —
- Eligible?
- —
Personal DTI + credit; lowest rate.
DSCR
20% down · 8.5% · 30yr
- Down + closing
- —
- Monthly P&I
- —
- Monthly cashflow
- —
- DSCR
- —
- Eligible?
- —
No personal income docs; deal must DSCR.
Hard money
10% down · 12.0% · 12mo
- Down + closing
- —
- Monthly P&I
- —
- Monthly cashflow
- —
- DSCR
- —
- Eligible?
- —
Short-term bridge; refi at stabilization.
Rent comps 11 comps
| Address | Beds | Baths | Sqft | Rent | $/sqft | DOM | Units | Dist |
|---|---|---|---|---|---|---|---|---|
| 406 S 6th St Unit 1 Bonham, TX | 3.0 | 2.0 | 1198 | $1,300 | $1.09 | 43d | 1 | 0.44mi |
| 805 S 6th St Unit 1 Bonham, TX | 3.0 | 2.5 | 1229 | $1,450 | $1.18 | 43d | 1 | 0.54mi |
| 608 E 3rd St Unit 2 Bonham, TX | 3.0 | 2.0 | 1197 | $1,295 | $1.08 | 43d | 1 | 0.59mi |
| 613 E 3rd St Bonham, TX | 3.0 | 2.0 | 1197 | $1,299 | $1.09 | 22d | 1 | 0.61mi |
| 406 W 6th St Bonham, TX | 3.0 | 2.0 | 1198 | $1,350 | $1.13 | 43d | 1 | 0.75mi |
| 412 E 7th St Unit 2 Bonham, TX | 3.0 | 2.5 | 1366 | $1,500 | $1.10 | 43d | 1 | 0.77mi |
| 1014 Pine St Bonham, TX | 3.0 | 2.0 | 1200 | $1,475 | $1.23 | 43d | 1 | 1.02mi |
| 808 E 12th St Bonham, TX | 3.0 | 2.0 | 1234 | $1,595 | $1.29 | 18d | 1 | 1.15mi |
| 317 Jones St Bonham, TX | 3.0 | 2.0 | 1067 | $1,500 | $1.41 | 43d | 1 | 1.18mi |
| 913 W 12th St Bonham, TX | 3.0 | 2.0 | 1355 | $1,700 | $1.25 | 43d | 1 | 1.22mi |
| 708 Union Ave Bonham, TX | 2.0 | 1.0 | 828 | $1,100 | $1.33 | 43d | 1 | 1.35mi |
Listing history 18 events
-
2026-06-19days on market $120,000 Active 56 DOM
-
2026-06-18days on market $120,000 Active 55 DOM
-
2026-06-17days on market $120,000 Active 54 DOM
-
2026-06-16days on market $120,000 Active 53 DOM
-
2026-06-15days on market $120,000 Active 52 DOM
-
2026-06-14days on market $120,000 Active 50 DOM
-
2026-06-12days on market $120,000 Active 49 DOM
-
2026-06-09days on market $120,000 Active 46 DOM
-
2026-06-08days on market $120,000 Active 45 DOM
-
2026-06-07days on market $120,000 Active 44 DOM
-
2026-06-05days on market $120,000 Active 42 DOM
-
2026-06-04days on market $120,000 Active 40 DOM
-
2026-06-02days on market $120,000 Active 39 DOM
-
2026-06-01days on market $120,000 Active 38 DOM
-
2026-05-31days on market $120,000 Active 37 DOM
-
2026-05-31days on market $120,000 Active 36 DOM
-
2026-04-24$130,000 Active 579-char remark
-
2021-01-25soldstatus
ⓘ Source: listings_history table (triggers on properties + properties_extension) + one-shot
backfill from property_details.listing_events for pre-trigger history.
Tax reassessment forecast TX · Resets to sale price
- Current annual tax
- $1,882 · $157/mo
- Projected year-2 tax
- $2,196 · $183/mo
- Expected delta
- +$314/yr (+$26/mo · 16.7%)
ⓘ Screening estimate from a state-policy table — verify with the county assessor before closing.
Climate risk First Street
- Flood 1/10 Low FEMA zone X (unshaded) · 0% chance over 30 yrs
- Wildfire 7/10 Severe
- Heat 7/10 Severe 7 d/yr ≥111°F today · 22 d/yr by 30 yrs out
- Wind 5/10 Major 26% chance of damaging wind over 30 yrs
- Air quality 2/10 Low 1 unhealthy d/yr today · 1 by 30 yrs out
Nearby sold comps map
Loading sold comps map…
Walkable amenities ~0.75 mi
Loading nearby amenities…
Taxation est. · year 1
- Rental income
- $16,464
- − Mortgage interest
- −$6,722
- − Property taxes
- −$1,882
- − Insurance
- −$600
- − Repairs & maintenance
- −$1,317
- − Management
- −$1,317
- − Depreciation
- −$3,491
- Taxable income
- $1,135
- Est. tax owed @ 24.0%
- −$272
- After-tax cash flow
- $2,701/yr
For passive investors: Depreciation is non-cash, so a rental often shows a tax loss while cash-flowing — sheltering income. Rental losses are passive: they offset passive income freely, and up to $25,000/yr can offset ordinary (W-2) income if you actively participate and your MAGI is under $100k (phasing out to $0 by $150k); unused losses carry forward. On sale, claimed depreciation is recaptured at up to 25%, and gains may owe capital-gains tax (a 1031 exchange can defer both). Figures are a year-1 estimate at your 24.0% rate — not tax advice; consult a CPA.
Schools (NCES district)
- District
- Bonham ISD
- NCES district ID
- 4810800
- Math proficiency
- 37% ▼ -1.00%
- Reading proficiency
- 38% ▼ -2.00%
- Median HH income
- $41,740
- Composite
- 31.63/100
- National rank
- #5937
- State rank
- #477 of 826 in TX
Livability — Bonham
- Score
- 64/100
- State rank
- #785
- US rank
- #14360
Category grades
Schools grade is shown separately in the Schools card above.
Census & demographics
- Census place
- Bonham, TX
- County
- Fannin County · 15,155 people
- City population
- 15,155
- Metro
- Bonham, TX
- Population (ZIP)
- 15,155
- Household income
- $68,918
- Rent vs Own
- Severe rent burden
- 281.0
Population outlook (Fannin County) Hauer SSP2
- Today (2025)
- 33,423 people
- By 2030
- 33,035 · -1.2%
- By 2040
- 32,250 · -3.5%
- By 2050
- 31,462 · -5.9%
- By 2075
- 29,447 · -11.9%
- By 2100
- 25,459 · -23.8%
Race, ethnicity, and origin ACS 2023
- Neighborhood character
- Predominantly White (68%)
- Race & ethnicity
- White 68% Hispanic / Latino 17% Black 10% Two or more races 8%
- Hispanic origin (detail)
- Mexican 16%
- Common ancestry
- Lithuanian 3% Slovak 1% Italian 1%
- Foreign-born
- 7% · Canada, Philippines
- Languages at home
- 85% English-only · Spanish 14%
Political lean MEDSL · Fannin
- 2024 margin
- Solid R (+67.4) · D 15.9% · R 83.3%
- 2008→2024 swing
- -27.8pp toward R · 2008: -39.6pp · 2024: -67.4pp
- All cycles
- 2024: R+67.4 2020: R+63.4 2016: R+61.9 2012: R+52.5 2008: R+39.6
Not yet ingested
- Civics
- —
Market trends
- HPI YoY
- ▼ -25.59%
- Current HPI
- 262.7177
- Rent YoY
- —
- Metro
- Bonham, TX
- State GDP YoY
- ▲ 3.95%
- F500 in state
- 110
Industry mix (Fortune 500 HQ in TX)
| Industry | F500 HQs | Revenue |
|---|---|---|
| Energy | 16 | $1,198B |
|
||
| Technology | 5 | $198B |
|
||
| Engineering / Construction | 4 | $72B |
|
||
| Energy Services | 3 | $60B |
|
||
| Utilities | 3 | $41B |
|
||
| Healthcare | 2 | $330B |
|
||
Price history
-7.7% since first listed3 events — show timeline
- 2026-05-29 Price Changed $120,000 NTREIS
- 2026-04-24 Listed $130,000 NTREIS
- 2021-01-25 Sold (Public Records) — Public Records
Property tax history
+15.6%/yrLatest (2025): $1,882 · -0.9% YoY. Source: county tax records.
Cash-flow waterfall
monthlySold comps — $/sqft
last 12 mo · ≤1 miLoading sold comps…