 🌊 Lakefront
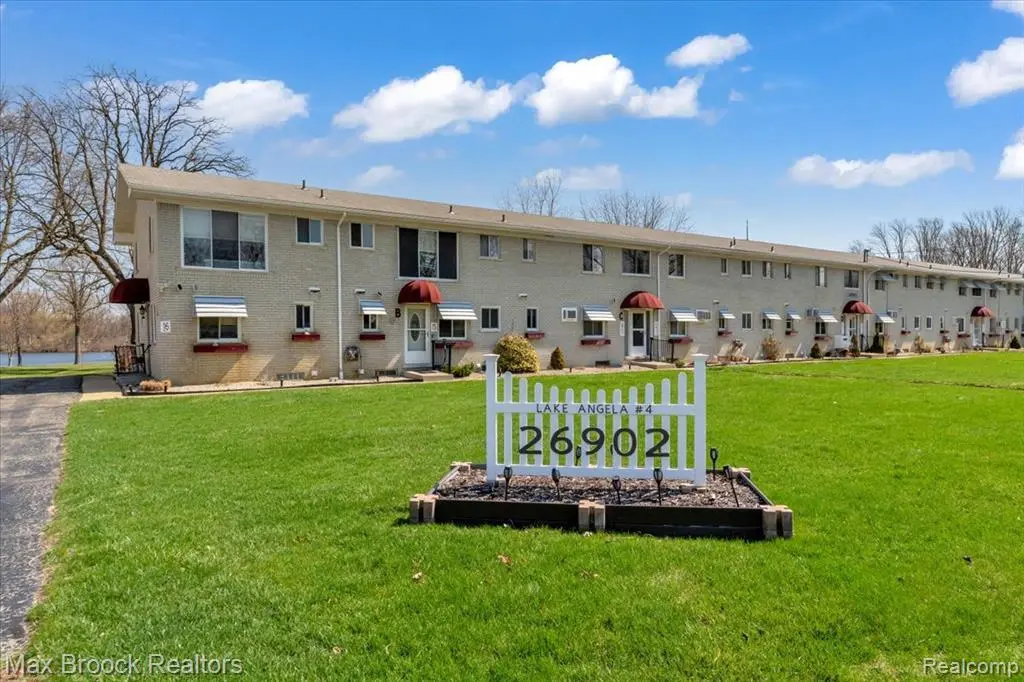
26902 Sandy Hill Ct #15 · Lyon, MI
Flood risk 1/10 · Minimal
- FEMA flood zone
- X (unshaded)
- Chance of flooding over 30 yrs
- 0.0%
- Est. flood insurance / yr
- $473 – $860
Fire risk 1/10 · Minimal
- Est. fire insurance / yr
- $784 – $1,456
Heat risk 2/10 · Minimal
- Hot days now (above 95°F)
- 7 days/yr
- Hot days in 30 yrs
- 15 days/yr
Wind risk 2/10 · Minimal
- Chance of severe wind over 30 yrs
- —
Air-quality risk 2/10 · Minimal
- Unhealthy air days now
- 1 days/yr
- Unhealthy air days in 30 yrs
- 2 days/yr
Risk factors via First Street. Map © Google.
Why this score? — see what drove the B+ grade
The composite is a weighted blend of 9 inputs, each scored 0–100. Each bar is that input's sub-score; the figure is the points it added to the 100-point composite (weight × sub-score).
- Cash flow +30.0/30.0
- ARV discount +15.0/15.0
- 1% rule +10.0/10.0
- DSCR +10.0/10.0
- Schools +4.7/10.0
- Rent growth +2.5/5.0
- Livability +2.5/5.0
- Condition / age +2.5/5.0
- Appreciation +0.0/10.0
$129,900
🖨 Deal sheet 📄 Offer letter ✓ Due diligence
Listing remarks
Lakefront living in this gorgeous Lake Angela Townhouse Co-op! Over 55 Community with wonderful amenities! Don’t miss this beautiful two-bedroom, one full bath, one half bath unit with updates throughout! Newer kitchen w/ SS appliances, bathroom, flooring, paint and finished lower level. One carport space and additional parking. Views and direct access to tranquil Lake Angela that allows small electric engines, paddle boats, beach and peaceful beauty. Part of a 12 unit/apartment building association with only 4 townhouse style units. Association financials are all up to date and Association is extremely diligent and well run. Emergency generator for the 4 townhouse units. Sale is pend
Key facts
- Lakefront living
- Newer kitchen
- Emergency generator
Tags
Property features AI
Finance
- Other: Senior community; Pet restrictions apply (breed restrictions and limits)
- HOA & community: Homeowners association with monthly fee of $330; HOA covers gas, water, grounds maintenance, structure maintenance, and snow removal; Association provides grounds maintenance
Exterior
- Parking: Detached parking; Carport; Parking lot (no garage)
- Utilities: Shared septic
- Home design: Residential stock cooperative; Two levels; Ground-level entry with steps
- Construction: Brick construction; Asphalt roof; Block foundation; Above-grade finished area approximately 1,000; Below-grade finished area approximately 278
- Exterior features: Patio; Porch; Lighting; Beach access and lake privileges (Lake Angela); Paved road access
Interior
- Kitchen: Dishwasher; Disposal; Free-standing electric range; Free-standing refrigerator
- Bedrooms: 7 total rooms (bedroom count not specified)
- Bathrooms: 1 full bathroom; 1 half bathroom
- Heating & cooling: Baseboard heating (natural gas); Ceiling fan(s); Wall unit(s) for cooling
- Interior features: Dishwasher; Disposal; Dryer; Free-standing electric range; Free-standing refrigerator; Washer; Partially finished basement; Private entrance; Lighting
- Laundry & utility: In-unit laundry (washer and dryer)
Neighborhood map
What this means for you Summary
Snapshot
- This is a 2-bed/1.5-bath condo listed at $130k.
Deal economics
- At list price, monthly cash flow is $634 ($8k/yr) — positive.
- The deal already cash-flows at list — no discount required.
- Meets the 1% rule at list price ($2k rent vs $130k).
Location & tenants
- Location reads: area grade B — affects rentability + tenant quality, not the cash-flow math above.
- South Lyon Community Schools (suburban): math 46% / reading 59% proficiency, ranked #74 of 540 in MI (top 14%) — acceptable for families but not a draw, mixed tenant base, ~2y average lease; only 16% free/reduced lunch — higher-income household profile.
- Market conditions: 87 active listings in the ZIP; 2,614 units permitted in Oakland County in 2024 (721 in 5+ unit buildings).
Forward outlook
- Local home prices are declining (-3.0%/yr); year-one equity from $898 of loan paydown is wiped out by about $4k of value loss. Plan a longer hold.
- Oakland County population projected at +10% by 2050 — modest demand growth; plan on rents tracking national, not racing it.
- At projected returns (-3.0% appreciation + 3.0% rent growth), your $36k cash investment doubles in ~6 years — after that, you're playing with house money.
Negotiation context
- Only 1 days on market — expect competitive offers; lowballing is unlikely to land.
- 15 sale attempts since 11y ago with the ask held roughly flat each time — persistent listings suggest the price (not the market) is what's stuck; bring a comps-based counter.
- Current owner paid $52k; list at $130k implies a 150% gain — meaningful room to come down on a strong offer.
Questions for the listing agent
- Built in 1962 — when were the roof, HVAC, electrical panel, plumbing, and water heater last replaced?
- What does the HOA fee cover, when was the last increase, and are there any pending special assessments or reserve-fund shortfalls?
- Any open or pending special assessments — roof, HVAC, plumbing, elevator, façade? What's the per-unit balance and payoff schedule, and is the seller paying it off at close or rolling it to the buyer?
- Is there a deadline driving the sale (1031 exchange, divorce, estate, relocation)? That informs how much negotiation room exists.
- This sits on a lake — are riparian / water-frontage rights deeded with the parcel? Any dock permits, shoreline easements, or HOA water-use restrictions?
- What's the documented flood / surge / shoreline-erosion history here (FEMA AND non-FEMA — e.g., storm surge, creek backup, septic-field saturation)?
- Any water-quality or seasonal algae-bloom issues that affect tenant satisfaction or short-term-rental demand?
- What's the average days-on-market for RENTAL listings here right now (not sales)? A rising rental-DOM trend means longer vacancies and softer asking-rent achievability than the comps imply.
- What's the recent tenant-quality profile in this submarket — average credit score on applications, eviction rate, late-payment / NSF rate, and stable-employment percentage? A property-management company in the area should have these aggregated.
- How much new apartment / multifamily construction is in the pipeline within 1–3 miles? Heavy new supply (>2% of stock underway) typically softens rents 12–24 months out; light construction supports rent growth.
Investment metrics
- 1% rule
- 1.81% ✓
- Cap rate
- 12.15%
- Cash-on-cash
- 20.93%
- DSCR
- 1.93
- GRM
- 4.6
CMA / ARV
- ARV (median comp)
- $248,265
- List price
- $129,900
- Delta
- -47.68%
- Verdict
- UNDERPRICED
- Comps
- 20 within 1.0 mi
Projected returns pro-forma
-3.0% appreciation · 3.0% rent growth · sell at horizon
- IRR
- 13.5%
- Equity multiple
- 1.54×
- Total profit
- $19,598
- Equity at exit
- $19,369
- IRR
- 22.4%
- Equity multiple
- 2.93×
- Total profit
- $70,066
- Equity at exit
- $11,231
Cash invested: $36,372 (down + closing). Projections, not guarantees.
Landlord ↔ Tenant lean methodology
- Overall (STATE)
- 62 Landlord-Friendly
- State Michigan
- 62 Landlord-Friendly · EVEN
- County
- — inherits STATE
- City
- — inherits STATE
ZIP-level market 48165
- Active inventory
- 87
- Price-to-rent
- 4.6×
Monthly cashflow live
- Estimated rent
- $2,357 medium interval (Pro) →
- Mortgage (P&I)
- −$681
- Tax est. 1.5%
- −$162 /mo · $1,948/yr
- Insurance
- −$54
- HOA
- −$330
- Vacancy / Maint / Mgmt
- −$495
- Net cashflow
- $634
Break-even live
UW: 25.0% down · 7.5% · 30yr · 1.5% tax · 5.0% vac · 8.0% maint · 8.0% mgmt
Financing live
Cash to close
- Down payment
- $32,475
- Closing costs
- $3,897
- Reserves months
- —
- Total cash needed
- —
Loan-product check · same deal, 3 products live
Conventional
25% down · 7.5% · 30yr
- Down + closing
- —
- Monthly P&I
- —
- Monthly cashflow
- —
- DSCR
- —
- Eligible?
- —
Personal DTI + credit; lowest rate.
DSCR
20% down · 8.5% · 30yr
- Down + closing
- —
- Monthly P&I
- —
- Monthly cashflow
- —
- DSCR
- —
- Eligible?
- —
No personal income docs; deal must DSCR.
Hard money
10% down · 12.0% · 12mo
- Down + closing
- —
- Monthly P&I
- —
- Monthly cashflow
- —
- DSCR
- —
- Eligible?
- —
Short-term bridge; refi at stabilization.
HOA detail condo
- Monthly dues
- $330 · $3,960/yr
- Likely covers
- electric
- Assessments
- None detected in remarks — confirm with the listing agent.
Listing history 42 events
-
2026-06-17days on market $129,900 Active 1 DOM
-
2026-06-17days on market $129,900 Active 41 DOM
-
2026-06-16days on market $129,900 Active 40 DOM
-
2026-06-15days on market $129,900 Active 39 DOM
-
2026-06-13days on market $129,900 Active 37 DOM
-
2026-06-13days on market $129,900 Active 36 DOM
-
2026-06-09days on market $129,900 Active 33 DOM
-
2026-06-08days on market $129,900 Active 32 DOM
-
2026-06-07days on market $129,900 Active 31 DOM
-
2026-06-04days on market $129,900 Active 28 DOM
-
2026-06-03days on market $129,900 Active 27 DOM
-
2026-06-02days on market $129,900 Active 26 DOM
-
2026-06-01days on market $129,900 Active 25 DOM
-
2026-05-31days on market $129,900 Active 24 DOM
-
2026-05-07historical
-
2026-05-07$129,900 Active 1214-char remark
-
2026-05-07$129,900 Active
-
2026-05-07historical
-
2026-02-26$139,900 Active
-
2026-02-26$139,900 Active
-
2026-02-26historical
-
2026-02-26historical
-
2025-11-21$149,900 Active
-
2025-11-21$149,900 Active
-
2025-11-19historical
-
2015-11-18soldstatus $52,000 Sold
-
2015-09-18historical
-
2015-09-15historical
-
2015-07-07price $58,000
-
2015-06-05price $60,000
-
2015-05-28historical
-
2015-05-28$65,000 Active
-
2015-05-28$58,000
-
2015-05-28historical
-
2015-03-20historical
-
2015-03-20status Active
-
2015-03-20historical
-
2015-03-19historical
-
2015-03-19$65,000 Active
-
2015-01-15$65,000 Active
-
2015-01-14$65,000
-
2015-01-14$65,000
ⓘ Source: listings_history table (triggers on properties + properties_extension) + one-shot
backfill from property_details.listing_events for pre-trigger history.
Climate risk First Street
- Flood 1/10 Low FEMA zone X (unshaded) · 0% chance over 30 yrs
- Wildfire 1/10 Low
- Heat 2/10 Low 7 d/yr ≥95°F today · 15 d/yr by 30 yrs out
- Wind 2/10 Low
- Air quality 2/10 Low 1 unhealthy d/yr today · 2 by 30 yrs out
Nearby sold comps map
Loading sold comps map…
Walkable amenities ~0.75 mi
Loading nearby amenities…
Taxation est. · year 1
- Rental income
- $28,286
- − Mortgage interest
- −$7,276
- − Property taxes
- −$1,948
- − Insurance
- −$650
- − Repairs & maintenance
- −$2,263
- − Management
- −$2,263
- − HOA
- −$3,960
- − Depreciation
- −$3,779
- Taxable income
- $6,147
- Est. tax owed @ 24.0%
- −$1,475
- After-tax cash flow
- $6,138/yr
For passive investors: Depreciation is non-cash, so a rental often shows a tax loss while cash-flowing — sheltering income. Rental losses are passive: they offset passive income freely, and up to $25,000/yr can offset ordinary (W-2) income if you actively participate and your MAGI is under $100k (phasing out to $0 by $150k); unused losses carry forward. On sale, claimed depreciation is recaptured at up to 25%, and gains may owe capital-gains tax (a 1031 exchange can defer both). Figures are a year-1 estimate at your 24.0% rate — not tax advice; consult a CPA.
Schools (NCES district)
- District
- South Lyon Community Schools
- NCES district ID
- 2632250
- Math proficiency
- 46% ▼ -10.00%
- Reading proficiency
- 59% ▼ -4.00%
- Median HH income
- $71,419
- Composite
- 46.86/100
- National rank
- #2372
- State rank
- #74 of 540 in MI
Livability — Lyon
No livability data for this city. (Only ~50 U.S. cities are tracked.)
Census & demographics
- Population (ZIP)
- 9,141
Population outlook (Oakland County) Hauer SSP2
- Today (2025)
- 1,335,747 people
- By 2030
- 1,375,100 · +2.9%
- By 2040
- 1,435,385 · +7.5%
- By 2050
- 1,469,250 · +10.0%
- By 2075
- 1,531,946 · +14.7%
- By 2100
- 1,450,485 · +8.6%
Race, ethnicity, and origin ACS 2023
- Neighborhood character
- Predominantly White (76%)
- Race & ethnicity
- White 76% Asian 11% Two or more races 10% Hispanic / Latino 8% Black 2%
- Hispanic origin (detail)
- Mexican 7%
- Common ancestry
- Romanian 9% Italian 2% Lithuanian 2%
- Foreign-born
- 8% · Canada, Vietnam, China
- Languages at home
- 87% English-only · Other Asian/Pacific 6% Spanish 4% Vietnamese 1%
Political lean MEDSL · Oakland
- 2024 margin
- D (+10.6) · D 54.4% · R 43.8% · Other 1.9%
- 2008→2024 swing
- -3.9pp toward R · 2008: 14.5pp · 2024: 10.6pp
- All cycles
- 2024: D+10.6 2020: D+14.1 2016: D+8.1 2012: D+8.1 2008: D+14.5
Not yet ingested
- Civics
- —
Market trends
- HPI YoY
- ▼ -169.34%
- Current HPI
- 211.8766
- Rent YoY
- —
- Metro
- —
- State GDP YoY
- ▲ 1.37%
- F500 in state
- 28
Industry mix (Fortune 500 HQ in MI)
| Industry | F500 HQs | Revenue |
|---|---|---|
| Automotive Parts | 3 | $48B |
|
||
| Automotive | 2 | $372B |
|
||
| Chemicals | 1 | $45B |
|
||
| Automotive Retail | 1 | $29B |
|
||
| Healthcare / Medical Devices | 1 | $23B |
|
||
| Automotive Technology | 1 | $20B |
|
||
Price history
+99.8% since first listed32 events — show timeline
- 2026-06-17 Listed $129,900 REALCOMP
- 2026-06-17 Listed $129,900 MiRealSource-MiMLS
- 2026-06-17 Listing Removed — REALCOMP
- 2026-06-17 Listing Removed — MiRealSource-MiMLS
- 2026-05-07 Listing Removed — REALCOMP
- 2026-05-07 Listing Removed — MiRealSource-MiMLS
- 2026-05-07 Listed $129,900 REALCOMP
- 2026-05-07 Listed $129,900 MiRealSource-MiMLS
- 2026-02-26 Listing Removed — REALCOMP
- 2026-02-26 Listing Removed — MiRealSource-MiMLS
- 2026-02-26 Listed $139,900 REALCOMP
- 2026-02-26 Listed $139,900 MiRealSource-MiMLS
- 2025-11-21 Listed $149,900 MiRealSource-MiMLS
- 2025-11-21 Listed $149,900 REALCOMP
- 2025-11-19 Coming Soon — MiRealSource-MiMLS
- 2015-11-18 Sold (MLS) $52,000 REALCOMP
- 2015-09-18 Listing Removed — REALCOMP
- 2015-09-15 Listing Removed — MiRealSource-MiMLS
- 2015-07-07 Price Changed $58,000 REALCOMP
- 2015-06-05 Price Changed $60,000 REALCOMP
- 2015-05-28 Listing Removed — REALCOMP
- 2015-05-28 Listed $65,000 REALCOMP
- 2015-05-28 Listing Removed — MiRealSource-MiMLS
- 2015-05-28 Listed $58,000 MiRealSource-MiMLS
- 2015-03-20 Listing Removed — REALCOMP
- 2015-03-20 Relisted — REALCOMP
- 2015-03-20 Listing Removed — MiRealSource-MiMLS
- 2015-03-19 Listing Removed — REALCOMP
- 2015-03-19 Listed $65,000 REALCOMP
- 2015-01-15 Listed $65,000 REALCOMP
- 2015-01-14 Listed $65,000 MiRealSource-MiMLS
- 2015-01-14 Listed $65,000 MiRealSource-MiMLS
Property tax history
+5.0%/yrLatest (2025): $15,883 · +4.1% YoY. Source: county tax records.
Cash-flow waterfall
monthlySold comps — $/sqft
last 12 mo · ≤1 miLoading sold comps…