27284 Cottage Rd #9182 · Long Neck, DE
Flood risk 7/10 · Major
- FEMA flood zone
- AE
- Chance of flooding over 30 yrs
- 0.95%
- Est. flood insurance / yr
- $2,026 – $9,024
Fire risk 2/10 · Minimal
- Est. fire insurance / yr
- $476 – $884
Heat risk 8/10 · Major
- Hot days now (above 100°F)
- 7 days/yr
- Hot days in 30 yrs
- 18 days/yr
Wind risk 8/10 · Major
- Chance of severe wind over 30 yrs
- 80.0%
Air-quality risk 2/10 · Minimal
- Unhealthy air days now
- 1 days/yr
- Unhealthy air days in 30 yrs
- 1 days/yr
Risk factors via First Street. Map © Google.
Why this score? — see what drove the B+ grade
The composite is a weighted blend of 9 inputs, each scored 0–100. Each bar is that input's sub-score; the figure is the points it added to the 100-point composite (weight × sub-score).
- Cash flow +30.0/30.0
- ARV discount +15.0/15.0
- 1% rule +10.0/10.0
- DSCR +10.0/10.0
- Livability +3.5/5.0
- Schools +2.9/10.0
- Rent growth +2.5/5.0
- Condition / age +2.2/5.0
- Appreciation +0.0/10.0
$69,500
🖨 Deal sheet 📄 Offer letter ✓ Due diligence
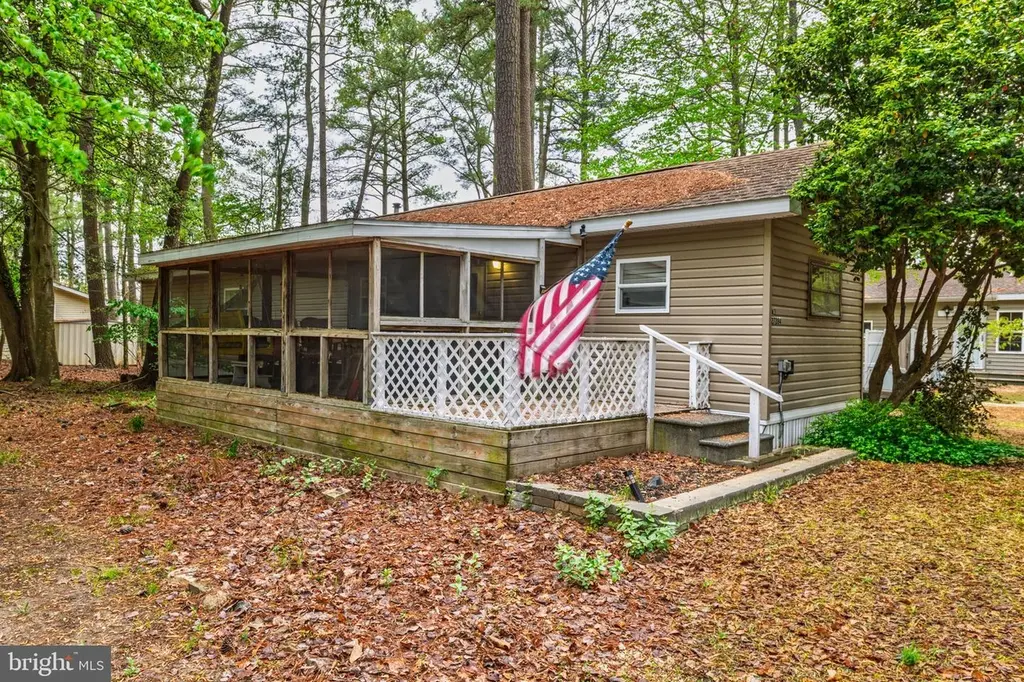
Listing remarks
Coastal living meets quiet, wooded privacy in White House Beach. This well‑kept 2‑bedroom, 1‑bath single‑wide sits on a beautiful, tree‑lined lot that offers rare tranquility just minutes from the bay. Enjoy your mornings and evenings on the large screened‑in porch, perfect for relaxing, dining, or taking in the natural surroundings without the bugs. Inside, the home offers an efficient layout with a comfortable living area, functional kitchen, and two cozy bedrooms. Whether you’re looking for a full‑time residence, a beach getaway, or an affordable investment property, this home delivers excellent value in one of the area’s most desirable leased‑land communities. Contingent on
Key facts
- Functional kitchen
- Tree lined lot
- 332.36 acre lot
Tags
Property features AI
Finance
- Other: Federal flood zone AE; Navigable water; Water body: Indian River Bay
- Financial info: Land lease amount $901 annually (approximately 1 year remaining)
- HOA & community: HOA/association fee $25 annually; Property manager present; Park name: White House Beach; Location: Outside city limits; between Rt 1 & 113; blacktop road
Exterior
- Parking: Driveway parking (2 spaces); Off-street parking (total 2 garage/parking spaces reported)
- Utilities: Public water; Public sewer; Cable TV available; Phone service
- Home design: Manufactured home; Single-story (1 floor); Main entrance faces south; Land lease ownership
- Construction: Vinyl siding; Batts insulation; Asphalt roof; Low-E, vinyl-clad windows; Estimated year built
- Exterior features: Deck(s); Patio(s); Enclosed and screened outdoor living areas; Shed; Side yard(s); Rear yard; Trees/wooded; Water view (Indian River Bay); Water access with private access for boating, canoe/kayak, fishing, personal watercraft
Interior
- Kitchen: Electric oven/range; Refrigerator
- Bedrooms: 2 bedrooms on the main level
- Flooring: Laminate; Vinyl
- Bathrooms: 1 full bathroom on the main level
- Heating & cooling: Forced air heating (90% efficiency); Oil-fired heating; Central A/C (electric); 220 volt electrical service; Electric hot water
- Interior features: Tub/shower; Breakfast area; Ceiling fan(s); Combination dining/living area; Combination kitchen/dining area; Paneled walls
- Laundry & utility: Washer; Electric dryer; Has laundry area
Neighborhood map
What this means for you Summary
Snapshot
- This is a 2-bed/1.0-bath manufactured listed at $70k. Condition is rated fair.
Deal economics
- At list price, monthly cash flow is $500 ($6k/yr) — positive.
- The deal already cash-flows at list — no discount required.
- Meets the 1% rule at list price ($2k rent vs $70k).
- Recommended offer: $67k (3.0% below list) — sets the bar for market timing.
- Cap rate 22.9% vs local median 3.2% in Long Neck — top-decile yield for the area; either an underpriced asset or a hidden risk that comps aren't pricing in. Stress-test before assuming the spread holds.
Location & tenants
- Location reads 69/100 on livability (#30 in DE) — a middle-class / working-renter tenant base. Strengths: cost of living A+, housing A+, crime A-; Watch: employment D+, amenities F, commute F.
- Indian River School District (rural): math 25% / reading 41% proficiency, ranked #14 of 26 in DE (top 54%) — families likely to look elsewhere, expect single-tenant / working-renter base with shorter leases.
- Zoned schools: Indian River High School (math 32% / reading 52%, grade F, #10 of 40 statewide, top 26%, 1,088 students, 0% FRL) — zoned schools average 0% FRL vs 49% district-wide (49 pts lower); this property's tenant base skews higher-income than the district average.
- Market conditions: 865 active listings in the ZIP; solid renter incomes; 4,354 units permitted in Sussex County in 2024 (344 in 5+ unit buildings).
Forward outlook
- Local home prices are declining (-3.0%/yr); year-one equity from $481 of loan paydown is wiped out by about $2k of value loss. Plan a longer hold.
- Sussex County population projected at +25% by 2050 — long-run rental-demand tailwind backs the buy-and-hold thesis.
- At projected returns (-3.0% appreciation + 3.0% rent growth), your $19k cash investment doubles in ~4 years — after that, you're playing with house money.
Negotiation context
- It's been on market 41 days — a 3% lower offer ($67k) is reasonable based on typical stale-listing flexibility.
- 9 sale attempts since 6y ago with the ask held roughly flat each time — persistent listings suggest the price (not the market) is what's stuck; bring a comps-based counter.
- Current owner paid $56k; 24% above their basis — modest negotiation headroom, anchor on the comps not their cost.
Risks & watch-outs
- Watch-outs: flood insurance adds $460/mo.
- Climate carrying-cost: in FEMA flood zone AE (mandatory federal flood insurance); severe wind risk, 80% chance of damaging wind over 30y; extreme-heat days projected 7→18/yr by 2055 (HVAC capex compounding) — expect insurance premiums to compound above CPI over the hold.
Questions for the listing agent
- It's been on market 41 days. Have you received any prior offers? Is the seller open to a 3% concession, seller financing, or rate buy-down credit?
- Have any recent inspections been done? Can we get a copy of the seller's disclosures and any deferred-maintenance estimates?
- Built in 1975 — when were the roof, HVAC, electrical panel, plumbing, and water heater last replaced?
- What's the actual annual flood-insurance premium (NFIP or private), and is the property in a SFHA with mandatory coverage?
- What does the HOA fee cover, when was the last increase, and are there any pending special assessments or reserve-fund shortfalls?
- Is there a deadline driving the sale (1031 exchange, divorce, estate, relocation)? That informs how much negotiation room exists.
- Schools are F-rated, which usually means shorter tenancies and higher turnover. Who's the typical renter profile here, and what's been the actual vacancy rate?
- What's the average days-on-market for RENTAL listings here right now (not sales)? A rising rental-DOM trend means longer vacancies and softer asking-rent achievability than the comps imply.
- What's the recent tenant-quality profile in this submarket — average credit score on applications, eviction rate, late-payment / NSF rate, and stable-employment percentage? A property-management company in the area should have these aggregated.
- How much new for-sale + rental construction is in the pipeline within 1–3 miles? Heavy new supply typically softens prices + rents 12–24 months out; constrained supply supports both.
Investment metrics
- 1% rule
- 2.63% ✓
- Cap rate
- 22.88%
- Cash-on-cash
- 59.23%
- DSCR
- 3.64
- GRM
- 3.2
CMA / ARV
- ARV (median comp)
- $96,952
- List price
- $69,500
- Delta
- -28.32%
- Verdict
- UNDERPRICED
- Comps
- 20 within 1.0 mi
Show comp detail 2 sales within ~0.75 mi
| Address | Dist | Beds/Ba | Sqft | Sold | Price | $/sf | Match |
|---|---|---|---|---|---|---|---|
| 27543 Whelk Ln #9683 | 0.48mi | 2/1.5 | 950 (+2%) | 16mo | $115,000 | $121 | 59 |
| 34587 Scarp St #17051 | 0.75mi | 3/2.0 (+1) | 924 (-1%) | 20mo | $120,000 | $130 | 38 |
Match score weights: distance 35% · size 25% · config 20% · recency 20%. Top-matched comps best support the ARV.
Projected returns pro-forma
-3.0% appreciation · 3.0% rent growth · sell at horizon
- IRR
- 25.9%
- Equity multiple
- 2.07×
- Total profit
- $20,899
- Equity at exit
- $10,363
- IRR
- 33.7%
- Equity multiple
- 4.11×
- Total profit
- $60,476
- Equity at exit
- $6,009
Cash invested: $19,460 (down + closing). Projections, not guarantees.
Landlord ↔ Tenant lean methodology
- Overall (STATE)
- 70 Landlord-Friendly
- State Delaware
- 70 Landlord-Friendly · D+7
- County
- — inherits STATE
- City
- — inherits STATE
ZIP-level market 19966
- Home prices YoY
- -6.4%
- Active inventory
- 865
- Price-to-rent
- 3.2×
Monthly cashflow live
- Estimated rent
- $1,826 medium interval (Pro) →
- Mortgage (P&I)
- −$364
- Tax est. 1.5%
- −$87 /mo · $1,042/yr
- Insurance
- −$29
- Flood insurance flood zone
- −$460 /mo · $5,525/yr
- HOA
- −$2
- Vacancy / Maint / Mgmt
- −$384
- Net cashflow
- $500
Break-even live
UW: 25.0% down · 7.5% · 30yr · 1.5% tax · 5.0% vac · 8.0% maint · 8.0% mgmt
Financing live
Cash to close
- Down payment
- $17,375
- Closing costs
- $2,085
- Reserves months
- —
- Total cash needed
- —
Loan-product check · same deal, 3 products live
Conventional
25% down · 7.5% · 30yr
- Down + closing
- —
- Monthly P&I
- —
- Monthly cashflow
- —
- DSCR
- —
- Eligible?
- —
Personal DTI + credit; lowest rate.
DSCR
20% down · 8.5% · 30yr
- Down + closing
- —
- Monthly P&I
- —
- Monthly cashflow
- —
- DSCR
- —
- Eligible?
- —
No personal income docs; deal must DSCR.
Hard money
10% down · 12.0% · 12mo
- Down + closing
- —
- Monthly P&I
- —
- Monthly cashflow
- —
- DSCR
- —
- Eligible?
- —
Short-term bridge; refi at stabilization.
HOA detail
- Monthly dues
- $2 · $24/yr
Listing history 37 events
-
2026-06-18days on market $69,500 Active 41 DOM
-
2026-06-17days on market $69,500 Active 40 DOM
-
2026-06-16days on market $69,500 Active 39 DOM
-
2026-06-15days on market $69,500 Active 38 DOM
-
2026-06-14days on market $69,500 Active 36 DOM
-
2026-06-13days on market $69,500 Active 35 DOM
-
2026-06-10days on market $69,500 Active 33 DOM
-
2026-06-09days on market $69,500 Active 32 DOM
-
2026-06-08days on market $69,500 Active 31 DOM
-
2026-06-07days on market $69,500 Active 30 DOM
-
2026-06-02days on market $69,500 Active 25 DOM
-
2026-06-01days on market $69,500 Active 24 DOM
-
2026-05-31days on market $69,500 Active 23 DOM
-
2026-05-30days on market $69,500 Active 22 DOM
-
2026-05-18status Active 736-char remark
-
2026-05-15status Pending 736-char remark
-
2026-05-12historical 736-char remark
-
2026-05-02$69,500 Active 736-char remark
-
2024-05-10historical
-
2024-03-04price $95,900
-
2024-02-07$99,999 Active
-
2024-01-20historical
-
2023-05-10soldstatus $55,900 Closed
-
2023-05-03historical Active Under Contract
-
2023-04-18status Active
-
2023-04-06status Pending
-
2023-03-24$59,900 Active
-
2023-03-21historical $59,900
-
2021-04-29soldstatus $45,000 Closed
-
2021-04-21historical Active Under Contract
-
2021-04-07status Active
-
2021-03-27historical Active Under Contract
-
2021-02-12status Active
-
2021-01-26historical Active Under Contract
-
2021-01-08status Active
-
2020-12-15status Pending
-
2020-11-19$45,000 Active
ⓘ Source: listings_history table (triggers on properties + properties_extension) + one-shot
backfill from property_details.listing_events for pre-trigger history.
Climate risk First Street
- Flood 7/10 Severe FEMA zone AE · 95% chance over 30 yrs
- Wildfire 2/10 Low
- Heat 8/10 Severe 7 d/yr ≥100°F today · 18 d/yr by 30 yrs out
- Wind 8/10 Severe 80% chance of damaging wind over 30 yrs
- Air quality 2/10 Low 1 unhealthy d/yr today · 1 by 30 yrs out
Nearby sold comps map
Loading sold comps map…
Walkable amenities ~0.75 mi
Loading nearby amenities…
Taxation est. · year 1
- Rental income
- $21,916
- − Mortgage interest
- −$3,893
- − Property taxes
- −$1,042
- − Insurance
- −$5,872
- − Repairs & maintenance
- −$1,753
- − Management
- −$1,753
- − HOA
- −$24
- − Depreciation
- −$2,022
- Taxable income
- $5,555
- Est. tax owed @ 24.0%
- −$1,333
- After-tax cash flow
- $4,667/yr
For passive investors: Depreciation is non-cash, so a rental often shows a tax loss while cash-flowing — sheltering income. Rental losses are passive: they offset passive income freely, and up to $25,000/yr can offset ordinary (W-2) income if you actively participate and your MAGI is under $100k (phasing out to $0 by $150k); unused losses carry forward. On sale, claimed depreciation is recaptured at up to 25%, and gains may owe capital-gains tax (a 1031 exchange can defer both). Figures are a year-1 estimate at your 24.0% rate — not tax advice; consult a CPA.
Condition & rehab AI · 1 photo
This manufactured home requires moderate repairs and maintenance to improve its condition and increase its value for resale or rental.
Repairs flagged
- Major exterior siding — Significant wear and tear
- Major exterior paint — Peeling paint
- Major porch flooring — Worn-out and uneven
- Major interior walls — Visible wear and tear
Value-add opportunities
- Both paint exterior — Enhances curb appeal and resale value
- Both repair porch flooring — Improves functionality and aesthetics
- Both repair interior walls — Enhances interior condition and resale value
Renovation cost estimate screening
| Repair item | Severity | Est. cost |
|---|---|---|
| exterior siding · Significant wear and tear | Major | $15,000–50,000 |
| exterior paint · Peeling paint | Major | $15,000–50,000 |
| porch flooring · Worn-out and uneven | Major | $15,000–50,000 |
| interior walls · Visible wear and tear | Major | $15,000–50,000 |
| Total estimated repair cost · 4 items | $60,000–200,000 |
Value-add ROI direction
- Both paint exterior — Enhances curb appeal and resale value ↑
- Both repair porch flooring — Improves functionality and aesthetics ↑
- Both repair interior walls — Enhances interior condition and resale value ↑
ⓘ Cost ranges are severity-bucket heuristics (US national rule-of-thumb). Get contractor quotes + a written scope before underwriting a rehab budget.
Schools (NCES district)
- District
- Indian River School District
- NCES district ID
- 1000680
- Math proficiency
- 25% ▼ -27.00%
- Reading proficiency
- 41% ▼ -17.00%
- Median HH income
- $53,838
- Composite
- 28.99/100
- National rank
- #6620
- State rank
- #14 of 26 in DE
Livability — Long Neck
- Score
- 69/100
- State rank
- #30
- US rank
- #8720
Category grades
Schools grade is shown separately in the Schools card above.
Census & demographics
- Census place
- Long Neck, DE
- County
- Sussex County · 82,708 people
- Metro
- Salisbury, MD-DE
- Population (ZIP)
- 35,884
- Household income
- $78,305
- Rent vs Own
- Severe rent burden
- 464.0
Population outlook (Sussex County) Hauer SSP2
- Today (2025)
- 248,853 people
- By 2030
- 264,464 · +6.3%
- By 2040
- 290,980 · +16.9%
- By 2050
- 311,259 · +25.1%
- By 2075
- 352,488 · +41.6%
- By 2100
- 367,406 · +47.6%
Race, ethnicity, and origin ACS 2023
- Neighborhood character
- Predominantly White (74%)
- Race & ethnicity
- White 74% Hispanic / Latino 11% Black 8% Two or more races 7% Native American 3% Asian 1%
- Hispanic origin (detail)
- Mexican 3%
- Common ancestry
- Romanian 4% Slovak 2% Serbian 1%
- Foreign-born
- 8% · Canada, China
- Languages at home
- 88% English-only · Spanish 9% Other Indo-European 1%
Political lean MEDSL · Sussex
- 2024 margin
- R (+11.0) · D 43.9% · R 54.9% · Other 1.2%
- 2008→2024 swing
- -2.4pp toward R · 2008: -8.6pp · 2024: -11.0pp
- All cycles
- 2024: R+11.0 2020: R+11.2 2016: R+22.0 2012: R+13.0 2008: R+8.6
Not yet ingested
- Civics
- —
Market trends
- HPI YoY
- ▼ -18.26%
- Current HPI
- 268.5609
- Rent YoY
- —
- Metro
- Salisbury, MD-DE
- State GDP YoY
- —
- F500 in state
- 0
Price history
+54.4% since first listed23 events — show timeline
- 2026-05-18 Relisted — BRIGHT MLS
- 2026-05-15 Pending — BRIGHT MLS
- 2026-05-12 Listing Removed — BRIGHT MLS
- 2026-05-02 Listed $69,500 BRIGHT MLS
- 2024-05-10 Listing Removed — BRIGHT MLS
- 2024-03-04 Price Changed $95,900 BRIGHT MLS
- 2024-02-07 Listed $99,999 BRIGHT MLS
- 2024-01-20 Coming Soon — BRIGHT MLS
- 2023-05-10 Sold (MLS) $55,900 BRIGHT MLS
- 2023-05-03 Contingent — BRIGHT MLS
- 2023-04-18 Relisted — BRIGHT MLS
- 2023-04-06 Pending — BRIGHT MLS
- 2023-03-24 Listed $59,900 BRIGHT MLS
- 2023-03-21 Coming Soon $59,900 BRIGHT MLS
- 2021-04-29 Sold (MLS) $45,000 BRIGHT MLS
- 2021-04-21 Contingent — BRIGHT MLS
- 2021-04-07 Relisted — BRIGHT MLS
- 2021-03-27 Contingent — BRIGHT MLS
- 2021-02-12 Relisted — BRIGHT MLS
- 2021-01-26 Contingent — BRIGHT MLS
- 2021-01-08 Relisted — BRIGHT MLS
- 2020-12-15 Pending — BRIGHT MLS
- 2020-11-19 Listed $45,000 BRIGHT MLS
Cash-flow waterfall
monthlySold comps — $/sqft
last 12 mo · ≤1 miLoading sold comps…