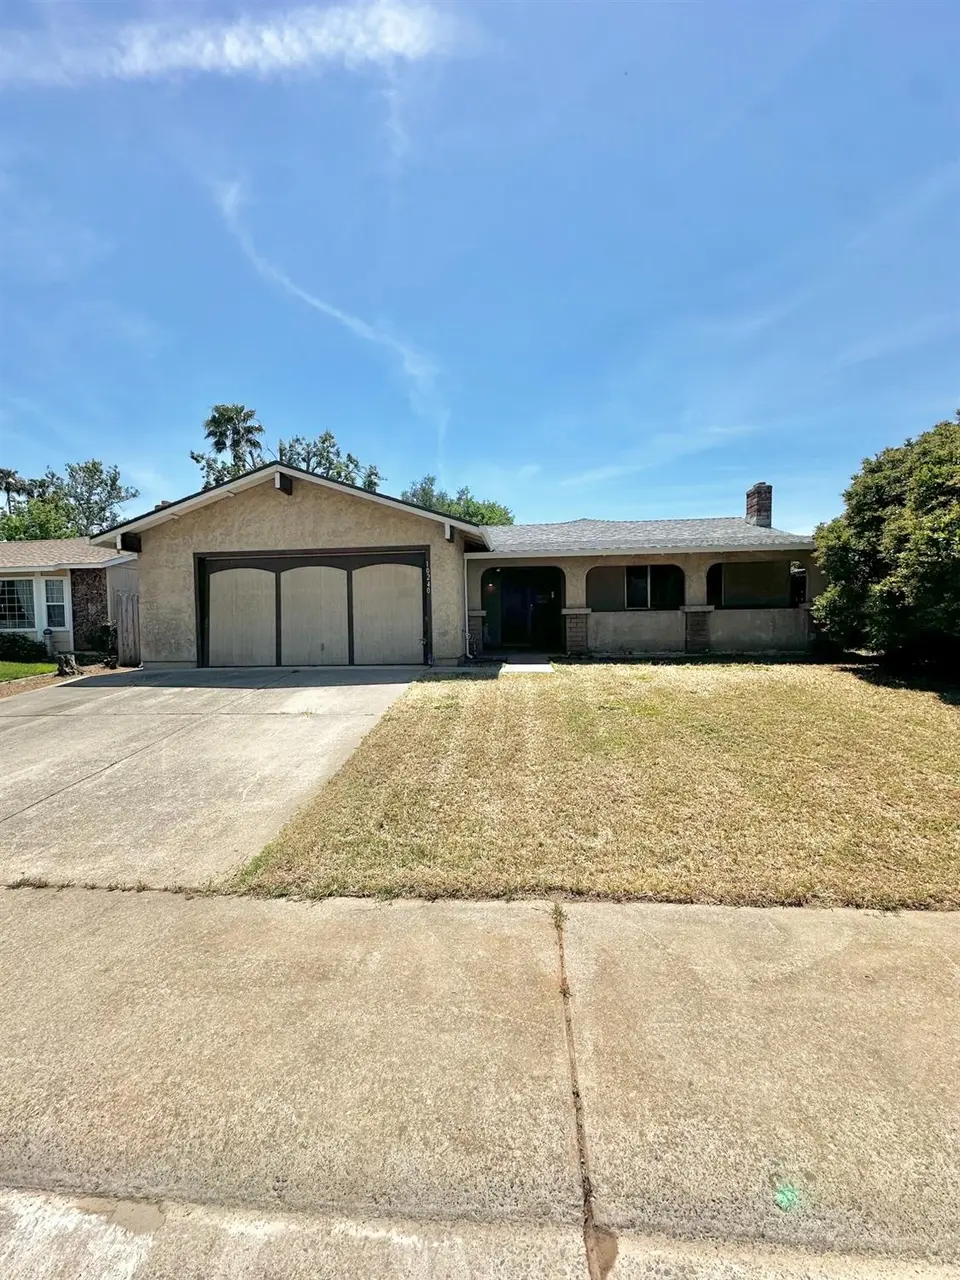
10240 Goinyour Way · Rancho Cordova, CA
Flood risk 1/10 · Minimal
- FEMA flood zone
- X (unshaded)
- Chance of flooding over 30 yrs
- 0.0%
- Est. flood insurance / yr
- $507 – $1,088
Fire risk 5/10 · Moderate
- Est. fire insurance / yr
- $659 – $1,223
Heat risk 7/10 · Major
- Hot days now (above 102°F)
- 7 days/yr
- Hot days in 30 yrs
- 15 days/yr
Wind risk 1/10 · Minimal
- Chance of severe wind over 30 yrs
- —
Air-quality risk 10/10 · Severe
- Unhealthy air days now
- 33 days/yr
- Unhealthy air days in 30 yrs
- 35 days/yr
Risk factors via First Street. Map © Google.
Why this score? — see what drove the D grade
The composite is a weighted blend of 9 inputs, each scored 0–100. Each bar is that input's sub-score; the figure is the points it added to the 100-point composite (weight × sub-score).
- ARV discount +15.0/15.0
- Cash flow +8.1/30.0
- Schools +3.5/10.0
- Livability +3.4/5.0
- Rent growth +3.1/5.0
- 1% rule +2.5/10.0
- Condition / age +2.5/5.0
- DSCR +2.1/10.0
- Appreciation +0.0/10.0
$335,000
🖨 Deal sheet 📄 Offer letter ✓ Due diligence
Listing remarks
Bring your hard hat and vision this major fixer is packed with potential! Located in an established Sacramento neighborhood, this 4-bedroom, 2-bath home offers a fantastic opportunity for investors, flippers, or buyers ready to create their dream home from the ground up. The property features a newer roof and water heater (approximately 3-4 years old), helping offset some major improvement costs. The HVAC system is currently not functioning, and the home will require significant repairs and updating throughout. Situated near schools, parks, shopping, dining, and commuter routes, the location offers convenient access to everyday amenities. Nearby destinations include grocery stores, neighbo
Key facts
- Newer roof
- Convenient access
- Nearby parks
Tags
Property features AI
Finance
- HOA & community: No homeowners association; Not a senior community
Exterior
- Parking: 2-car garage; Garage facing front; Sidewalk/curb/gutter along driveway
- Utilities: Public sewer; Public water / water district; Electric: see remarks/other; Irrigation from public district
- Home design: Single-family detached residence; Residential property; Fixer condition; Built in 1980; One story
- Construction: Composition roof; Detached construction
- Exterior features: Back yard fencing; No private pool or spa; Lot features: other
Interior
- Kitchen: Kitchen open to family room; Appliances: see remarks
- Bedrooms: 4 bedrooms (all on the main level)
- Flooring: See remarks / other
- Bathrooms: 2 full bathrooms; Tub with shower over; Other / see remarks
- Heating & cooling: Heating: none listed (see remarks/other); Cooling: none listed (see remarks/other)
- Interior features: One-story layout; Fireplace(s) in living room and family room; Kitchen open to family room (kitchen/family combo); Main level includes bedrooms, living room, dining room, family room, master bedroom, full baths, garage, and kitchen; Pets allowed
- Laundry & utility: Laundry located in the garage
Neighborhood map
What this means for you Summary
Snapshot
- This is a 4-bed/2.0-bath single-family listed at $335k.
Deal economics
- At list price, monthly cash flow is $-330 ($-4k/yr) — negative.
- To cash-flow at today's rent, offer at most $277k (17.4% below list).
- To meet the 1% rule (rent ≥ 1% of price), the offer needs to be $252k (24.7% below list).
- Recommended offer: $252k (24.7% below list) — sets the bar for 1% rule.
- Cap rate 5.1% vs local median 3.0% in Rancho Cordova — top-decile yield for the area; either an underpriced asset or a hidden risk that comps aren't pricing in. Stress-test before assuming the spread holds.
Location & tenants
- Location reads 68/100 on livability (#268 in CA) — a middle-class / working-renter tenant base. Strengths: housing A+, employment B; Watch: schools C-, commute C-, crime D.
- Sacramento City Unified (urban): math 32% / reading 43% proficiency, ranked #804 of 1,400 in CA (top 57%) — families likely to look elsewhere, expect single-tenant / working-renter base with shorter leases; 63% free/reduced lunch — lower-income household profile, screen leases tightly.
- Market conditions: Rents rising (+2.4%/yr); 109 active listings in the ZIP; 7 comparable units currently listed for rent nearby; rentals at typical pace (median 16d on market — plan ~3-4 weeks tenant-placement turnaround); solid renter incomes; 6,825 units permitted in Sacramento County in 2024 (1,752 in 5+ unit buildings).
- This rent runs 35% of the median local income ($86k/yr) — at the standard rent-burdened threshold; future hikes will face affordability resistance.
Forward outlook
- Local home prices are declining (-3.0%/yr); year-one equity from $2k of loan paydown is wiped out by about $10k of value loss. Plan a longer hold.
- Sacramento County population projected at +17% by 2050 — long-run rental-demand tailwind backs the buy-and-hold thesis.
Negotiation context
- Only 7 days on market — expect competitive offers; lowballing is unlikely to land.
Risks & watch-outs
- Climate carrying-cost: moderate wildfire risk; extreme-heat days projected 7→15/yr by 2055 (HVAC capex compounding) — expect insurance premiums to compound above CPI over the hold.
Questions for the listing agent
- What do current leases actually rent for vs. the listed asking? Can we see a recent rent roll and the last 12 months of T-12 income?
- Is there a deadline driving the sale (1031 exchange, divorce, estate, relocation)? That informs how much negotiation room exists.
- Crime grade is D in this area — have there been break-ins, vandalism, or insurance claims at this property in the last 3 years? What carrier currently insures it and at what premium?
- The area grade is low — what's the realistic commute time and amenity access for the typical tenant pool here? Any planned neighborhood developments (good or bad) we should know about?
- What's the average days-on-market for RENTAL listings here right now (not sales)? A rising rental-DOM trend means longer vacancies and softer asking-rent achievability than the comps imply.
- What's the recent tenant-quality profile in this submarket — average credit score on applications, eviction rate, late-payment / NSF rate, and stable-employment percentage? A property-management company in the area should have these aggregated.
- How much new for-sale + rental construction is in the pipeline within 1–3 miles? Heavy new supply typically softens prices + rents 12–24 months out; constrained supply supports both.
Investment metrics
- 1% rule
- 0.75% ✗
- Cap rate
- 5.11%
- Cash-on-cash
- -4.22%
- DSCR
- 0.81
- GRM
- 11.1
CMA / ARV
- ARV (median comp)
- $479,387
- List price
- $335,000
- Delta
- -30.12%
- Verdict
- UNDERPRICED
- Comps
- 20 within 1.0 mi
Show comp detail 12 sales within ~0.75 mi
| Address | Dist | Beds/Ba | Sqft | Sold | Price | $/sf | Match |
|---|---|---|---|---|---|---|---|
| 3376 Hartselle Way | 0.05mi | 4/2.0 | 1,587 (0%) | 4mo | $475,500 | $300 | 95 |
| 10237 Countryside Way | 0.27mi | 4/2.0 | 1,590 (+0%) | 3mo | $475,000 | $299 | 85 |
| 10185 Countryside Way | 0.32mi | 4/2.0 | 1,590 (+0%) | 3mo | $480,000 | $302 | 82 |
| 3447 Wildwind Ct | 0.24mi | 3/2.5 (-1) | 1,565 (-1%) | 7mo | $500,000 | $319 | 74 |
| 3544 Misty Morning Cir | 0.27mi | 4/2.5 | 1,712 (+8%) | 1mo | $520,000 | $304 | 71 |
| 3504 Misty Morning Cir | 0.32mi | 4/2.5 | 1,712 (+8%) | 5mo | $490,000 | $286 | 65 |
| 3312 Romford Way | 0.49mi | 3/2.0 (-1) | 1,514 (-5%) | 2mo | $450,000 | $297 | 62 |
| 3328 Cahill Ct | 0.63mi | 3/2.0 (-1) | 1,624 (+2%) | 2mo | $450,000 | $277 | 60 |
| 10233 Countryside Way | 0.27mi | 3/2.0 (-1) | 1,394 (-12%) | 4mo | $475,000 | $341 | 59 |
| 10414 Reymouth Ave | 0.61mi | 5/2.0 (+1) | 1,659 (+4%) | 3mo | $465,000 | $280 | 56 |
| 3231 Nosler Ct | 0.72mi | 4/3.0 | 1,661 (+5%) | 6mo | $530,000 | $319 | 50 |
| 10000 Bromley Way | 0.64mi | 3/2.0 (-1) | 1,440 (-9%) | 1mo | $440,000 | $306 | 49 |
Match score weights: distance 35% · size 25% · config 20% · recency 20%. Top-matched comps best support the ARV.
Projected returns pro-forma
-3.0% appreciation · 2.41% rent growth · sell at horizon
- IRR
- -24.1%
- Equity multiple
- 0.18×
- Total profit
- $-76,737
- Equity at exit
- $49,950
- IRR
- -20.9%
- Equity multiple
- -0.06×
- Total profit
- $-99,733
- Equity at exit
- $28,965
Cash invested: $93,800 (down + closing). Projections, not guarantees.
Landlord ↔ Tenant lean methodology
- Overall (STATE)
- 18 Strongly Tenant-Friendly
- State California
- 18 Strongly Tenant-Friendly · D+13
- County
- — inherits STATE
- City
- — inherits STATE
ZIP-level market 95827
- Rents YoY
- 2.4%
- Active inventory
- 109
- Price-to-rent
- 11.1×
Monthly cashflow live
- Estimated rent
- $2,524 high interval (Pro) →
- Mortgage (P&I)
- −$1,757
- Tax from tax record
- −$427 /mo · $5,128/yr
- Insurance
- −$140
- HOA
- −$0
- Vacancy / Maint / Mgmt
- −$530
- Net cashflow
- $-330
Break-even live
UW: 25.0% down · 7.5% · 30yr · 1.5% tax · 5.0% vac · 8.0% maint · 8.0% mgmt
Financing live
Cash to close
- Down payment
- $83,750
- Closing costs
- $10,050
- Reserves months
- —
- Total cash needed
- —
Loan-product check · same deal, 3 products live
Conventional
25% down · 7.5% · 30yr
- Down + closing
- —
- Monthly P&I
- —
- Monthly cashflow
- —
- DSCR
- —
- Eligible?
- —
Personal DTI + credit; lowest rate.
DSCR
20% down · 8.5% · 30yr
- Down + closing
- —
- Monthly P&I
- —
- Monthly cashflow
- —
- DSCR
- —
- Eligible?
- —
No personal income docs; deal must DSCR.
Hard money
10% down · 12.0% · 12mo
- Down + closing
- —
- Monthly P&I
- —
- Monthly cashflow
- —
- DSCR
- —
- Eligible?
- —
Short-term bridge; refi at stabilization.
Rent comps 7 comps
| Address | Beds | Baths | Sqft | Rent | $/sqft | DOM | Units | Dist |
|---|---|---|---|---|---|---|---|---|
| 10136 Ellenwood Ave Sacramento, CA | 3.0 | 2.5 | 1418 | $2,375 | $1.67 | 43d | 1 | 0.38mi |
| 9952 Vanguard Dr Sacramento, CA | 3.0 | 2.0 | 1168 | $2,450 | $2.10 | 12d | 1 | 0.75mi |
| 10281 Mills Station Rd Unit 12 Rancho Cordova, CA | 3.0 | 2.0 | 1100 | $2,200 | $2.00 | 4d | 1 | 0.87mi |
| 3337 Union Springs Way Sacramento, CA | 3.0 | 2.0 | 1543 | $2,595 | $1.68 | 43d | 1 | 1.24mi |
| 3100 Explorer Dr Sacramento, CA | 3.0 | 2.0 | 1380 | $2,575 | $1.87 | 16d | 1 | 1.28mi |
| 3600 Kobias Ct Sacramento, CA | 3.0 | 2.0 | 1257 | $2,650 | $2.11 | 23d | 1 | 1.33mi |
| 10949 Bellone Way Rancho Cordova, CA | 4.0 | 3.0 | 1851 | $2,820 | $1.52 | 3d | 1 | 1.38mi |
Tax reassessment forecast CA · Resets to sale price
- Current annual tax
- $5,128 · $427/mo
- Projected year-2 tax
- $5,128 · $427/mo
- Expected delta
- $0/yr ($0/mo · 0.0%)
ⓘ Screening estimate from a state-policy table — verify with the county assessor before closing.
Climate risk First Street
- Flood 1/10 Low FEMA zone X (unshaded) · 0% chance over 30 yrs
- Wildfire 5/10 Major
- Heat 7/10 Severe 7 d/yr ≥102°F today · 15 d/yr by 30 yrs out
- Wind 1/10 Low
- Air quality 10/10 Extreme 33 unhealthy d/yr today · 35 by 30 yrs out
Nearby sold comps map
Loading sold comps map…
Walkable amenities ~0.75 mi
Loading nearby amenities…
Taxation est. · year 1
- Rental income
- $30,287
- − Mortgage interest
- −$18,765
- − Property taxes
- −$5,128
- − Insurance
- −$1,675
- − Repairs & maintenance
- −$2,423
- − Management
- −$2,423
- − Depreciation
- −$9,745
- Taxable loss
- −$9,873
- Est. tax savings @ 24.0%
- +$2,369
- After-tax cash flow
- $-1,588/yr
For passive investors: Depreciation is non-cash, so a rental often shows a tax loss while cash-flowing — sheltering income. Rental losses are passive: they offset passive income freely, and up to $25,000/yr can offset ordinary (W-2) income if you actively participate and your MAGI is under $100k (phasing out to $0 by $150k); unused losses carry forward. On sale, claimed depreciation is recaptured at up to 25%, and gains may owe capital-gains tax (a 1031 exchange can defer both). Figures are a year-1 estimate at your 24.0% rate — not tax advice; consult a CPA.
Schools (NCES district)
- District
- Sacramento City Unified
- NCES district ID
- 0633840
- Math proficiency
- 32% ▬ 0.00%
- Reading proficiency
- 43% ▲ 3.00%
- Median HH income
- $49,280
- Composite
- 34.86/100
- National rank
- #10000
- State rank
- #804 of 1400 in CA
Livability — Rancho Cordova
- Score
- 68/100
- State rank
- #268
- US rank
- #9126
Category grades
Schools grade is shown separately in the Schools card above.
Census & demographics
- Census place
- Rancho Cordova, CA
- County
- Sacramento County · 1,539,646 people
- City population
- 98,329
- Metro
- Sacramento-Roseville-Folsom, CA
- Population (ZIP)
- 21,742
- Household income
- $85,841
- Rent vs Own
- Severe rent burden
- 949.0
Population outlook (Sacramento County) Hauer SSP2
- Today (2025)
- 1,660,763 people
- By 2030
- 1,732,990 · +4.3%
- By 2040
- 1,855,755 · +11.7%
- By 2050
- 1,941,335 · +16.9%
- By 2075
- 2,046,162 · +23.2%
- By 2100
- 1,961,444 · +18.1%
Race, ethnicity, and origin ACS 2023
- Neighborhood character
- Diverse neighborhood (Simpson 0.69)
- Race & ethnicity
- White 47% Hispanic / Latino 24% Black 13% Two or more races 12% Asian 10% Native American 1%
- Hispanic origin (detail)
- Mexican 19%
- Common ancestry
- Subsaharan African 5% Italian 2% Scotch-Irish 2%
- Foreign-born
- 22% · Canada, Vietnam, South Korea
- Languages at home
- 67% English-only · Spanish 14% Russian/Polish/Slavic 10% Other Indo-European 3%
Political lean MEDSL · Sacramento
- 2024 margin
- D (+19.7) · D 58.1% · R 38.4% · Other 3.5%
- 2008→2024 swing
- +0.7pp no change · 2008: 19.0pp · 2024: 19.7pp
- All cycles
- 2024: D+19.7 2020: D+25.3 2016: D+23.7 2012: D+16.3 2008: D+19.0
Not yet ingested
- Civics
- —
Market trends
- HPI YoY
- ▼ -223.22%
- Current HPI
- 349.4168
- Rent YoY
- ▲ 2.41%
- Metro
- Sacramento-Roseville-Folsom, CA
- State GDP YoY
- ▲ 3.21%
- F500 in state
- 116
Industry mix (Fortune 500 HQ in CA)
| Industry | F500 HQs | Revenue |
|---|---|---|
| Technology | 27 | $1,492B |
|
||
| Financial Services | 3 | $174B |
|
||
| Retail | 3 | $44B |
|
||
| Insurance | 3 | $26B |
|
||
| Media / Entertainment | 2 | $115B |
|
||
| Pharmaceuticals / Biotech | 2 | $62B |
|
||
Property tax history
+9.0%/yrLatest (2025): $5,128 · +203.6% YoY. Source: county tax records.
Cash-flow waterfall
monthlySold comps — $/sqft
last 12 mo · ≤1 miLoading sold comps…