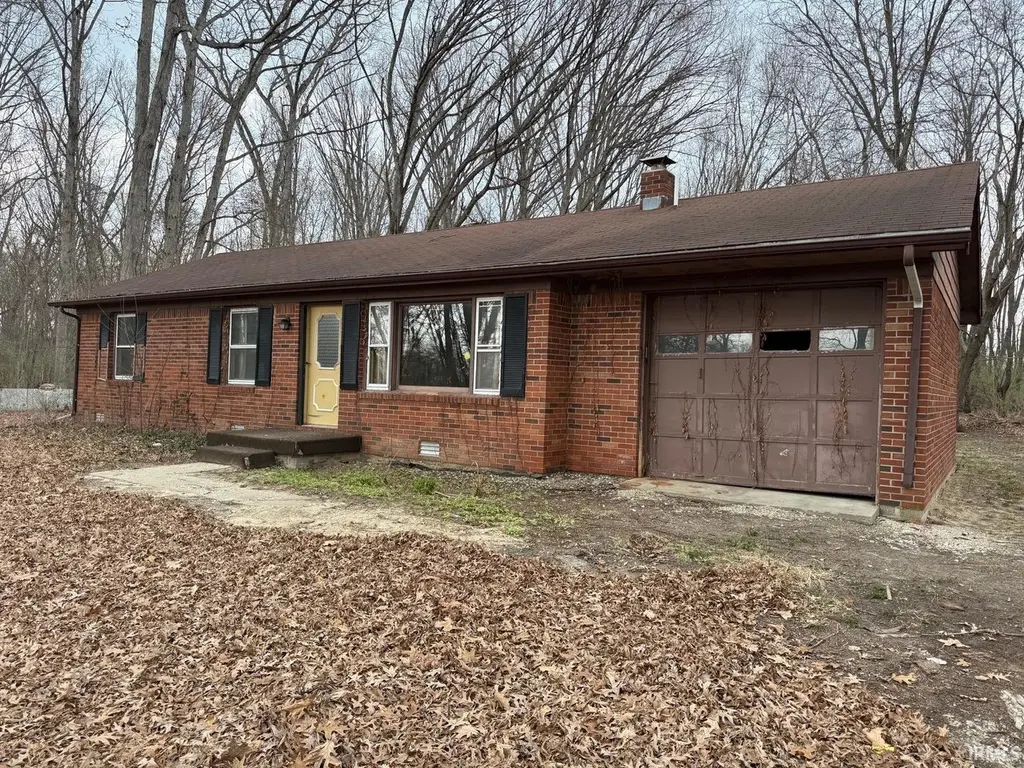
2756 N 1100 W · Chili, IN
Flood risk 1/10 · Minimal
- FEMA flood zone
- X (unshaded)
- Chance of flooding over 30 yrs
- 0.0%
- Est. flood insurance / yr
- $507 – $1,088
Fire risk 1/10 · Minimal
- Est. fire insurance / yr
- $717 – $1,331
Heat risk 2/10 · Minimal
- Hot days now (above 101°F)
- 7 days/yr
- Hot days in 30 yrs
- 16 days/yr
Wind risk 2/10 · Minimal
- Chance of severe wind over 30 yrs
- 0.0%
Air-quality risk 3/10 · Minor
- Unhealthy air days now
- 1 days/yr
- Unhealthy air days in 30 yrs
- 3 days/yr
Risk factors via First Street. Map © Google.
Why this score? — see what drove the C+ grade
The composite is a weighted blend of 9 inputs, each scored 0–100. Each bar is that input's sub-score; the figure is the points it added to the 100-point composite (weight × sub-score).
- Cash flow +25.9/30.0
- DSCR +8.7/10.0
- ARV discount +7.5/15.0
- 1% rule +6.8/10.0
- Appreciation +6.8/10.0
- Schools +2.9/10.0
- Rent growth +2.5/5.0
- Livability +2.5/5.0
- Condition / age +1.0/5.0
$80,000
🖨 Deal sheet 📄 Offer letter ✓ Due diligence
Listing remarks
Fixer upper in the country on a 4 acre lot with 2 bedrooms 1 1/2 bath. Inspections welcome seller is selling in as is condition
Key facts
- 4 acre lot
- Garage
- Built 1971
Neighborhood map
What this means for you Summary
Snapshot
- This is a 2-bed/1.5-bath single-family listed at $80k. Condition is rated poor.
Deal economics
- At list price, monthly cash flow is $196 ($2k/yr) — positive.
- The deal already cash-flows at list — no discount required.
- Meets the 1% rule at list price ($947 rent vs $80k).
Location & tenants
- Location reads: area grade C — affects rentability + tenant quality, not the cash-flow math above.
- North Miami Community Schools (rural): math 26% / reading 42% proficiency, ranked #197 of 301 in IN (top 65%) — families likely to look elsewhere, expect single-tenant / working-renter base with shorter leases.
- Market conditions: 7 active listings in the ZIP; 35 units permitted in Miami County in 2024 (0 in 5+ unit buildings).
Forward outlook
- In year one you build about $3k of equity ($553 loan paydown + $3k appreciation (3.6% local appreciation)).
- Miami County population projected at -12% by 2050 — secular population decline; favor cash flow + early exit over multi-decade hold.
- At projected returns (3.6% appreciation + 3.0% rent growth), your $22k cash investment doubles in ~4 years — after that, you're playing with house money.
- By year 10, paydown + projected appreciation supports a ~$33k cash-out refi (75% LTV) — recoverable capital for the next deal without selling this one.
Negotiation context
- Only 5 days on market — expect competitive offers; lowballing is unlikely to land.
Questions for the listing agent
- Have any recent inspections been done? Can we get a copy of the seller's disclosures and any deferred-maintenance estimates?
- Built in 1971 — when were the roof, HVAC, electrical panel, plumbing, and water heater last replaced?
- Is there a deadline driving the sale (1031 exchange, divorce, estate, relocation)? That informs how much negotiation room exists.
- What's the average days-on-market for RENTAL listings here right now (not sales)? A rising rental-DOM trend means longer vacancies and softer asking-rent achievability than the comps imply.
- What's the recent tenant-quality profile in this submarket — average credit score on applications, eviction rate, late-payment / NSF rate, and stable-employment percentage? A property-management company in the area should have these aggregated.
- How much new for-sale + rental construction is in the pipeline within 1–3 miles? Heavy new supply typically softens prices + rents 12–24 months out; constrained supply supports both.
Investment metrics
- 1% rule
- 1.18% ✓
- Cap rate
- 9.23%
- Cash-on-cash
- 10.48%
- DSCR
- 1.47
- GRM
- 7.0
CMA / ARV
No comps found within radius.
Projected returns pro-forma
3.58% appreciation · 3.0% rent growth · sell at horizon
- IRR
- 18.7%
- Equity multiple
- 2.10×
- Total profit
- $24,571
- Equity at exit
- $38,592
- IRR
- 19.6%
- Equity multiple
- 3.99×
- Total profit
- $67,069
- Equity at exit
- $61,597
Cash invested: $22,400 (down + closing). Projections, not guarantees.
Landlord ↔ Tenant lean methodology
- Overall (STATE)
- 90 Strongly Landlord-Friendly
- State Indiana
- 90 Strongly Landlord-Friendly · R+11
- County
- — inherits STATE
- City
- — inherits STATE
ZIP-level market 46978
- Home prices YoY
- 1.5%
- Active inventory
- 7
- Price-to-rent
- 7.0×
Monthly cashflow live
- Estimated rent
- $947 medium interval (Pro) →
- Mortgage (P&I)
- −$420
- Tax est. 1.5%
- −$100 /mo · $1,200/yr
- Insurance
- −$33
- HOA
- −$0
- Vacancy / Maint / Mgmt
- −$199
- Net cashflow
- $196
Break-even live
UW: 25.0% down · 7.5% · 30yr · 1.5% tax · 5.0% vac · 8.0% maint · 8.0% mgmt
Financing live
Cash to close
- Down payment
- $20,000
- Closing costs
- $2,400
- Reserves months
- —
- Total cash needed
- —
Loan-product check · same deal, 3 products live
Conventional
25% down · 7.5% · 30yr
- Down + closing
- —
- Monthly P&I
- —
- Monthly cashflow
- —
- DSCR
- —
- Eligible?
- —
Personal DTI + credit; lowest rate.
DSCR
20% down · 8.5% · 30yr
- Down + closing
- —
- Monthly P&I
- —
- Monthly cashflow
- —
- DSCR
- —
- Eligible?
- —
No personal income docs; deal must DSCR.
Hard money
10% down · 12.0% · 12mo
- Down + closing
- —
- Monthly P&I
- —
- Monthly cashflow
- —
- DSCR
- —
- Eligible?
- —
Short-term bridge; refi at stabilization.
Listing history 2 events
-
2026-04-13status Pending
-
2026-04-08$80,000 Active
ⓘ Source: listings_history table (triggers on properties + properties_extension) + one-shot
backfill from property_details.listing_events for pre-trigger history.
Climate risk First Street
- Flood 1/10 Low FEMA zone X (unshaded) · 0% chance over 30 yrs
- Wildfire 1/10 Low
- Heat 2/10 Low 7 d/yr ≥101°F today · 16 d/yr by 30 yrs out
- Wind 2/10 Low 0% chance of damaging wind over 30 yrs
- Air quality 3/10 Moderate 1 unhealthy d/yr today · 3 by 30 yrs out
Nearby sold comps map
Loading sold comps map…
Walkable amenities ~0.75 mi
Loading nearby amenities…
Taxation est. · year 1
- Rental income
- $11,369
- − Mortgage interest
- −$4,481
- − Property taxes
- −$1,200
- − Insurance
- −$400
- − Repairs & maintenance
- −$910
- − Management
- −$910
- − Depreciation
- −$2,327
- Taxable income
- $1,141
- Est. tax owed @ 24.0%
- −$274
- After-tax cash flow
- $2,073/yr
For passive investors: Depreciation is non-cash, so a rental often shows a tax loss while cash-flowing — sheltering income. Rental losses are passive: they offset passive income freely, and up to $25,000/yr can offset ordinary (W-2) income if you actively participate and your MAGI is under $100k (phasing out to $0 by $150k); unused losses carry forward. On sale, claimed depreciation is recaptured at up to 25%, and gains may owe capital-gains tax (a 1031 exchange can defer both). Figures are a year-1 estimate at your 24.0% rate — not tax advice; consult a CPA.
Condition & rehab AI · 13 photos
This fixer-upper requires extensive renovations, including new cabinets, flooring, and HVAC system. The property has a poor condition score and is in need of significant improvements to increase its resale and rental value.
Repairs flagged
- Major Exposed wiring — Safety hazard
- Major Missing cabinet doors — Aesthetics and functionality
- Major Old HVAC system — Energy inefficiency and potential safety issues
Value-add opportunities
- Both New kitchen cabinets — Improves aesthetics and functionality
- Both New flooring — Enhances overall appearance and comfort
- Both New HVAC system — Improves energy efficiency and comfort
Renovation cost estimate screening
| Repair item | Severity | Est. cost |
|---|---|---|
| Exposed wiring · Safety hazard | Major | $15,000–50,000 |
| Missing cabinet doors · Aesthetics and functionality | Major | $15,000–50,000 |
| Old HVAC system · Energy inefficiency and potential safety issues | Major | $15,000–50,000 |
| Total estimated repair cost · 3 items | $45,000–150,000 |
Value-add ROI direction
- Both New kitchen cabinets — Improves aesthetics and functionality ↑
- Both New flooring — Enhances overall appearance and comfort ↑
- Both New HVAC system — Improves energy efficiency and comfort ↑
ⓘ Cost ranges are severity-bucket heuristics (US national rule-of-thumb). Get contractor quotes + a written scope before underwriting a rehab budget.
Schools (NCES district)
- District
- North Miami Community Schools
- NCES district ID
- 1807890
- Math proficiency
- 26% ▼ -10.00%
- Reading proficiency
- 42% ▼ -3.00%
- Median HH income
- $49,863
- Composite
- 29.45/100
- National rank
- #6513
- State rank
- #197 of 301 in IN
Livability — Chili
No livability data for this city. (Only ~50 U.S. cities are tracked.)
Census & demographics
- Population (ZIP)
- 2,111
Population outlook (Miami County) Hauer SSP2
- Today (2025)
- 34,421 people
- By 2030
- 33,571 · -2.5%
- By 2040
- 31,919 · -7.3%
- By 2050
- 30,313 · -11.9%
- By 2075
- 26,202 · -23.9%
- By 2100
- 20,856 · -39.4%
Race, ethnicity, and origin ACS 2023
- Neighborhood character
- Predominantly White (96%)
- Race & ethnicity
- White 96% Hispanic / Latino 3%
- Common ancestry
- Romanian 1%
- Foreign-born
- 1% · Canada
Political lean MEDSL · Miami
- 2024 margin
- Solid R (+54.5) · D 21.8% · R 76.3% · Other 1.9%
- 2008→2024 swing
- -35.1pp toward R · 2008: -19.5pp · 2024: -54.5pp
- All cycles
- 2024: R+54.5 2020: R+53.1 2016: R+53.6 2012: R+30.9 2008: R+19.5
Not yet ingested
- Civics
- —
Market trends
- HPI YoY
- ▲ 3.58%
- Current HPI
- 243.772
- Rent YoY
- —
- Metro
- —
- State GDP YoY
- ▲ 2.90%
- F500 in state
- 18
Industry mix (Fortune 500 HQ in IN)
| Industry | F500 HQs | Revenue |
|---|---|---|
| Industrial Machinery | 2 | $37B |
|
||
| Healthcare | 1 | $177B |
|
||
| Pharmaceuticals | 1 | $45B |
|
||
| Metals / Steel | 1 | $18B |
|
||
| Agriculture | 1 | $17B |
|
||
| Packaging | 1 | $12B |
|
||
Price history
2 events — show timeline
- 2026-04-13 Pending — IRMLS
- 2026-04-08 Listed $80,000 IRMLS
Cash-flow waterfall
monthlySold comps — $/sqft
last 12 mo · ≤1 miLoading sold comps…