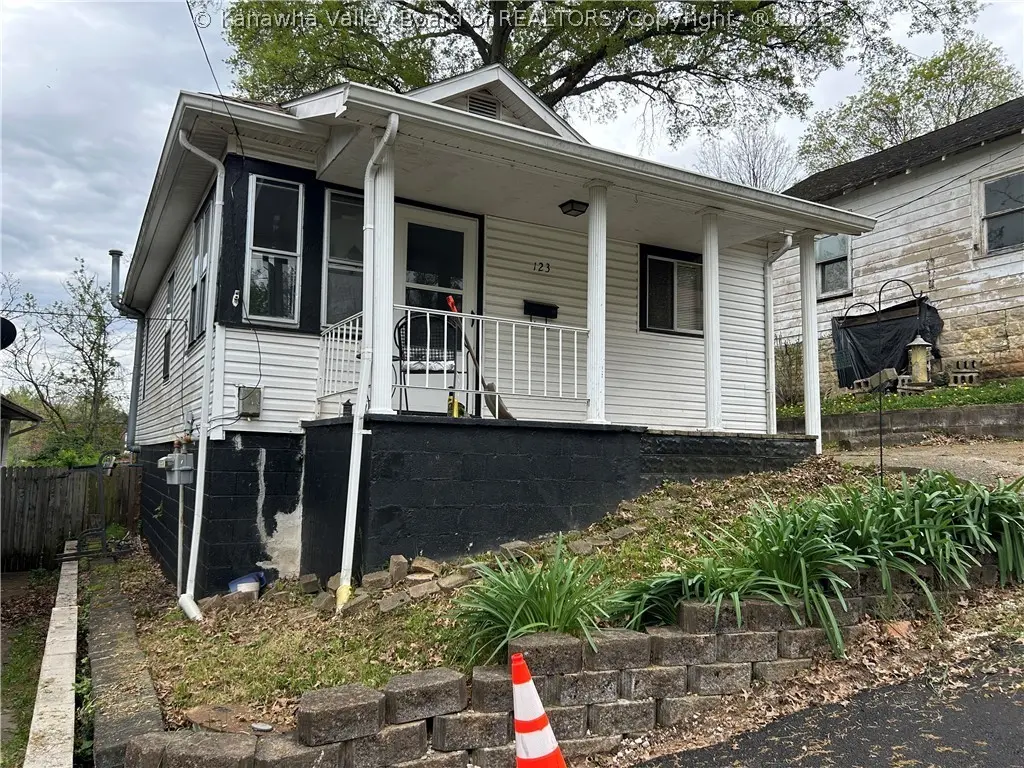
123 Marion St · Huntington, WV
Flood risk 1/10 · Minimal
- FEMA flood zone
- X (unshaded)
- Chance of flooding over 30 yrs
- 0.0%
- Est. flood insurance / yr
- $507 – $1,088
Fire risk 4/10 · Minor
- Est. fire insurance / yr
- $787 – $1,461
Heat risk 5/10 · Moderate
- Hot days now (above 102°F)
- 7 days/yr
- Hot days in 30 yrs
- 18 days/yr
Wind risk 2/10 · Minimal
- Chance of severe wind over 30 yrs
- 1.0%
Air-quality risk 2/10 · Minimal
- Unhealthy air days now
- 0 days/yr
- Unhealthy air days in 30 yrs
- 1 days/yr
Risk factors via First Street. Map © Google.
Why this score? — see what drove the B+ grade
The composite is a weighted blend of 9 inputs, each scored 0–100. Each bar is that input's sub-score; the figure is the points it added to the 100-point composite (weight × sub-score).
- Cash flow +30.0/30.0
- ARV discount +14.2/15.0
- 1% rule +10.0/10.0
- DSCR +10.0/10.0
- Livability +4.0/5.0
- Schools +3.0/10.0
- Rent growth +2.5/5.0
- Condition / age +2.5/5.0
- Appreciation +0.0/10.0
$39,800
🖨 Deal sheet (PDF) 📄 Offer letter ✓ Due diligence
Listing remarks
Well maintained and nicely updated 2bd/1ba home in a small subdivision with off street parking and fenced back yard. HUD approved and tenant occupied for 14 yr. Home can be sold to new owner or investor who will enjoy monthly rental income immediately. Bundle price of $150,000 includes 121, 123, 127 Marion St and 1391 Elizabeth St.
Key facts
- Off street parking
- Fenced back yard
- 4,356 sq ft lot
Tags
Property features AI
Exterior
- Parking: Parking pad
- Security: Smoke detector(s)
- Utilities: Public water; Public sewer; Cable available
- Home design: Single family residence; 1 story
- Construction: Frame, plaster and vinyl siding exterior; Composition/shingle roof
- Exterior features: Porch; Fenced yard
Interior
- Kitchen: Eat-in kitchen
- Bedrooms: 5 total rooms (includes bedrooms and living areas)
- Flooring: Carpet; Vinyl
- Bathrooms: 1 full bathroom
- Heating & cooling: Forced air heating; Central air; Window unit(s)
- Interior features: Eat-in kitchen; Insulated windows
Neighborhood map
What this means for you Summary
Snapshot
- This is a 2-bed/1.0-bath single-family listed at $40k.
Deal economics
- At list price, monthly cash flow is $403 ($5k/yr) — positive.
- The deal already cash-flows at list — no discount required.
- Meets the 1% rule at list price ($868 rent vs $40k).
- Recommended offer: $37k (6.0% below list) — sets the bar for market timing.
- Cap rate 18.5% vs local median 6.5% in Huntington — top-decile yield for the area; either an underpriced asset or a hidden risk that comps aren't pricing in. Stress-test before assuming the spread holds.
Location & tenants
- Location reads 79/100 on livability (#16 in WV, #2,045 nationally) — a middle-class / working-renter tenant base. Strengths: amenities A+, commute A+, cost of living A+; Watch: crime F, employment F.
- Cabell County Schools (urban): math 31% / reading 42% proficiency, ranked #13 of 55 in WV (top 24%) — families likely to look elsewhere, expect single-tenant / working-renter base with shorter leases.
- Zoned schools: Explorer Academy (math 22% / reading 27%, grade F, #287 of 377 statewide, top 85%, 406 students, 0% FRL); Huntington East Middle School (math 18% / reading 32%, grade F, #81 of 109 statewide, top 76%, 585 students, 0% FRL); Huntington High School (math 26% / reading 50%, grade F, #31 of 110 statewide, top 28%, 1,704 students, 0% FRL) — zoned schools average 0% FRL vs 47% district-wide (47 pts lower); this property's tenant base skews higher-income than the district average.
- Market conditions: 163 active listings in the ZIP; 2 comparable units currently listed for rent nearby; 61 units permitted in Cabell County in 2024 (5 in 5+ unit buildings).
Forward outlook
- Local home prices are declining (-3.0%/yr); year-one equity from $275 of loan paydown is wiped out by about $1k of value loss. Plan a longer hold.
- At projected returns (-3.0% appreciation + 3.0% rent growth), your $11k cash investment doubles in ~3 years — after that, you're playing with house money.
Negotiation context
- It's been on market 61 days — a 6% lower offer ($37k) is reasonable based on typical stale-listing flexibility.
Risks & watch-outs
- Watch-outs: built in 1910 — expect roof / HVAC / electrical / plumbing capex.
- Climate carrying-cost: extreme-heat days projected 7→18/yr by 2055 (HVAC capex compounding) — expect insurance premiums to compound above CPI over the hold.
Questions for the listing agent
- It's been on market 61 days. Have you received any prior offers? Is the seller open to a 6% concession, seller financing, or rate buy-down credit?
- Built in 1910 — when were the roof, HVAC, electrical panel, plumbing, and water heater last replaced?
- Why hasn't it sold? Are there any deal-killer items the seller is aware of (foundation, flood, title, zoning, code violations)?
- Is there a deadline driving the sale (1031 exchange, divorce, estate, relocation)? That informs how much negotiation room exists.
- Crime grade is F in this area — have there been break-ins, vandalism, or insurance claims at this property in the last 3 years? What carrier currently insures it and at what premium?
- What's the average days-on-market for RENTAL listings here right now (not sales)? A rising rental-DOM trend means longer vacancies and softer asking-rent achievability than the comps imply.
- What's the recent tenant-quality profile in this submarket — average credit score on applications, eviction rate, late-payment / NSF rate, and stable-employment percentage? A property-management company in the area should have these aggregated.
- How much new for-sale + rental construction is in the pipeline within 1–3 miles? Heavy new supply typically softens prices + rents 12–24 months out; constrained supply supports both.
Investment metrics
- 1% rule
- 2.18% ✓
- Cap rate
- 18.46%
- Cash-on-cash
- 43.44%
- DSCR
- 2.93
- GRM
- 3.8
CMA / ARV
- ARV (on-the-fly)
- $46,728
- Comps found
- 12
Show comp detail 12 sales within ~0.75 mi
| Address | Dist | Beds/Ba | Sqft | Sold | Price | $/sf | Match |
|---|---|---|---|---|---|---|---|
| 415 Rotary Rd | 0.17mi | 2/1.0 | 788 (-0%) | 4mo | $82,000 | $104 | 88 |
| 2960 Rice Ave | 0.26mi | 2/1.0 | 776 (-2%) | 12mo | $47,000 | $61 | 74 |
| 117 Linden Cir | 0.30mi | 2/1.0 | 763 (-4%) | 9mo | $119,000 | $156 | 73 |
| 453 Linden Circle Cir | 0.18mi | 2/1.0 | 864 (+9%) | 5mo | $32,000 | $37 | 72 |
| 118 South Walnut St | 0.47mi | 2/1.0 | 816 (+3%) | 1mo | $127,900 | $157 | 72 |
| 505 Oney Ave | 0.16mi | 3/1.0 (+1) | 839 (+6%) | 10mo | $35,000 | $42 | 70 |
| 113 Davis St | 0.31mi | 3/1.0 (+1) | 720 (-9%) | 2mo | $30,000 | $42 | 64 |
| 103 Rotary Rd | 0.32mi | 3/1.0 (+1) | 864 (+9%) | 10mo | $45,000 | $52 | 57 |
| 118 Olive St | 0.35mi | 2/1.0 | 864 (+9%) | 16mo | $73,000 | $84 | 55 |
| 2808 Hite Ave | 0.57mi | 2/1.0 | 728 (-8%) | 18mo | $36,000 | $49 | 45 |
| 322 Locust St | 0.68mi | 2/1.0 | 864 (+9%) | 10mo | $50,651 | $59 | 45 |
| 33 Rosemont Ct | 0.74mi | 3/1.0 (+1) | 909 (+15%) | 17mo | $43,000 | $47 | 21 |
Match score weights: distance 35% · size 25% · config 20% · recency 20%. Top-matched comps best support the ARV.
Projected returns pro-forma
-3.0% appreciation · 3.0% rent growth · sell at horizon
- IRR
- 40.3%
- Equity multiple
- 2.73×
- Total profit
- $19,262
- Equity at exit
- $5,934
- IRR
- 46.6%
- Equity multiple
- 5.48×
- Total profit
- $49,930
- Equity at exit
- $3,441
Cash invested: $11,144 (down + closing). Projections, not guarantees.
Landlord ↔ Tenant lean methodology
- Overall (STATE)
- 83 Strongly Landlord-Friendly
- State West Virginia
- 83 Strongly Landlord-Friendly · R+22
- County
- — inherits STATE
- City
- — inherits STATE
ZIP-level market 25705
- Home prices YoY
- -24.9%
- Active inventory
- 163
- Price-to-rent
- 3.8×
Monthly cashflow live
- Estimated rent
- $868 medium interval (Pro) →
- Mortgage (P&I)
- −$209
- Tax from tax record
- −$57 /mo · $683/yr
- Insurance
- −$17
- HOA
- −$0
- Vacancy / Maint / Mgmt
- −$182
- Net cashflow
- $403
Break-even live
Sensitivity live
| Price | -10% $426 | -5% $415 | +0% $403 | +5% $392 | +10% $381 |
|---|---|---|---|---|---|
| Rent | -10% $335 | -5% $369 | +0% $403 | +5% $438 | +10% $472 |
| Rate | -1.0pp $423 | -0.5pp $414 | base $403 | +0.5pp $393 | +1.0pp $383 |
UW: 25.0% down · 7.5% · 30yr · 1.5% tax · 5.0% vac · 8.0% maint · 8.0% mgmt
Financing live
Cash to close
- Down payment
- $9,950
- Closing costs
- $1,194
- Reserves months
- —
- Total cash needed
- —
Loan-product check · same deal, 3 products live
Conventional
25% down · 7.5% · 30yr
- Down + closing
- —
- Monthly P&I
- —
- Monthly cashflow
- —
- DSCR
- —
- Eligible?
- —
Personal DTI + credit; lowest rate.
DSCR
20% down · 8.5% · 30yr
- Down + closing
- —
- Monthly P&I
- —
- Monthly cashflow
- —
- DSCR
- —
- Eligible?
- —
No personal income docs; deal must DSCR.
Hard money
10% down · 12.0% · 12mo
- Down + closing
- —
- Monthly P&I
- —
- Monthly cashflow
- —
- DSCR
- —
- Eligible?
- —
Short-term bridge; refi at stabilization.
Rent comps 2 comps
| Address | Beds | Baths | Sqft | Rent | $/sqft | DOM | Units | Dist |
|---|---|---|---|---|---|---|---|---|
| 2489 1st Ave Unit 101 A Huntington, WV | 1.0 | 1.0 | 750 | $925 | $1.23 | 44d | 1 | 1.47mi |
| 2435 1st Ave Unit 1 Huntington, WV | 1.0 | 1.0 | 600 | $795 | $1.32 | 44d | 1 | 1.50mi |
Listing history 21 events
-
2026-06-19days on market $39,800 Active 61 DOM
-
2026-06-18days on market $39,800 Active 60 DOM
-
2026-06-17remarks 333-char remark
-
2026-06-17price $39,800 Active 59 DOM
-
2026-06-17days on market $39,900 Active 59 DOM
-
2026-06-16days on market $39,900 Active 58 DOM
-
2026-06-15days on market $39,900 Active 57 DOM
-
2026-06-14days on market $39,900 Active 55 DOM
-
2026-06-12days on market $39,900 Active 54 DOM
-
2026-06-09days on market $39,900 Active 51 DOM
-
2026-06-08days on market $39,900 Active 50 DOM
-
2026-06-07days on market $39,900 Active 49 DOM
-
2026-06-05days on market $39,900 Active 46 DOM
-
2026-06-03days on market $39,900 Active 45 DOM
-
2026-06-02days on market $39,900 Active 44 DOM
-
2026-06-01days on market $39,900 Active 43 DOM
-
2026-05-31days on market $39,900 Active 42 DOM
-
2026-05-30days on market $39,900 Active 41 DOM
-
2026-05-15price $40,000
-
2026-05-06price $45,000
-
2026-04-17$50,000 Active
ⓘ Source: listings_history table (triggers on properties + properties_extension) + one-shot
backfill from property_details.listing_events for pre-trigger history.
Tax reassessment forecast WV · Resets to sale price
- Current annual tax
- $683 · $57/mo
- Projected year-2 tax
- $683 · $57/mo
- Expected delta
- $0/yr ($0/mo · 0.0%)
ⓘ Screening estimate from a state-policy table — verify with the county assessor before closing.
Climate risk First Street
- Flood 1/10 Low FEMA zone X (unshaded) · 0% chance over 30 yrs
- Wildfire 4/10 Moderate
- Heat 5/10 Major 7 d/yr ≥102°F today · 18 d/yr by 30 yrs out
- Wind 2/10 Low 100% chance of damaging wind over 30 yrs
- Air quality 2/10 Low 0 unhealthy d/yr today · 1 by 30 yrs out
Nearby sold comps map
Loading sold comps map…
Walkable amenities ~0.75 mi
Loading nearby amenities…
Taxation est. · year 1
- Rental income
- $10,414
- − Mortgage interest
- −$2,229
- − Property taxes
- −$683
- − Insurance
- −$199
- − Repairs & maintenance
- −$833
- − Management
- −$833
- − Depreciation
- −$1,158
- Taxable income
- $4,479
- Est. tax owed @ 24.0%
- −$1,075
- After-tax cash flow
- $3,766/yr
For passive investors: Depreciation is non-cash, so a rental often shows a tax loss while cash-flowing — sheltering income. Rental losses are passive: they offset passive income freely, and up to $25,000/yr can offset ordinary (W-2) income if you actively participate and your MAGI is under $100k (phasing out to $0 by $150k); unused losses carry forward. On sale, claimed depreciation is recaptured at up to 25%, and gains may owe capital-gains tax (a 1031 exchange can defer both). Figures are a year-1 estimate at your 24.0% rate — not tax advice; consult a CPA.
Schools (NCES district)
- District
- Cabell County Schools
- NCES district ID
- 5400180
- Math proficiency
- 31% ▼ -7.00%
- Reading proficiency
- 42% ▼ -6.00%
- Median HH income
- $36,426
- Composite
- 30.26/100
- National rank
- #6285
- State rank
- #13 of 55 in WV
Livability — Huntington
- Score
- 79/100
- State rank
- #16
- US rank
- #2045
Category grades
Schools grade is shown separately in the Schools card above.
Census & demographics
- Census place
- Huntington, WV
- City population
- 25,795
- Population (ZIP)
- 20,668
Population outlook (Cabell County) Hauer SSP2
- Today (2025)
- 97,574 people
- By 2030
- 98,060 · +0.5%
- By 2040
- 98,817 · +1.3%
- By 2050
- 100,185 · +2.7%
- By 2075
- 105,895 · +8.5%
- By 2100
- 105,948 · +8.6%
Race, ethnicity, and origin ACS 2023
- Neighborhood character
- Predominantly White (89%)
- Race & ethnicity
- White 89% Black 5% Two or more races 4% Hispanic / Latino 2% Asian 1%
- Common ancestry
- Slovak 3% Serbian 2% Lithuanian 2%
- Foreign-born
- 2%
- Languages at home
- 97% English-only · Spanish 1%
Political lean MEDSL · Cabell
- 2024 margin
- Strong R (+21.9) · D 38.0% · R 59.9% · Other 2.0%
- 2008→2024 swing
- -11.8pp toward R · 2008: -10.1pp · 2024: -21.9pp
- All cycles
- 2024: R+21.9 2020: R+18.0 2016: R+25.5 2012: R+13.9 2008: R+10.1
Not yet ingested
- Civics
- —
Market trends
- HPI YoY
- ▼ -57.08%
- Current HPI
- 171.7797
- Rent YoY
- —
- Metro
- —
- State GDP YoY
- —
- F500 in state
- 0
Price history
-20.0% since first listed3 events — show timeline
- 2026-05-15 Price Changed $40,000 KVBOR
- 2026-05-06 Price Changed $45,000 KVBOR
- 2026-04-17 Listed $50,000 KVBOR
Property tax history
+2.7%/yrLatest (2025): $683 · +16.9% YoY. Source: county tax records.
Cash-flow waterfall
monthlySold comps — $/sqft
last 12 mo · ≤1 miLoading sold comps…