15452 Woody Haven Dr · Grangerland, TX
Flood risk No data
- FEMA flood zone
- —
- Chance of flooding over 30 yrs
- —
- Est. flood insurance / yr
- —
Fire risk No data
- Est. fire insurance / yr
- —
Heat risk No data
- Hot days now (above threshold)
- —
- Hot days in 30 yrs
- —
Wind risk No data
- Chance of severe wind over 30 yrs
- —
Air-quality risk No data
- Unhealthy air days now
- —
- Unhealthy air days in 30 yrs
- —
Risk factors via First Street. Map © Google.
Why this score? — see what drove the D+ grade
The composite is a weighted blend of 9 inputs, each scored 0–100. Each bar is that input's sub-score; the figure is the points it added to the 100-point composite (weight × sub-score).
- Cash flow +16.6/30.0
- ARV discount +7.8/15.0
- DSCR +5.2/10.0
- Schools +5.1/10.0
- 1% rule +4.8/10.0
- Condition / age +4.0/5.0
- Rent growth +3.3/5.0
- Livability +2.5/5.0
- Appreciation +0.0/10.0
$294,990
🖨 Deal sheet 📄 Offer letter ✓ Due diligence
Listing remarks
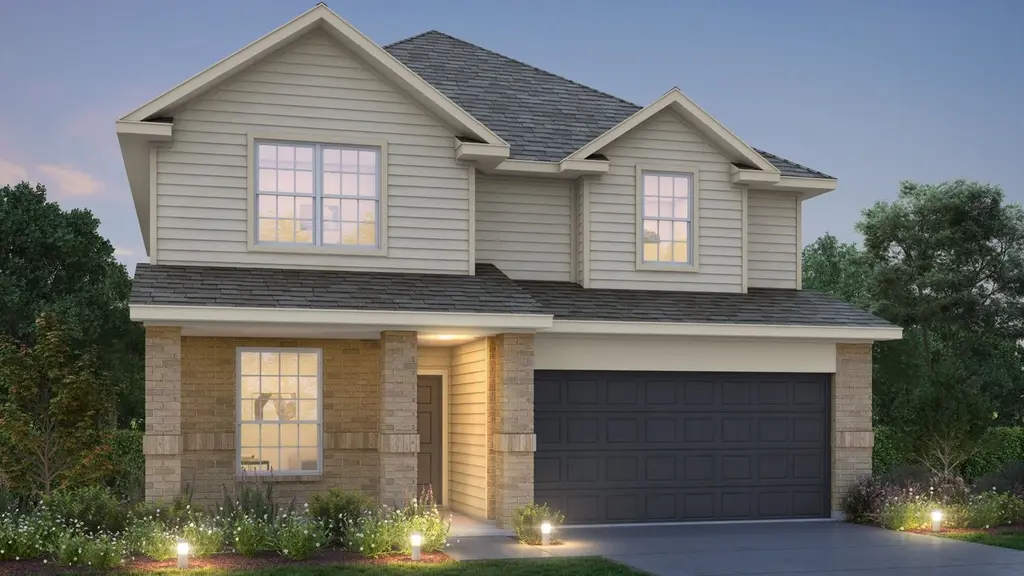
* New Section Now Open! * Love where you live in Granger Pines in Conroe, TX! Now featuring Legend’s NEW Smart Home package and Signature Design Collection! The Sienna floor plan is a spacious two-story home with 4 bedrooms (1 down, 3 up), 3 bathrooms, game room, and a 2-car garage! The home has it all, including a first-floor Guest Suite and vinyl plank flooring. The gourmet kitchen is sure to please with 42' cabinets, silestone countertops, and stainless-steel appliances. Upstairs offers a private retreat for the primary and secondary bedrooms! Retreat to the Owner's Suite featuring double sinks with silestone countertops, a separate tub and shower, and a spacious walk-in closet.
Key facts
- Gourmet kitchen
- 42 cabinets
- Vinyl plank flooring
Tags
Property features AI
Finance
- Financial info: List price $298,640
Exterior
- Parking: 2 total parking spaces; 2-car garage
- Home design: Single-family home (The Sienna plan)
- Exterior features: Living area approximately 2,185
Interior
- Bedrooms: 4 bedrooms
- Bathrooms: 3 full bathrooms
- Interior features: Spec home (new construction, The Sienna plan)
Neighborhood map
What this means for you Summary
Snapshot
- This is a 4-bed/3.0-bath single-family listed at $295k. Condition is rated good.
Deal economics
- At list price, monthly cash flow is $180 ($2k/yr) — positive.
- The deal already cash-flows at list — no discount required.
- To meet the 1% rule (rent ≥ 1% of price), the offer needs to be $288k (2.5% below list).
- Recommended offer: $288k (2.5% below list) — sets the bar for 1% rule.
- Cap rate 7.0% vs local median 5.1% in Grangerland — top-decile yield for the area; either an underpriced asset or a hidden risk that comps aren't pricing in. Stress-test before assuming the spread holds.
Location & tenants
- Location reads: area grade D — affects rentability + tenant quality, not the cash-flow math above.
- Conroe ISD (other): math 57% / reading 57% proficiency, ranked #69 of 826 in TX (top 8%) — acceptable for families but not a draw, mixed tenant base, ~2y average lease.
- Market conditions: Rents rising (+3.3%/yr); 1111 active listings in the ZIP; 2 comparable units currently listed for rent nearby; solid renter incomes; 13,259 units permitted in Montgomery County in 2024 (1,402 in 5+ unit buildings).
- This rent runs 41% of the median local income ($85k/yr) — at the standard rent-burdened threshold; future hikes will face affordability resistance.
Forward outlook
- Local home prices are declining (-3.0%/yr); year-one equity from $2k of loan paydown is wiped out by about $9k of value loss. Plan a longer hold.
- Montgomery County population projected at +65% by 2050 — long-run rental-demand tailwind backs the buy-and-hold thesis.
Negotiation context
- It's been on market 27 days — a 2% lower offer ($291k) is reasonable based on typical stale-listing flexibility.
Questions for the listing agent
- What does the HOA fee cover, when was the last increase, and are there any pending special assessments or reserve-fund shortfalls?
- Is there a deadline driving the sale (1031 exchange, divorce, estate, relocation)? That informs how much negotiation room exists.
- The area grade is low — what's the realistic commute time and amenity access for the typical tenant pool here? Any planned neighborhood developments (good or bad) we should know about?
- What's the average days-on-market for RENTAL listings here right now (not sales)? A rising rental-DOM trend means longer vacancies and softer asking-rent achievability than the comps imply.
- What's the recent tenant-quality profile in this submarket — average credit score on applications, eviction rate, late-payment / NSF rate, and stable-employment percentage? A property-management company in the area should have these aggregated.
- How much new for-sale + rental construction is in the pipeline within 1–3 miles? Heavy new supply typically softens prices + rents 12–24 months out; constrained supply supports both.
Investment metrics
- 1% rule
- 0.98% ✗
- Cap rate
- 7.03%
- Cash-on-cash
- 2.62%
- DSCR
- 1.12
- GRM
- 8.5
CMA / ARV
- ARV (on-the-fly)
- $297,160
- Comps found
- 12
Show comp detail 12 sales within ~0.75 mi
| Address | Dist | Beds/Ba | Sqft | Sold | Price | $/sf | Match |
|---|---|---|---|---|---|---|---|
| 16827 Country Roots Ave | 0.21mi | 4/3.0 | 2,173 (-0%) | 1mo | $306,990 | $141 | 88 |
| 15611 Country Charm Trl | 0.19mi | 4/3.0 | 2,084 (-5%) | 1mo | $322,258 | $155 | 82 |
| 16767 Country Roots Ave | 0.25mi | 4/3.0 | 2,034 (-7%) | 0mo | $310,990 | $153 | 76 |
| 14154 Granger Pointe | 0.60mi | 4/2.5 | 2,255 (+3%) | 1mo | $269,540 | $120 | 64 |
| 16866 Needlepoint Dr | 0.72mi | 4/2.5 | 2,049 (-6%) | 2mo | $279,212 | $136 | 52 |
| 14143 Granger Pointe Ln | 0.63mi | 4/2.5 | 1,981 (-9%) | 2mo | $252,790 | $128 | 51 |
| 14305 Grey Pointe | 0.67mi | 4/2.5 | 1,981 (-9%) | 0mo | $269,790 | $136 | 51 |
| 14308 Grey Pointe Ct | 0.68mi | 4/2.5 | 1,981 (-9%) | 1mo | $264,640 | $134 | 50 |
| 16812 Needlepoint Dr | 0.69mi | 3/2.5 (-1) | 2,026 (-7%) | 1mo | $269,765 | $133 | 48 |
| 16981 Hazelnut Dr | 0.63mi | 3/2.5 (-1) | 2,447 (+12%) | 2mo | $334,900 | $137 | 42 |
| 14300 Ash Tree Dr | 0.65mi | 3/2.5 (-1) | 2,447 (+12%) | 1mo | $324,900 | $133 | 41 |
| 14337 Ash Tree Dr | 0.70mi | 3/2.5 (-1) | 2,447 (+12%) | 1mo | $319,900 | $131 | 40 |
Match score weights: distance 35% · size 25% · config 20% · recency 20%. Top-matched comps best support the ARV.
Projected returns pro-forma
-3.0% appreciation · 3.3% rent growth · sell at horizon
- IRR
- -11.8%
- Equity multiple
- 0.57×
- Total profit
- $-35,386
- Equity at exit
- $43,984
- IRR
- -2.1%
- Equity multiple
- 0.85×
- Total profit
- $-12,140
- Equity at exit
- $25,505
Cash invested: $82,597 (down + closing). Projections, not guarantees.
Landlord ↔ Tenant lean methodology
- Overall (STATE)
- 87 Strongly Landlord-Friendly
- State Texas
- 87 Strongly Landlord-Friendly · R+5
- County
- — inherits STATE
- City
- — inherits STATE
ZIP-level market 77302
- Rents YoY
- 3.3%
- Active inventory
- 1111
- Price-to-rent
- 8.5×
Monthly cashflow live
- Estimated rent
- $2,877 medium interval (Pro) →
- Mortgage (P&I)
- −$1,547
- Tax est. 1.5%
- −$369 /mo · $4,425/yr
- Insurance
- −$123
- HOA
- −$54
- Vacancy / Maint / Mgmt
- −$604
- Net cashflow
- $180
Break-even live
UW: 25.0% down · 7.5% · 30yr · 1.5% tax · 5.0% vac · 8.0% maint · 8.0% mgmt
Financing live
Cash to close
- Down payment
- $73,748
- Closing costs
- $8,850
- Reserves months
- —
- Total cash needed
- —
Loan-product check · same deal, 3 products live
Conventional
25% down · 7.5% · 30yr
- Down + closing
- —
- Monthly P&I
- —
- Monthly cashflow
- —
- DSCR
- —
- Eligible?
- —
Personal DTI + credit; lowest rate.
DSCR
20% down · 8.5% · 30yr
- Down + closing
- —
- Monthly P&I
- —
- Monthly cashflow
- —
- DSCR
- —
- Eligible?
- —
No personal income docs; deal must DSCR.
Hard money
10% down · 12.0% · 12mo
- Down + closing
- —
- Monthly P&I
- —
- Monthly cashflow
- —
- DSCR
- —
- Eligible?
- —
Short-term bridge; refi at stabilization.
Rent comps 2 comps
| Address | Beds | Baths | Sqft | Rent | $/sqft | DOM | Units | Dist |
|---|---|---|---|---|---|---|---|---|
| 16703 Twisted Pine Dr Conroe, TX | 3.0–4.0 | 2.0–3.0 | 1671 | $2,230 | $1.33 | 1d | 13 | 0.76mi |
| 15447 Dapple Bluff Ln Conroe, TX | 4.0 | 2.5 | 2265 | $2,900 | $1.28 | 43d | 1 | 1.17mi |
HOA detail
- Monthly dues
- $54 · $648/yr
Listing history 13 events
-
2026-06-18days on market $294,990 Active 27 DOM
-
2026-06-17days on market $294,990 Active 26 DOM
-
2026-06-16pricedays on market $294,990 Active 25 DOM
-
2026-06-15days on market $298,640 Active 24 DOM
-
2026-06-13days on market $298,640 Active 22 DOM
-
2026-06-09days on market $298,640 Active 18 DOM
-
2026-06-08days on market $298,640 Active 17 DOM
-
2026-06-07days on market $298,640 Active 16 DOM
-
2026-06-04days on market $298,640 Active 13 DOM
-
2026-06-03days on market $298,640 Active 12 DOM
-
2026-06-02days on market $298,640 Active 11 DOM
-
2026-06-01days on market $298,640 Active 10 DOM
-
2026-05-31days on market $298,640 Active 9 DOM
ⓘ Source: listings_history table (triggers on properties + properties_extension) + one-shot
backfill from property_details.listing_events for pre-trigger history.
Nearby sold comps map
Loading sold comps map…
Walkable amenities ~0.75 mi
Loading nearby amenities…
Taxation est. · year 1
- Rental income
- $34,521
- − Mortgage interest
- −$16,524
- − Property taxes
- −$4,425
- − Insurance
- −$1,475
- − Repairs & maintenance
- −$2,762
- − Management
- −$2,762
- − HOA
- −$648
- − Depreciation
- −$8,582
- Taxable loss
- −$2,655
- Est. tax savings @ 24.0%
- +$637
- After-tax cash flow
- $2,798/yr
For passive investors: Depreciation is non-cash, so a rental often shows a tax loss while cash-flowing — sheltering income. Rental losses are passive: they offset passive income freely, and up to $25,000/yr can offset ordinary (W-2) income if you actively participate and your MAGI is under $100k (phasing out to $0 by $150k); unused losses carry forward. On sale, claimed depreciation is recaptured at up to 25%, and gains may owe capital-gains tax (a 1031 exchange can defer both). Figures are a year-1 estimate at your 24.0% rate — not tax advice; consult a CPA.
Condition & rehab AI · 25 photos
This home is in excellent condition with modern finishes and a well-maintained exterior. It's ready for immediate occupancy and would be a great investment.
Value-add opportunities
- Resale Paint exterior trim — Enhances curb appeal
- Rental Clean gutters — Keeps home in good condition
Renovation cost estimate screening
Value-add ROI direction
- Resale Paint exterior trim — Enhances curb appeal ↑
- Rental Clean gutters — Keeps home in good condition ↑
ⓘ Cost ranges are severity-bucket heuristics (US national rule-of-thumb). Get contractor quotes + a written scope before underwriting a rehab budget.
Schools (NCES district)
- District
- Conroe ISD
- NCES district ID
- 4815000
- Math proficiency
- 57% ▼ -6.00%
- Reading proficiency
- 57% ▼ -1.00%
- Median HH income
- $71,541
- Composite
- 50.65/100
- National rank
- #1833
- State rank
- #69 of 826 in TX
Livability — Grangerland
No livability data for this city. (Only ~50 U.S. cities are tracked.)
Census & demographics
- County
- Montgomery County · 663,713 people
- Metro
- Houston-The Woodlands-Sugar Land, TX
- Population (ZIP)
- 21,546
- Household income
- $84,673
- Rent vs Own
- Severe rent burden
- 205.0
Population outlook (Montgomery County) Hauer SSP2
- Today (2025)
- 713,896 people
- By 2030
- 805,263 · +12.8%
- By 2040
- 992,708 · +39.1%
- By 2050
- 1,179,590 · +65.2%
- By 2075
- 1,628,084 · +128.1%
- By 2100
- 1,937,880 · +171.5%
Race, ethnicity, and origin ACS 2023
- Neighborhood character
- Majority White (63%)
- Race & ethnicity
- White 63% Hispanic / Latino 29% Two or more races 19% Black 3% Asian 1%
- Hispanic origin (detail)
- Mexican 26% Puerto Rican 1%
- Common ancestry
- Lithuanian 3% Italian 2% Slovak 2%
- Foreign-born
- 13% · Canada, Vietnam, China
- Languages at home
- 78% English-only · Spanish 20% Russian/Polish/Slavic 1% Other Indo-European 0%
Political lean MEDSL · Montgomery
- 2024 margin
- Solid R (+45.5) · D 26.8% · R 72.3%
- 2008→2024 swing
- +7.2pp toward D · 2008: -52.7pp · 2024: -45.5pp
- All cycles
- 2024: R+45.5 2020: R+43.8 2016: R+51.4 2012: R+60.7 2008: R+52.7
Not yet ingested
- Civics
- —
Market trends
- HPI YoY
- ▼ -187.56%
- Current HPI
- 262.1879
- Rent YoY
- ▲ 3.30%
- Metro
- Houston-The Woodlands-Sugar Land, TX
- State GDP YoY
- ▲ 3.95%
- F500 in state
- 110
Industry mix (Fortune 500 HQ in TX)
| Industry | F500 HQs | Revenue |
|---|---|---|
| Energy | 16 | $1,198B |
|
||
| Technology | 5 | $198B |
|
||
| Engineering / Construction | 4 | $72B |
|
||
| Energy Services | 3 | $60B |
|
||
| Utilities | 3 | $41B |
|
||
| Healthcare | 2 | $330B |
|
||
Cash-flow waterfall
monthlySold comps — $/sqft
last 12 mo · ≤1 miLoading sold comps…