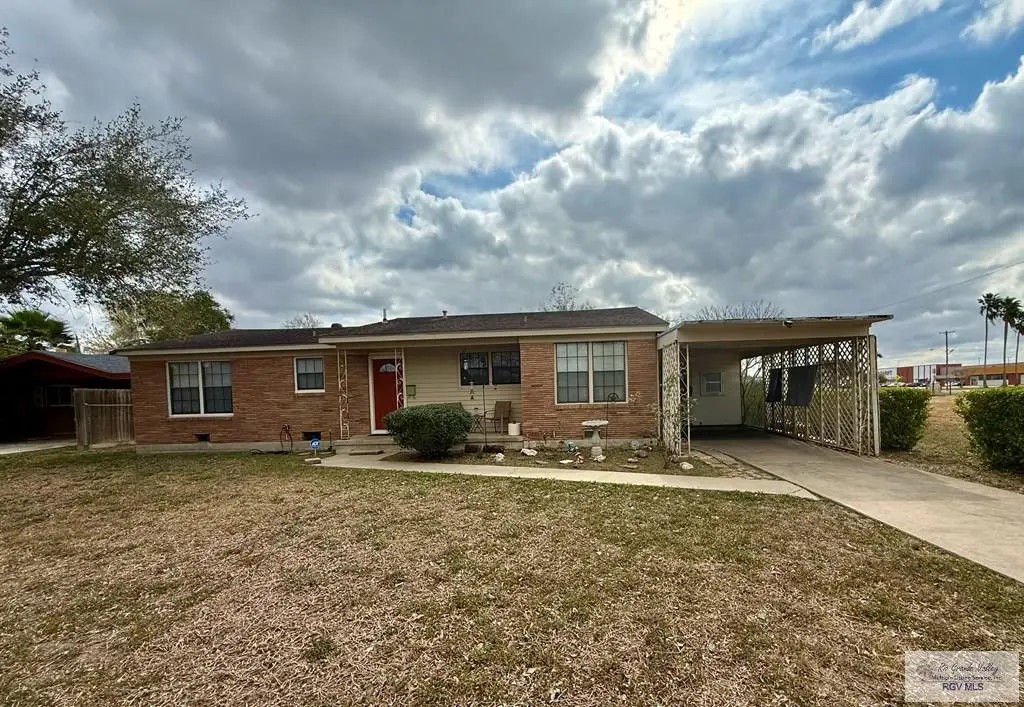
1310 E Bowie Ave · Harlingen, TX
Flood risk 1/10 · Minimal
- FEMA flood zone
- X (unshaded)
- Chance of flooding over 30 yrs
- 0.0%
- Est. flood insurance / yr
- $507 – $1,088
Fire risk 2/10 · Minimal
- Est. fire insurance / yr
- $1,222 – $2,270
Heat risk 9/10 · Severe
- Hot days now (above 110°F)
- 7 days/yr
- Hot days in 30 yrs
- 25 days/yr
Wind risk 8/10 · Major
- Chance of severe wind over 30 yrs
- 99.0%
Air-quality risk 1/10 · Minimal
- Unhealthy air days now
- 0 days/yr
- Unhealthy air days in 30 yrs
- 0 days/yr
Risk factors via First Street. Map © Google.
Why this score? — see what drove the C+ grade
The composite is a weighted blend of 9 inputs, each scored 0–100. Each bar is that input's sub-score; the figure is the points it added to the 100-point composite (weight × sub-score).
- Cash flow +22.2/30.0
- ARV discount +15.0/15.0
- DSCR +7.1/10.0
- 1% rule +5.6/10.0
- Livability +3.7/5.0
- Rent growth +3.4/5.0
- Schools +2.5/10.0
- Condition / age +2.5/5.0
- Appreciation +0.0/10.0
$174,900
🖨 Deal sheet (PDF) 📄 Offer letter ✓ Due diligence
Listing remarks MLS
Amazing Location near Wesley Methodist Church and Preschool and St. Albans Episcopal Day School and shopping. Spacious Home with 3 bedrooms and 2 baths Sun Room. Bonus room and Laundry room. Huge Lot . Home to be sold in "AS IS" Condition So much potential must see.
Key facts
- Laundry room
- Sun room
- Bonus room
Tags
Neighborhood map
What this means for you Summary
Snapshot
- This is a 3-bed/2.0-bath single-family listed at $175k.
Deal economics
- At list price, monthly cash flow is $286 ($3k/yr) — positive.
- The deal already cash-flows at list — no discount required.
- Meets the 1% rule at list price ($2k rent vs $175k).
- Recommended offer: $154k (12.0% below list) — sets the bar for market timing.
- Cap rate 8.3% vs local median 3.8% in Harlingen — top-decile yield for the area; either an underpriced asset or a hidden risk that comps aren't pricing in. Stress-test before assuming the spread holds.
Location & tenants
- Location reads 73/100 on livability (#217 in TX) — a middle-class / working-renter tenant base. Strengths: amenities A+, cost of living A+, housing A+; Watch: crime C-, schools D+, commute F.
- Harlingen CISD (urban): math 25% / reading 35% proficiency, ranked #647 of 826 in TX (top 78%) — families likely to look elsewhere, expect single-tenant / working-renter base with shorter leases; 74% free/reduced lunch — lower-income household profile, screen leases tightly.
- Market conditions: Rents rising (+3.5%/yr); 465 active listings in the ZIP; 14 comparable units currently listed for rent nearby; rentals at typical pace (median 22d on market — plan ~3-4 weeks tenant-placement turnaround); 43% of comp listings sitting > 30 days — soft ceiling on asking rent; 2,326 units permitted in Cameron County in 2024 (503 in 5+ unit buildings).
- At $1,848/mo this rent would consume 45% of the median local household income ($49k/yr) (locally 2251% of renters already pay >50% of income on rent) — very limited rent-growth headroom before tenants either downsize or default.
Forward outlook
- Local home prices are declining (-3.0%/yr); year-one equity from $1k of loan paydown is wiped out by about $5k of value loss. Plan a longer hold.
- Cameron County population projected at +3% by 2050 — modest demand growth; plan on rents tracking national, not racing it.
Negotiation context
- It's been on market 129 days — a 12% lower offer ($154k) is reasonable based on typical stale-listing flexibility.
Risks & watch-outs
- Watch-outs: built in 1953 — expect roof / HVAC / electrical / plumbing capex.
- Climate carrying-cost: severe wind risk, 99% chance of damaging wind over 30y; extreme-heat days projected 7→25/yr by 2055 (HVAC capex compounding) — expect insurance premiums to compound above CPI over the hold.
Questions for the listing agent
- It's been on market 129 days. Have you received any prior offers? Is the seller open to a 12% concession, seller financing, or rate buy-down credit?
- Built in 1953 — when were the roof, HVAC, electrical panel, plumbing, and water heater last replaced?
- Why hasn't it sold? Are there any deal-killer items the seller is aware of (foundation, flood, title, zoning, code violations)?
- Is there a deadline driving the sale (1031 exchange, divorce, estate, relocation)? That informs how much negotiation room exists.
- Schools are D-rated, which usually means shorter tenancies and higher turnover. Who's the typical renter profile here, and what's been the actual vacancy rate?
- What's the average days-on-market for RENTAL listings here right now (not sales)? A rising rental-DOM trend means longer vacancies and softer asking-rent achievability than the comps imply.
- What's the recent tenant-quality profile in this submarket — average credit score on applications, eviction rate, late-payment / NSF rate, and stable-employment percentage? A property-management company in the area should have these aggregated.
- How much new for-sale + rental construction is in the pipeline within 1–3 miles? Heavy new supply typically softens prices + rents 12–24 months out; constrained supply supports both.
Investment metrics
- 1% rule
- 1.06% ✓
- Cap rate
- 8.26%
- Cash-on-cash
- 7.01%
- DSCR
- 1.31
- GRM
- 7.9
CMA / ARV
- ARV (median comp)
- $218,698
- List price
- $174,900
- Delta
- -20.03%
- Verdict
- UNDERPRICED
- Comps
- 20 within 1.0 mi
Show comp detail 10 sales within ~0.75 mi
| Address | Dist | Beds/Ba | Sqft | Sold | Price | $/sf | Match |
|---|---|---|---|---|---|---|---|
| 1205 E Crockett Ave | 0.13mi | 3/2.5 | 2,154 (+3%) | 14mo | $160,000 | $74 | 75 |
| 720 21st St | 0.56mi | 3/3.0 | 2,052 (-2%) | 9mo | $230,000 | $112 | 59 |
| 914 E Carrol St | 0.31mi | 4/2.0 (+1) | 1,914 (-8%) | 13mo | $185,000 | $97 | 56 |
| 2401 E Austin Ave | 0.69mi | 3/2.0 | 1,936 (-7%) | 9mo | $155,000 | $80 | 48 |
| 1725 Peach Tree Ct | 0.56mi | 3/2.0 | 1,783 (-15%) | 2mo | $210,000 | $118 | 48 |
| 1514 Walnut Ct | 0.59mi | 4/3.0 (+1) | 2,278 (+9%) | 2mo | $264,000 | $116 | 47 |
| 1509 Walnut Ct | 0.61mi | 3/2.0 | 1,872 (-10%) | 16mo | $199,900 | $107 | 41 |
| 808 E Whitehouse Cir | 0.73mi | 4/3.0 (+1) | 1,888 (-10%) | 4mo | $188,000 | $100 | 38 |
| 1609 Plantation Dr | 0.58mi | 3/2.0 | 1,847 (-12%) | 22mo | $249,900 | $135 | 35 |
| 1213 Ferguson Dr | 0.72mi | 3/3.0 | 2,207 (+6%) | 23mo | $250,000 | $113 | 34 |
Match score weights: distance 35% · size 25% · config 20% · recency 20%. Top-matched comps best support the ARV.
Projected returns pro-forma
-3.0% appreciation · 3.45% rent growth · sell at horizon
- IRR
- -5.1%
- Equity multiple
- 0.81×
- Total profit
- $-9,279
- Equity at exit
- $26,078
- IRR
- 5.1%
- Equity multiple
- 1.39×
- Total profit
- $18,883
- Equity at exit
- $15,122
Cash invested: $48,972 (down + closing). Projections, not guarantees.
Landlord ↔ Tenant lean methodology
- Overall (STATE)
- 87 Strongly Landlord-Friendly
- State Texas
- 87 Strongly Landlord-Friendly · R+5
- County
- — inherits STATE
- City
- — inherits STATE
ZIP-level market 78550
- Rents YoY
- 3.5%
- Active inventory
- 465
- Price-to-rent
- 7.9×
Monthly cashflow live
- Estimated rent
- $1,848 high interval (Pro) →
- Mortgage (P&I)
- −$917
- Tax from tax record
- −$184 /mo · $2,207/yr
- Insurance
- −$73
- HOA
- −$0
- Vacancy / Maint / Mgmt
- −$388
- Net cashflow
- $286
Break-even live
Sensitivity live
| Price | -10% $385 | -5% $336 | +0% $286 | +5% $236 | +10% $187 |
|---|---|---|---|---|---|
| Rent | -10% $140 | -5% $213 | +0% $286 | +5% $359 | +10% $432 |
| Rate | -1.0pp $374 | -0.5pp $330 | base $286 | +0.5pp $241 | +1.0pp $195 |
UW: 25.0% down · 7.5% · 30yr · 1.5% tax · 5.0% vac · 8.0% maint · 8.0% mgmt
Financing live
Cash to close
- Down payment
- $43,725
- Closing costs
- $5,247
- Reserves months
- —
- Total cash needed
- —
Loan-product check · same deal, 3 products live
Conventional
25% down · 7.5% · 30yr
- Down + closing
- —
- Monthly P&I
- —
- Monthly cashflow
- —
- DSCR
- —
- Eligible?
- —
Personal DTI + credit; lowest rate.
DSCR
20% down · 8.5% · 30yr
- Down + closing
- —
- Monthly P&I
- —
- Monthly cashflow
- —
- DSCR
- —
- Eligible?
- —
No personal income docs; deal must DSCR.
Hard money
10% down · 12.0% · 12mo
- Down + closing
- —
- Monthly P&I
- —
- Monthly cashflow
- —
- DSCR
- —
- Eligible?
- —
Short-term bridge; refi at stabilization.
Rent comps 14 comps
| Address | Beds | Baths | Sqft | Rent | $/sqft | DOM | Units | Dist |
|---|---|---|---|---|---|---|---|---|
| 914 E Carrol St Harlingen, TX | 3.0 | 2.5 | 1914 | $1,700 | $0.89 | 22d | 1 | 0.31mi |
| 1309 Summerfield Ln Harlingen, TX | 3.0 | 2.0 | 2127 | $2,100 | $0.99 | 44d | 1 | 0.82mi |
| 1057 E Matz Ave Harlingen, TX | 3.0 | 2.0 | 1692 | $1,850 | $1.09 | 44d | 1 | 0.87mi |
| 918 E Leggett Rd Harlingen, TX | 3.0 | 2.0 | 1756 | $1,700 | $0.97 | 22d | 1 | 0.92mi |
| 714 Winddrift St Harlingen, TX | 3.0 | 2.0 | 1668 | $1,850 | $1.11 | 22d | 1 | 0.95mi |
| 421 Jennifer Ct Harlingen, TX | 3.0 | 2.0 | 2027 | $1,975 | $0.97 | 22d | 1 | 0.97mi |
| 1630 Summerfield Ln N Harlingen, TX | 3.0 | 2.0 | 1680 | $1,900 | $1.13 | 22d | 1 | 1.02mi |
| 2605 E Mark Cir Harlingen, TX | 4.0 | 3.0 | 2437 | $2,400 | $0.98 | 45d | 1 | 1.04mi |
| 2234 S Christians Cir Harlingen, TX | 3.0 | 2.0 | 1493 | $2,400 | $1.61 | 44d | 1 | 1.09mi |
| 2706 Jeff St Harlingen, TX | 4.0 | 2.0 | 2007 | $2,100 | $1.05 | 22d | 1 | 1.12mi |
| 1622 Gabriels Lndg Harlingen, TX | 4.0 | 2.0 | 2200 | $2,000 | $0.91 | 44d | 1 | 1.25mi |
| 1701 Gabriels Lndg Harlingen, TX | 3.0 | 2.0 | 1699 | $2,350 | $1.38 | 22d | 1 | 1.29mi |
| 1626 Christians Cir Harlingen, TX | 3.0 | 2.0 | 1827 | $2,200 | $1.20 | 14d | 1 | 1.31mi |
| 226 W Darrell Wayne Shipp St Harlingen, TX | 3.0 | 2.0 | 1400 | $1,700 | $1.21 | 44d | 1 | 1.34mi |
Listing history 7 events
-
2026-06-07statusdays on market $174,900 Pending 129 DOM
-
2026-06-01days on market $174,900 Active 128 DOM
-
2026-05-31days on market $174,900 Active 127 DOM
-
2026-05-30days on market $174,900 Active 126 DOM
-
2026-05-04price $174,900 278-char remark
Show marketing remark (278 chars)
Amazing Location near Wesley Methodist Church and Preschool and St. Albans Episcopal Day School and shopping. Spacious Home with 3 bedrooms and 2 baths Sun Room. Bonus room and Laundry room. Huge Lot . Home to be sold in "AS IS" Condition So much potential must see.
-
2026-03-09price $184,900 278-char remark
Show marketing remark (278 chars)
Amazing Location near Wesley Methodist Church and Preschool and St. Albans Episcopal Day School and shopping. Spacious Home with 3 bedrooms and 2 baths Sun Room. Bonus room and Laundry room. Huge Lot . Home to be sold in "AS IS" Condition So much potential must see.
-
2026-01-23$189,900 Active 278-char remark
Show marketing remark (278 chars)
Amazing Location near Wesley Methodist Church and Preschool and St. Albans Episcopal Day School and shopping. Spacious Home with 3 bedrooms and 2 baths Sun Room. Bonus room and Laundry room. Huge Lot . Home to be sold in "AS IS" Condition So much potential must see.
ⓘ Source: listings_history table (triggers on properties + properties_extension) + one-shot
backfill from property_details.listing_events for pre-trigger history.
Tax reassessment forecast TX · Resets to sale price
- Current annual tax
- $2,207 · $184/mo
- Projected year-2 tax
- $3,201 · $267/mo
- Expected delta
- +$994/yr (+$83/mo · 45.0%)
ⓘ Screening estimate from a state-policy table — verify with the county assessor before closing.
Climate risk First Street
- Flood 1/10 Low FEMA zone X (unshaded) · 0% chance over 30 yrs
- Wildfire 2/10 Low
- Heat 9/10 Extreme 7 d/yr ≥110°F today · 25 d/yr by 30 yrs out
- Wind 8/10 Severe 99% chance of damaging wind over 30 yrs
- Air quality 1/10 Low 0 unhealthy d/yr today · 0 by 30 yrs out
Nearby sold comps map
Loading sold comps map…
Walkable amenities ~0.75 mi
Loading nearby amenities…
Taxation est. · year 1
- Rental income
- $22,177
- − Mortgage interest
- −$9,797
- − Property taxes
- −$2,207
- − Insurance
- −$874
- − Repairs & maintenance
- −$1,774
- − Management
- −$1,774
- − Depreciation
- −$5,088
- Taxable income
- $662
- Est. tax owed @ 24.0%
- −$159
- After-tax cash flow
- $3,273/yr
For passive investors: Depreciation is non-cash, so a rental often shows a tax loss while cash-flowing — sheltering income. Rental losses are passive: they offset passive income freely, and up to $25,000/yr can offset ordinary (W-2) income if you actively participate and your MAGI is under $100k (phasing out to $0 by $150k); unused losses carry forward. On sale, claimed depreciation is recaptured at up to 25%, and gains may owe capital-gains tax (a 1031 exchange can defer both). Figures are a year-1 estimate at your 24.0% rate — not tax advice; consult a CPA.
Schools (NCES district)
- District
- Harlingen CISD
- NCES district ID
- 4822530
- Math proficiency
- 25% ▼ -28.00%
- Reading proficiency
- 35% ▼ -11.00%
- Median HH income
- $37,182
- Composite
- 24.94/100
- National rank
- #7566
- State rank
- #647 of 826 in TX
Livability — Harlingen
- Score
- 73/100
- State rank
- #217
- US rank
- #5347
Category grades
Schools grade is shown separately in the Schools card above.
Census & demographics
- Census place
- Harlingen, TX
- County
- Cameron County · 310,734 people
- City population
- 95,667
- Metro
- Brownsville-Harlingen, TX
- Population (ZIP)
- 53,335
- Household income
- $49,007
- Rent vs Own
- Severe rent burden
- 2251.0
Population outlook (Cameron County) Hauer SSP2
- Today (2025)
- 441,603 people
- By 2030
- 448,113 · +1.5%
- By 2040
- 456,385 · +3.3%
- By 2050
- 456,294 · +3.3%
- By 2075
- 423,851 · -4.0%
- By 2100
- 342,787 · -22.4%
Race, ethnicity, and origin ACS 2023
- Neighborhood character
- Predominantly Hispanic (83%)
- Race & ethnicity
- Hispanic / Latino 83% Two or more races 29% White 14% Black 1%
- Hispanic origin (detail)
- Mexican 76%
- Common ancestry
- Italian 1% Lithuanian 1%
- Foreign-born
- 14% · Canada
- Languages at home
- 51% English-only · Spanish 48%
Political lean MEDSL · Cameron
- 2024 margin
- Lean R (+5.8) · D 46.7% · R 52.5%
- 2008→2024 swing
- -34.6pp toward R · 2008: 28.8pp · 2024: -5.8pp
- All cycles
- 2024: R+5.8 2020: D+13.2 2016: D+32.5 2012: D+32.4 2008: D+28.8
Not yet ingested
- Civics
- —
Market trends
- HPI YoY
- ▼ -142.60%
- Current HPI
- 167.7038
- Rent YoY
- ▲ 3.45%
- Metro
- Brownsville-Harlingen, TX
- State GDP YoY
- ▲ 3.95%
- F500 in state
- 110
Industry mix (Fortune 500 HQ in TX)
| Industry | F500 HQs | Revenue |
|---|---|---|
| Energy | 16 | $1,198B |
|
||
| Technology | 5 | $198B |
|
||
| Engineering / Construction | 4 | $72B |
|
||
| Energy Services | 3 | $60B |
|
||
| Utilities | 3 | $41B |
|
||
| Healthcare | 2 | $330B |
|
||
Price history
-7.9% since first listed3 events — show timeline
- 2026-05-04 Price Changed $174,900 RGVMLS
- 2026-03-09 Price Changed $184,900 RGVMLS
- 2026-01-23 Listed $189,900 RGVMLS
Property tax history
+2.5%/yrLatest (2025): $2,207 · -0.3% YoY. Source: county tax records.
Cash-flow waterfall
monthlySold comps — $/sqft
last 12 mo · ≤1 miLoading sold comps…