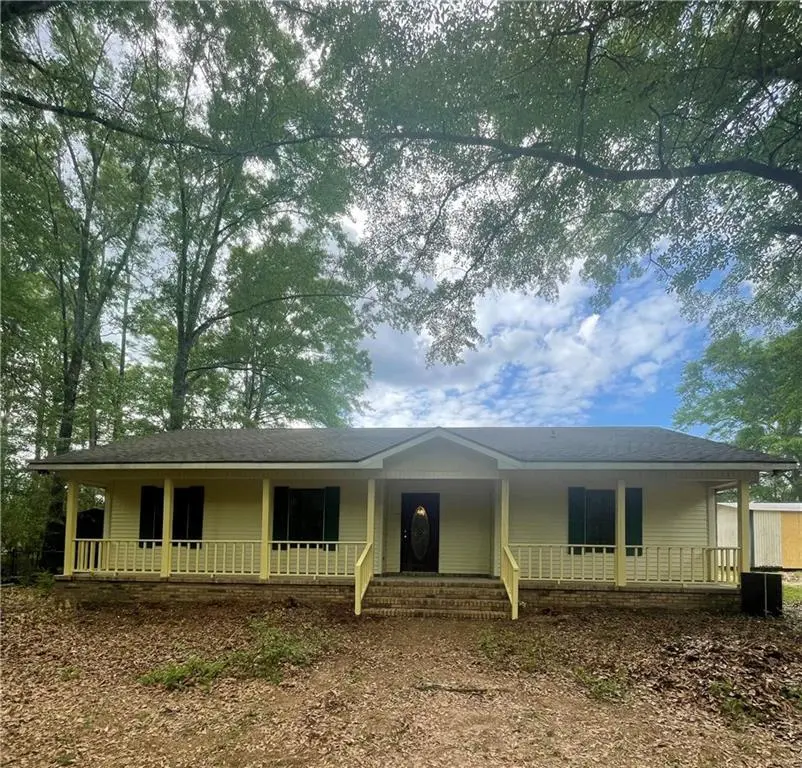
10825 Mitt Dr · Citronelle, AL
Flood risk 1/10 · Minimal
- FEMA flood zone
- X (unshaded)
- Chance of flooding over 30 yrs
- 0.0%
- Est. flood insurance / yr
- $507 – $1,088
Fire risk 6/10 · Moderate
- Est. fire insurance / yr
- $916 – $1,700
Heat risk 8/10 · Major
- Hot days now (above 107°F)
- 7 days/yr
- Hot days in 30 yrs
- 20 days/yr
Wind risk 9/10 · Severe
- Chance of severe wind over 30 yrs
- 99.0%
Air-quality risk 1/10 · Minimal
- Unhealthy air days now
- 0 days/yr
- Unhealthy air days in 30 yrs
- 0 days/yr
Risk factors via First Street. Map © Google.
Why this score? — see what drove the B- grade
The composite is a weighted blend of 9 inputs, each scored 0–100. Each bar is that input's sub-score; the figure is the points it added to the 100-point composite (weight × sub-score).
- Cash flow +22.0/30.0
- ARV discount +15.0/15.0
- Appreciation +10.0/10.0
- DSCR +7.0/10.0
- 1% rule +4.6/10.0
- Livability +3.1/5.0
- Rent growth +2.5/5.0
- Condition / age +2.5/5.0
- Schools +2.3/10.0
$149,000
🖨 Deal sheet (PDF) 📄 Offer letter ✓ Due diligence
Listing remarks
This spacious 3 bedroom and 2-bathroom house is a blank canvas to make it home. The living room has lots of natural light and very spacious. The home also offers a bonus room. Mitt Drive has 4 residences and is a quiet street with little traffic, which ends at a cul-de-sac with no through traffic. The one acre is surrounded by trees and is partially cleared, providing privacy in a wooded setting along the borders. The backyard is fenced for security. The back yard has large established Azaleas that meet the golf course. There are 2 partially cleared lots fencing the property that can be purchased separately which would give you a total of 2 acres. The home is clean, move in ready. The large
Key facts
- Quiet street
- Bonus room
- Surrounded by trees
Tags
Property features AI
Exterior
- Parking: Detached parking
- Utilities: Electricity available (110V and 220V); Natural gas available; Water available; Septic tank sewer
- Home design: Single-family residence; Residential property; Subdivided in Dogwood Estates; View available
- Construction: Built in 1992; Brick on three sides with vinyl siding; Shingle roof; Slab foundation; Insulated windows
- Exterior features: Private yard; Shed(s); Back yard fencing, chain-link fenced
Interior
- Kitchen: Electric oven; Microwave
- Bedrooms: 3 bedrooms
- Flooring: Concrete flooring; Vinyl flooring
- Bathrooms: 2 full bathrooms
- Heating & cooling: Electric heating; Central air conditioning
- Interior features: Disappearing attic stairs; 9-ft (or higher) ceilings on main level; Walk-in closets; Fireplace in the great room with circulating feature; Cabinets in kitchen; No basement
- Laundry & utility: Gas water heater
Neighborhood map
What this means for you Summary
Snapshot
- This is a 3-bed/2.0-bath single-family listed at $149k.
Deal economics
- At list price, monthly cash flow is $238 ($3k/yr) — positive.
- The deal already cash-flows at list — no discount required.
- To meet the 1% rule (rent ≥ 1% of price), the offer needs to be $142k (4.5% below list).
- Recommended offer: $142k (4.5% below list) — sets the bar for 1% rule.
- Cap rate 8.2% vs local median 5.2% in Citronelle — top-decile yield for the area; either an underpriced asset or a hidden risk that comps aren't pricing in. Stress-test before assuming the spread holds.
Location & tenants
- Location reads 61/100 on livability (#254 in AL) — a middle-class / working-renter tenant base. Strengths: crime A+, cost of living A+, housing B+; Watch: employment C-, amenities F, commute F.
- Mobile County (urban): math 15% / reading 39% proficiency, ranked #81 of 129 in AL (top 63%) — low school quality limits family demand, transient renter base, plan for 1-2y turnover; 67% free/reduced lunch — lower-income household profile, screen leases tightly.
- Zoned schools: Citronelle High School (math 8% / reading 8%, grade F, #261 of 305 statewide, top 87%, 719 students, 70% FRL) — zoned schools at 70% FRL track the district average.
- Zoned-school proficiency averages 8% at this address vs 27% district-wide (-20 pts) — the specific schools serving this property underperform the Mobile County average; the district grade overstates school quality for this exact location.
- Market conditions: 63 active listings in the ZIP; 1,678 units permitted in Mobile County in 2024 (264 in 5+ unit buildings).
Forward outlook
- In year one you build about $16k of equity ($1k loan paydown + $15k appreciation (10.0% local appreciation)).
- Mobile County population projected to shrink 8% by 2050 — rents likely to lag national; underwrite the cash flow, not the appreciation.
- At projected returns (10.0% appreciation + 3.0% rent growth), your $42k cash investment doubles in ~3 years — after that, you're playing with house money.
- By year 3, paydown + projected appreciation supports a ~$40k cash-out refi (75% LTV) — recoverable capital for the next deal without selling this one.
Negotiation context
- Only 8 days on market — expect competitive offers; lowballing is unlikely to land.
- 2 sale attempts; this cycle's ask has dropped $21k (12%) from the opening price — seller is motivated, your offer sets the floor, not the list.
Risks & watch-outs
- Climate carrying-cost: severe wind risk, 99% chance of damaging wind over 30y; major wildfire risk; extreme-heat days projected 7→20/yr by 2055 (HVAC capex compounding) — expect insurance premiums to compound above CPI over the hold.
Questions for the listing agent
- Is there a deadline driving the sale (1031 exchange, divorce, estate, relocation)? That informs how much negotiation room exists.
- Schools are F-rated, which usually means shorter tenancies and higher turnover. Who's the typical renter profile here, and what's been the actual vacancy rate?
- What's the average days-on-market for RENTAL listings here right now (not sales)? A rising rental-DOM trend means longer vacancies and softer asking-rent achievability than the comps imply.
- What's the recent tenant-quality profile in this submarket — average credit score on applications, eviction rate, late-payment / NSF rate, and stable-employment percentage? A property-management company in the area should have these aggregated.
- How much new for-sale + rental construction is in the pipeline within 1–3 miles? Heavy new supply typically softens prices + rents 12–24 months out; constrained supply supports both.
Investment metrics
- 1% rule
- 0.96% ✗
- Cap rate
- 8.21%
- Cash-on-cash
- 6.84%
- DSCR
- 1.30
- GRM
- 8.7
CMA / ARV
- ARV (median comp)
- $249,900
- List price
- $149,000
- Delta
- -40.38%
- Verdict
- UNDERPRICED
- Comps
- 9 within 1.0 mi
Show comp detail 1 sale within ~0.75 mi
| Address | Dist | Beds/Ba | Sqft | Sold | Price | $/sf | Match |
|---|---|---|---|---|---|---|---|
| 11235 Beverly Jeffries Hwy | 0.68mi | 3/2.0 | 1,340 (-7%) | 12mo | $182,500 | $136 | 46 |
Match score weights: distance 35% · size 25% · config 20% · recency 20%. Top-matched comps best support the ARV.
Projected returns pro-forma
10.0% appreciation · 3.0% rent growth · sell at horizon
- IRR
- 29.2%
- Equity multiple
- 3.31×
- Total profit
- $96,239
- Equity at exit
- $134,231
- IRR
- 25.4%
- Equity multiple
- 7.50×
- Total profit
- $271,356
- Equity at exit
- $289,474
Cash invested: $41,720 (down + closing). Projections, not guarantees.
Landlord ↔ Tenant lean methodology
- Overall (STATE)
- 90 Strongly Landlord-Friendly
- State Alabama
- 90 Strongly Landlord-Friendly · R+15
- County
- — inherits STATE
- City
- — inherits STATE
ZIP-level market 36522
- Home prices YoY
- 11.8%
- Active inventory
- 63
- Price-to-rent
- 8.7×
Monthly cashflow live
- Estimated rent
- $1,423 medium interval (Pro) →
- Mortgage (P&I)
- −$781
- Tax from tax record
- −$43 /mo · $517/yr
- Insurance
- −$62
- HOA
- −$0
- Vacancy / Maint / Mgmt
- −$299
- Net cashflow
- $238
Break-even live
Sensitivity live
| Price | -10% $322 | -5% $280 | +0% $238 | +5% $196 | +10% $154 |
|---|---|---|---|---|---|
| Rent | -10% $126 | -5% $182 | +0% $238 | +5% $294 | +10% $350 |
| Rate | -1.0pp $313 | -0.5pp $276 | base $238 | +0.5pp $199 | +1.0pp $160 |
UW: 25.0% down · 7.5% · 30yr · 1.5% tax · 5.0% vac · 8.0% maint · 8.0% mgmt
Financing live
Cash to close
- Down payment
- $37,250
- Closing costs
- $4,470
- Reserves months
- —
- Total cash needed
- —
Loan-product check · same deal, 3 products live
Conventional
25% down · 7.5% · 30yr
- Down + closing
- —
- Monthly P&I
- —
- Monthly cashflow
- —
- DSCR
- —
- Eligible?
- —
Personal DTI + credit; lowest rate.
DSCR
20% down · 8.5% · 30yr
- Down + closing
- —
- Monthly P&I
- —
- Monthly cashflow
- —
- DSCR
- —
- Eligible?
- —
No personal income docs; deal must DSCR.
Hard money
10% down · 12.0% · 12mo
- Down + closing
- —
- Monthly P&I
- —
- Monthly cashflow
- —
- DSCR
- —
- Eligible?
- —
Short-term bridge; refi at stabilization.
Listing history 5 events
-
2026-05-05status Pending 853-char remark
-
2026-04-29price $149,000 853-char remark
-
2026-04-27status Active 853-char remark
-
2026-04-25historical 853-char remark
-
2026-04-24$170,000 Active 853-char remark
ⓘ Source: listings_history table (triggers on properties + properties_extension) + one-shot
backfill from property_details.listing_events for pre-trigger history.
Tax reassessment forecast AL · Resets to sale price
- Current annual tax
- $517 · $43/mo
- Projected year-2 tax
- $611 · $51/mo
- Expected delta
- +$94/yr (+$8/mo · 18.2%)
ⓘ Screening estimate from a state-policy table — verify with the county assessor before closing.
Climate risk First Street
- Flood 1/10 Low FEMA zone X (unshaded) · 0% chance over 30 yrs
- Wildfire 6/10 Major
- Heat 8/10 Severe 7 d/yr ≥107°F today · 20 d/yr by 30 yrs out
- Wind 9/10 Extreme 99% chance of damaging wind over 30 yrs
- Air quality 1/10 Low 0 unhealthy d/yr today · 0 by 30 yrs out
Nearby sold comps map
Loading sold comps map…
Walkable amenities ~0.75 mi
Loading nearby amenities…
Taxation est. · year 1
- Rental income
- $17,081
- − Mortgage interest
- −$8,346
- − Property taxes
- −$517
- − Insurance
- −$745
- − Repairs & maintenance
- −$1,366
- − Management
- −$1,366
- − Depreciation
- −$4,335
- Taxable income
- $405
- Est. tax owed @ 24.0%
- −$97
- After-tax cash flow
- $2,758/yr
For passive investors: Depreciation is non-cash, so a rental often shows a tax loss while cash-flowing — sheltering income. Rental losses are passive: they offset passive income freely, and up to $25,000/yr can offset ordinary (W-2) income if you actively participate and your MAGI is under $100k (phasing out to $0 by $150k); unused losses carry forward. On sale, claimed depreciation is recaptured at up to 25%, and gains may owe capital-gains tax (a 1031 exchange can defer both). Figures are a year-1 estimate at your 24.0% rate — not tax advice; consult a CPA.
Schools (NCES district)
- District
- Mobile County
- NCES district ID
- 0102370
- Math proficiency
- 15% ▼ -28.00%
- Reading proficiency
- 39% ▬ 0.00%
- Median HH income
- $42,455
- Composite
- 22.9/100
- National rank
- #8002
- State rank
- #81 of 129 in AL
Livability — Citronelle
- Score
- 61/100
- State rank
- #254
- US rank
- #17928
Category grades
Schools grade is shown separately in the Schools card above.
Census & demographics
- Census place
- Citronelle, AL
- City population
- 6,892
- Population (ZIP)
- 6,892
Population outlook (Mobile County) Hauer SSP2
- Today (2025)
- 415,303 people
- By 2030
- 411,755 · -0.9%
- By 2040
- 399,670 · -3.8%
- By 2050
- 382,616 · -7.9%
- By 2075
- 337,353 · -18.8%
- By 2100
- 283,391 · -31.8%
Race, ethnicity, and origin ACS 2023
- Neighborhood character
- Predominantly White (69%)
- Race & ethnicity
- White 69% Black 18% Two or more races 7%
- Common ancestry
- Slovak 3% Lithuanian 3% Italian 2%
- Foreign-born
- 1%
- Languages at home
- 98% English-only · Other Indo-European 1%
Political lean MEDSL · Mobile
- 2024 margin
- R (+16.4) · D 41.3% · R 57.7%
- 2008→2024 swing
- -7.7pp toward R · 2008: -8.7pp · 2024: -16.4pp
- All cycles
- 2024: R+16.4 2020: R+11.9 2016: R+13.9 2012: R+9.3 2008: R+8.7
Not yet ingested
- Civics
- —
Market trends
- HPI YoY
- ▲ 27.55%
- Current HPI
- 260.4914
- Rent YoY
- —
- Metro
- —
- State GDP YoY
- ▲ 2.94%
- F500 in state
- 4
Industry mix (Fortune 500 HQ in AL)
| Industry | F500 HQs | Revenue |
|---|---|---|
| Financial Services | 1 | $8B |
|
||
| Healthcare | 1 | $5B |
|
||
Price history
-12.4% since first listed5 events — show timeline
- 2026-05-05 Pending — GCMLS AL
- 2026-04-29 Price Changed $149,000 GCMLS AL
- 2026-04-27 Relisted — GCMLS AL
- 2026-04-25 Delisted — GCMLS AL
- 2026-04-24 Listed $170,000 GCMLS AL
Property tax history
+0.1%/yrLatest (2025): $517 · +6.3% YoY. Source: county tax records.
Cash-flow waterfall
monthlySold comps — $/sqft
last 12 mo · ≤1 miLoading sold comps…