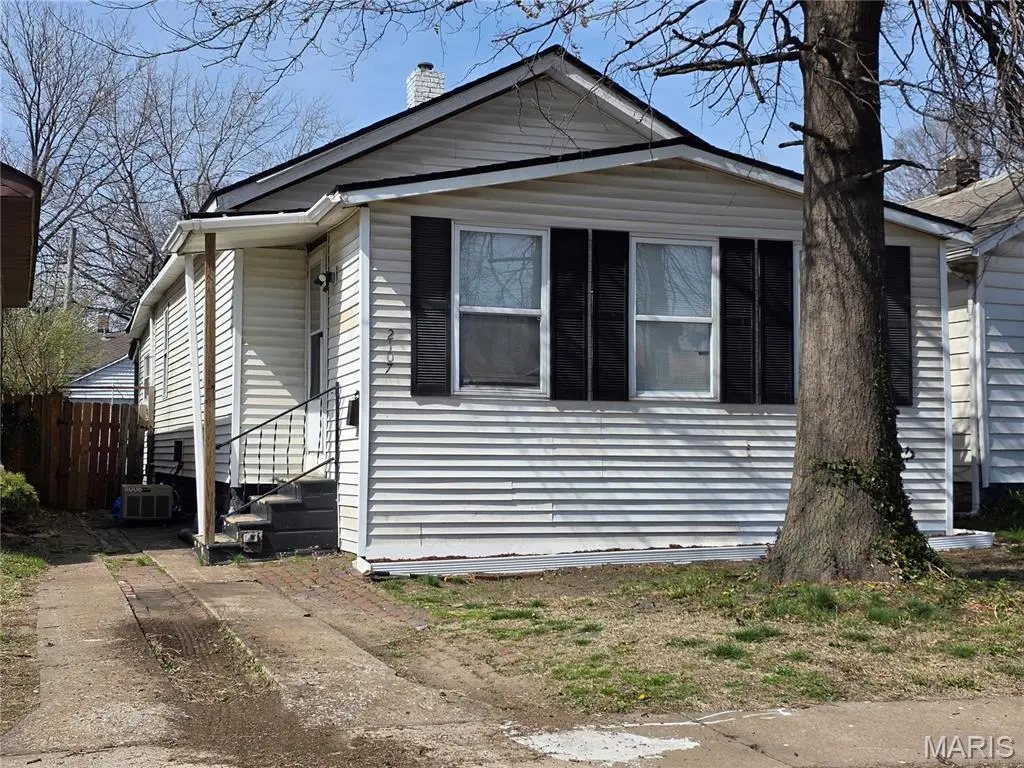
2107 Monroe St · Granite City, IL
Flood risk 1/10 · Minimal
- FEMA flood zone
- X
- Chance of flooding over 30 yrs
- 0.0%
- Est. flood insurance / yr
- $473 – $860
Fire risk 1/10 · Minimal
- Est. fire insurance / yr
- $804 – $1,492
Heat risk 6/10 · Moderate
- Hot days now (above 108°F)
- 7 days/yr
- Hot days in 30 yrs
- 21 days/yr
Wind risk 2/10 · Minimal
- Chance of severe wind over 30 yrs
- 1.0%
Air-quality risk 4/10 · Minor
- Unhealthy air days now
- 4 days/yr
- Unhealthy air days in 30 yrs
- 5 days/yr
Risk factors via First Street. Map © Google.
Why this score? — see what drove the B grade
The composite is a weighted blend of 9 inputs, each scored 0–100. Each bar is that input's sub-score; the figure is the points it added to the 100-point composite (weight × sub-score).
- Cash flow +30.0/30.0
- ARV discount +11.0/15.0
- DSCR +10.0/10.0
- 1% rule +9.8/10.0
- Livability +3.2/5.0
- Rent growth +2.9/5.0
- Condition / age +2.5/5.0
- Schools +0.9/10.0
- Appreciation +0.0/10.0
$86,500
🖨 Deal sheet (PDF) 📄 Offer letter ✓ Due diligence
Listing remarks
Discover this beautifully renovated 3-bedroom, 1-bath home, perfect for modern living with stylish updates and a spacious layout. This home offers a blend of comfort and convenience for first-time buyers, small families, or those looking to downsize. Inside, you'll find luxury vinyl plank flooring throughout, giving a warm, cohesive look to each room. The open living and dining area flows into a well-appointed kitchen with included appliances, just move right in and enjoy! The home has been fully upgraded with new plumbing and electrical systems for added peace of mind. Step outside to a large, fenced backyard, ideal for pets, gardening, or simply relaxing. Also a detached garage. The expan
Key facts
- 3,750 sq ft lot
- Garage
- Built 1917
Neighborhood map
What this means for you Summary
Snapshot
- This is a 3-bed/1.0-bath single-family listed at $86k.
Deal economics
- At list price, monthly cash flow is $464 ($6k/yr) — positive.
- The deal already cash-flows at list — no discount required.
- Meets the 1% rule at list price ($1k rent vs $86k).
- Recommended offer: $84k (3.0% below list) — sets the bar for market timing.
- Cap rate 12.7% vs local median 7.0% in Granite City — top-decile yield for the area; either an underpriced asset or a hidden risk that comps aren't pricing in. Stress-test before assuming the spread holds.
Location & tenants
- Location reads 65/100 on livability (#623 in IL) — a middle-class / working-renter tenant base. Strengths: cost of living A+, housing A+; Watch: crime F, amenities F, commute F.
- Granite City CUSD 9 (suburban): math 9% / reading 11% proficiency, ranked #570 of 620 in IL (top 92%) — low school quality limits family demand, transient renter base, plan for 1-2y turnover.
- Zoned schools: Granite City High School (math 10% / reading 12%, grade F, #522 of 693 statewide, top 76%, 1,805 students, 0% FRL) — zoned schools average 0% FRL vs 59% district-wide (59 pts lower); this property's tenant base skews higher-income than the district average.
- Market conditions: Rents rising (+1.7%/yr); 191 active listings in the ZIP; 6 comparable units currently listed for rent nearby; rentals at typical pace (median 16d on market — plan ~3-4 weeks tenant-placement turnaround); 336 units permitted in Madison County in 2024 (0 in 5+ unit buildings).
Forward outlook
- Local home prices are declining (-3.0%/yr); year-one equity from $598 of loan paydown is wiped out by about $3k of value loss. Plan a longer hold.
- Madison County population projected at -18% by 2050 — secular population decline; favor cash flow + early exit over multi-decade hold.
- At projected returns (-3.0% appreciation + 1.7% rent growth), your $24k cash investment doubles in ~6 years — after that, you're playing with house money.
Negotiation context
- It's been on market 42 days — a 3% lower offer ($84k) is reasonable based on typical stale-listing flexibility.
- Current owner paid $19k; list at $86k implies a 355% gain — meaningful room to come down on a strong offer.
Risks & watch-outs
- Watch-outs: built in 1917 — expect roof / HVAC / electrical / plumbing capex.
- Climate carrying-cost: extreme-heat days projected 7→21/yr by 2055 (HVAC capex compounding) — expect insurance premiums to compound above CPI over the hold.
Questions for the listing agent
- It's been on market 42 days. Have you received any prior offers? Is the seller open to a 3% concession, seller financing, or rate buy-down credit?
- Built in 1917 — when were the roof, HVAC, electrical panel, plumbing, and water heater last replaced?
- Is there a deadline driving the sale (1031 exchange, divorce, estate, relocation)? That informs how much negotiation room exists.
- Schools are F-rated, which usually means shorter tenancies and higher turnover. Who's the typical renter profile here, and what's been the actual vacancy rate?
- Crime grade is F in this area — have there been break-ins, vandalism, or insurance claims at this property in the last 3 years? What carrier currently insures it and at what premium?
- What's the average days-on-market for RENTAL listings here right now (not sales)? A rising rental-DOM trend means longer vacancies and softer asking-rent achievability than the comps imply.
- What's the recent tenant-quality profile in this submarket — average credit score on applications, eviction rate, late-payment / NSF rate, and stable-employment percentage? A property-management company in the area should have these aggregated.
- How much new for-sale + rental construction is in the pipeline within 1–3 miles? Heavy new supply typically softens prices + rents 12–24 months out; constrained supply supports both.
Investment metrics
- 1% rule
- 1.48% ✓
- Cap rate
- 12.73%
- Cash-on-cash
- 23.00%
- DSCR
- 2.02
- GRM
- 5.6
CMA / ARV
- ARV (on-the-fly)
- $93,852
- Comps found
- 12
Show comp detail 12 sales within ~0.75 mi
| Address | Dist | Beds/Ba | Sqft | Sold | Price | $/sf | Match |
|---|---|---|---|---|---|---|---|
| 2254 Lee Ave | 0.27mi | 3/2.0 | 1,053 (+11%) | 5mo | $35,000 | $33 | 61 |
| 2246 Edison Ave | 0.48mi | 2/1.0 (-1) | 912 (-4%) | 7mo | $95,000 | $104 | 60 |
| 2428 Iowa St | 0.54mi | 2/1.0 (-1) | 912 (-4%) | 5mo | $90,000 | $99 | 59 |
| 2323 Edison Ave | 0.58mi | 3/1.0 | 1,050 (+11%) | 0mo | $99,900 | $95 | 55 |
| 2440 Iowa St | 0.56mi | 3/1.0 | 1,052 (+11%) | 3mo | $59,900 | $57 | 53 |
| 2425 State St | 0.64mi | 2/1.0 (-1) | 972 (+2%) | 10mo | $110,000 | $113 | 52 |
| 2311 E 25th St | 0.68mi | 2/2.0 (-1) | 896 (-6%) | 2mo | $99,000 | $110 | 49 |
| 2339 Lincoln Ave | 0.61mi | 2/1.0 (-1) | 892 (-6%) | 10mo | $98,000 | $110 | 49 |
| 2300 Edwards St | 0.59mi | 2/2.0 (-1) | 1,026 (+8%) | 2mo | $99,900 | $97 | 48 |
| 2306 Benton St | 0.68mi | 2/1.5 (-1) | 888 (-6%) | 5mo | $107,000 | $120 | 46 |
| 2424 Grand Ave | 0.61mi | 2/1.0 (-1) | 1,034 (+9%) | 9mo | $90,000 | $87 | 44 |
| 1406 Rhodes St | 0.68mi | 2/1.0 (-1) | 1,056 (+11%) | 10mo | $12,000 | $11 | 36 |
Match score weights: distance 35% · size 25% · config 20% · recency 20%. Top-matched comps best support the ARV.
Projected returns pro-forma
-3.0% appreciation · 1.67% rent growth · sell at horizon
- IRR
- 14.5%
- Equity multiple
- 1.57×
- Total profit
- $13,845
- Equity at exit
- $12,897
- IRR
- 22.3%
- Equity multiple
- 2.79×
- Total profit
- $43,331
- Equity at exit
- $7,479
Cash invested: $24,220 (down + closing). Projections, not guarantees.
Landlord ↔ Tenant lean methodology
- Overall (STATE)
- 43 Moderately Tenant-Leaning
- State Illinois
- 43 Moderately Tenant-Leaning · D+7
- County
- — inherits STATE
- City
- — inherits STATE
ZIP-level market 62040
- Home prices YoY
- -21.8%
- Rents YoY
- 1.7%
- Active inventory
- 191
- Price-to-rent
- 5.6×
Monthly cashflow live
- Estimated rent
- $1,276 high interval (Pro) →
- Mortgage (P&I)
- −$454
- Tax from tax record
- −$54 /mo · $651/yr
- Insurance
- −$36
- HOA
- −$0
- Vacancy / Maint / Mgmt
- −$268
- Net cashflow
- $464
Break-even live
Sensitivity live
| Price | -10% $513 | -5% $489 | +0% $464 | +5% $440 | +10% $415 |
|---|---|---|---|---|---|
| Rent | -10% $363 | -5% $414 | +0% $464 | +5% $515 | +10% $565 |
| Rate | -1.0pp $508 | -0.5pp $486 | base $464 | +0.5pp $442 | +1.0pp $419 |
UW: 25.0% down · 7.5% · 30yr · 1.5% tax · 5.0% vac · 8.0% maint · 8.0% mgmt
Financing live
Cash to close
- Down payment
- $21,625
- Closing costs
- $2,595
- Reserves months
- —
- Total cash needed
- —
Loan-product check · same deal, 3 products live
Conventional
25% down · 7.5% · 30yr
- Down + closing
- —
- Monthly P&I
- —
- Monthly cashflow
- —
- DSCR
- —
- Eligible?
- —
Personal DTI + credit; lowest rate.
DSCR
20% down · 8.5% · 30yr
- Down + closing
- —
- Monthly P&I
- —
- Monthly cashflow
- —
- DSCR
- —
- Eligible?
- —
No personal income docs; deal must DSCR.
Hard money
10% down · 12.0% · 12mo
- Down + closing
- —
- Monthly P&I
- —
- Monthly cashflow
- —
- DSCR
- —
- Eligible?
- —
Short-term bridge; refi at stabilization.
Rent comps 6 comps
| Address | Beds | Baths | Sqft | Rent | $/sqft | DOM | Units | Dist |
|---|---|---|---|---|---|---|---|---|
| 2317 Grand Ave Granite City, IL | 2.0 | 1.0 | 1124 | $750 | $0.67 | 8d | 1 | 0.47mi |
| 2450 Cleveland Blvd Apt A Granite City, IL | 2.0 | 1.0 | 846 | $825 | $0.98 | 19d | 1 | 0.77mi |
| 2415 Jerden Ave Granite City, IL | 3.0 | 1.0 | 970 | $1,400 | $1.44 | 5d | 1 | 0.89mi |
| 2556 Center St Granite City, IL | 3.0 | 1.0 | 874 | $1,500 | $1.72 | 15d | 1 | 1.02mi |
| 2715 Center St Unit B Granite City, IL | 2.0 | 1.0 | 930 | $1,275 | $1.37 | 45d | 1 | 1.29mi |
| 1534 7th St Unit A Madison, IL | 2.0 | 1.0 | 900 | $1,200 | $1.33 | 13d | 1 | 1.31mi |
Listing history 13 events
-
2026-06-21days on market $86,500 Active 42 DOM
-
2026-06-18days on market $86,500 Active 39 DOM
-
2026-06-17days on market $86,500 Active 38 DOM
-
2026-06-16days on market $86,500 Active 37 DOM
-
2026-06-15days on market $86,500 Active 36 DOM
-
2026-06-13days on market $86,500 Active 34 DOM
-
2026-06-13days on market $86,500 Active 33 DOM
-
2026-06-09days on market $86,500 Active 30 DOM
-
2026-06-08status $86,500 Active 29 DOM
-
2026-04-24status Pending
-
2026-03-27$86,500 Active
-
2026-03-24historical $86,500
-
1999-05-14soldstatus $19,000
ⓘ Source: listings_history table (triggers on properties + properties_extension) + one-shot
backfill from property_details.listing_events for pre-trigger history.
Tax reassessment forecast IL · Partial reset (capped growth)
- Current annual tax
- $651 · $54/mo
- Projected year-2 tax
- $1,307 · $109/mo
- Expected delta
- +$656/yr (+$55/mo · 100.8%)
ⓘ Screening estimate from a state-policy table — verify with the county assessor before closing.
Climate risk First Street
- Flood 1/10 Low FEMA zone X · 0% chance over 30 yrs
- Wildfire 1/10 Low
- Heat 6/10 Major 7 d/yr ≥108°F today · 21 d/yr by 30 yrs out
- Wind 2/10 Low 100% chance of damaging wind over 30 yrs
- Air quality 4/10 Moderate 4 unhealthy d/yr today · 5 by 30 yrs out
Nearby sold comps map
Loading sold comps map…
Walkable amenities ~0.75 mi
Loading nearby amenities…
Taxation est. · year 1
- Rental income
- $15,312
- − Mortgage interest
- −$4,845
- − Property taxes
- −$651
- − Insurance
- −$432
- − Repairs & maintenance
- −$1,225
- − Management
- −$1,225
- − Depreciation
- −$2,516
- Taxable income
- $4,417
- Est. tax owed @ 24.0%
- −$1,060
- After-tax cash flow
- $4,510/yr
For passive investors: Depreciation is non-cash, so a rental often shows a tax loss while cash-flowing — sheltering income. Rental losses are passive: they offset passive income freely, and up to $25,000/yr can offset ordinary (W-2) income if you actively participate and your MAGI is under $100k (phasing out to $0 by $150k); unused losses carry forward. On sale, claimed depreciation is recaptured at up to 25%, and gains may owe capital-gains tax (a 1031 exchange can defer both). Figures are a year-1 estimate at your 24.0% rate — not tax advice; consult a CPA.
Schools (NCES district)
- District
- Granite City CUSD 9
- NCES district ID
- 1717280
- Math proficiency
- 9% ▼ -4.00%
- Reading proficiency
- 11% ▼ -7.00%
- Median HH income
- $45,082
- Composite
- 9.15/100
- National rank
- #9864
- State rank
- #570 of 620 in IL
Livability — Granite City
- Score
- 65/100
- State rank
- #623
- US rank
- #12751
Category grades
Schools grade is shown separately in the Schools card above.
Census & demographics
- Census place
- Granite City, IL
- County
- Madison County · 189,064 people
- City population
- 40,404
- Metro
- St. Louis, MO-IL
- Population (ZIP)
- 40,404
- Household income
- $60,031
- Rent vs Own
- Severe rent burden
- 923.0
Population outlook (Madison County) Hauer SSP2
- Today (2025)
- 258,371 people
- By 2030
- 251,523 · -2.7%
- By 2040
- 233,640 · -9.6%
- By 2050
- 213,042 · -17.5%
- By 2075
- 165,255 · -36.0%
- By 2100
- 123,953 · -52.0%
Race, ethnicity, and origin ACS 2023
- Neighborhood character
- Predominantly White (76%)
- Race & ethnicity
- White 76% Hispanic / Latino 9% Black 9% Two or more races 7% Asian 1%
- Hispanic origin (detail)
- Mexican 7%
- Common ancestry
- Romanian 2% Lithuanian 2% Serbian 2%
- Foreign-born
- 3% · Canada, Vietnam
- Languages at home
- 93% English-only · Spanish 5%
Political lean MEDSL · Madison
- 2024 margin
- R (+13.3) · D 42.5% · R 55.8% · Other 1.8%
- 2008→2024 swing
- -22.5pp toward R · 2008: 9.2pp · 2024: -13.3pp
- All cycles
- 2024: R+13.3 2020: R+13.2 2016: R+15.6 2012: R+1.4 2008: D+9.2
Not yet ingested
- Civics
- —
Market trends
- HPI YoY
- ▼ -56.88%
- Current HPI
- 204.4612
- Rent YoY
- ▲ 1.67%
- Metro
- St. Louis, MO-IL
- State GDP YoY
- ▲ 1.59%
- F500 in state
- 60
Industry mix (Fortune 500 HQ in IL)
| Industry | F500 HQs | Revenue |
|---|---|---|
| Insurance | 4 | $201B |
|
||
| Consumer Goods | 4 | $87B |
|
||
| Industrial Machinery | 3 | $64B |
|
||
| Healthcare | 2 | $55B |
|
||
| Retail / Pharmacy | 1 | $148B |
|
||
| Agriculture / Food | 1 | $86B |
|
||
Price history
+355.3% since first listed4 events — show timeline
- 2026-04-24 Pending — MARIS as Distributed by MLS Grid
- 2026-03-27 Listed $86,500 MARIS as Distributed by MLS Grid
- 2026-03-24 Coming Soon $86,500 MARIS as Distributed by MLS Grid
- 1999-05-14 Sold (Public Records) $19,000 Public Records
Property tax history
+2.4%/yrLatest (2024): $651 · +1.6% YoY. Source: county tax records.
Cash-flow waterfall
monthlySold comps — $/sqft
last 12 mo · ≤1 miLoading sold comps…