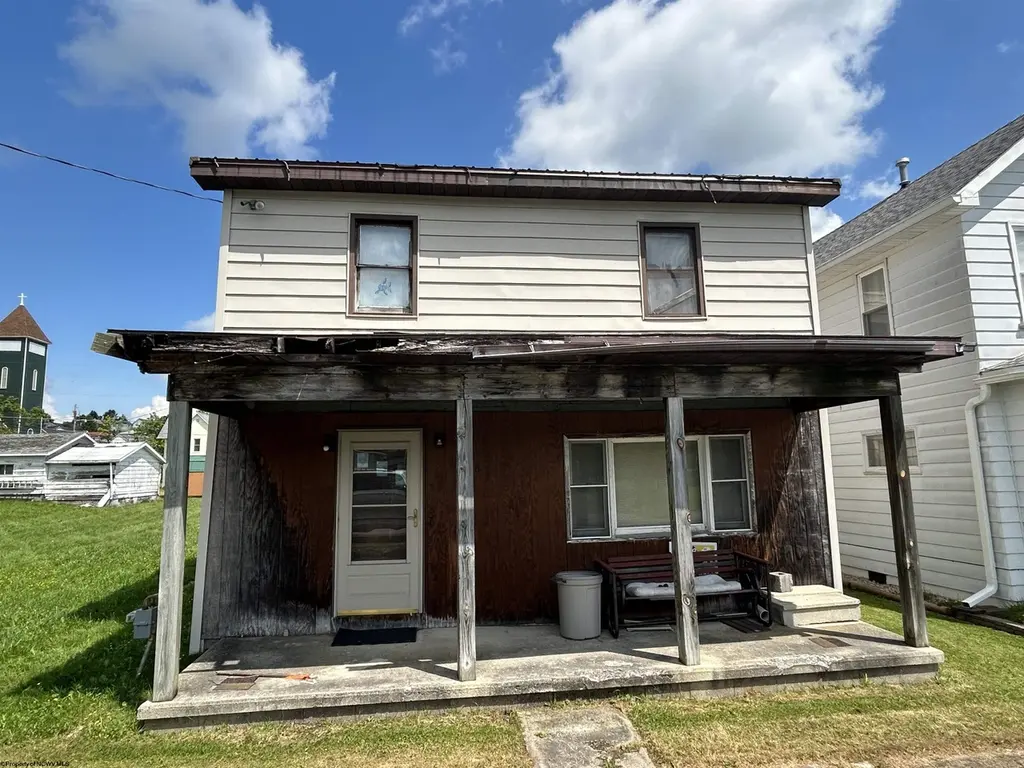
268 Henry Ave · Davis, WV
Flood risk 1/10 · Minimal
- FEMA flood zone
- X (unshaded)
- Chance of flooding over 30 yrs
- 0.0%
- Est. flood insurance / yr
- $507 – $1,088
Fire risk 1/10 · Minimal
- Est. fire insurance / yr
- $787 – $1,461
Heat risk 1/10 · Minimal
- Hot days now (above 84°F)
- 8 days/yr
- Hot days in 30 yrs
- 22 days/yr
Wind risk 2/10 · Minimal
- Chance of severe wind over 30 yrs
- —
Air-quality risk 1/10 · Minimal
- Unhealthy air days now
- 0 days/yr
- Unhealthy air days in 30 yrs
- 0 days/yr
Risk factors via First Street. Map © Google.
Why this score? — see what drove the B grade
The composite is a weighted blend of 9 inputs, each scored 0–100. Each bar is that input's sub-score; the figure is the points it added to the 100-point composite (weight × sub-score).
- Cash flow +29.3/30.0
- DSCR +10.0/10.0
- 1% rule +8.2/10.0
- ARV discount +7.5/15.0
- Appreciation +5.0/10.0
- Livability +3.8/5.0
- Rent growth +2.5/5.0
- Schools +2.3/10.0
- Condition / age +2.2/5.0
$100,000
🖨 Deal sheet 📄 Offer letter ✓ Due diligence
Listing remarks
Located in the heart of Davis, this in-town home is being sold AS IS and is in need of repairs and updates throughout. The property offers solid potential for a renovation or full restoration project. Level back yard with outbuilding.
Key facts
- Outbuilding
- Level back yard
- Built 1900
Tags
Property features AI
Finance
- Financial info: Tax annual amount reported
Exterior
- Parking: On-street parking
- Utilities: Public water; Public sewer; Cable available
- Home design: Single family detached residence; 2 stories
- Construction: Aluminum siding; Frame construction; Wood siding; Metal roof; Shingle roof
- Exterior features: Level lot
Interior
- Kitchen: Dishwasher; Range; Microwave; Refrigerator
- Bedrooms: Total rooms: 8
- Flooring: Ceramic tile; Laminate; Tile; Wood
- Bathrooms: 2 full bathrooms
- Heating & cooling: Natural gas heating
- Interior features: Dishwasher; Dryer; Refrigerator; Microwave; Range; Washer; Balcony
- Laundry & utility: Washer; Dryer
Neighborhood map
What this means for you Summary
Snapshot
- This is a 4-bed/2.0-bath single-family listed at $100k. Condition is rated fair.
Deal economics
- At list price, monthly cash flow is $353 ($4k/yr) — positive.
- The deal already cash-flows at list — no discount required.
- Meets the 1% rule at list price ($1k rent vs $100k).
- Recommended offer: $98k (1.5% below list) — sets the bar for market timing.
- Cap rate 10.5% vs local median 0.5% in Davis — top-decile yield for the area; either an underpriced asset or a hidden risk that comps aren't pricing in. Stress-test before assuming the spread holds.
Location & tenants
- Location reads 75/100 on livability (#27 in WV, #4,035 nationally) — a middle-class / working-renter tenant base. Strengths: cost of living A+, housing A+, health & safety A+; Watch: employment D, amenities F, commute F.
- Tucker County Schools (rural): math 20% / reading 36% proficiency, ranked #40 of 55 in WV (top 73%) — low school quality limits family demand, transient renter base, plan for 1-2y turnover.
- Zoned schools: Davis Thomas Elementary Middle School (math 32% / reading 37%, grade F, #148 of 377 statewide, top 49%, 205 students, 0% FRL); Tucker County High School (math 17% / reading 52%, grade F, #42 of 110 statewide, top 47%, 293 students, 0% FRL) — zoned schools average 0% FRL vs 47% district-wide (47 pts lower); this property's tenant base skews higher-income than the district average.
- Market conditions: 88 active listings in the ZIP; 3 units permitted in Tucker County in 2024 (0 in 5+ unit buildings).
Forward outlook
- In year one you build about $4k of equity ($691 loan paydown + $3k appreciation (3.0% local appreciation)).
- Tucker County population projected at -18% by 2050 — secular population decline; favor cash flow + early exit over multi-decade hold.
- At projected returns (3.0% appreciation + 3.0% rent growth), your $28k cash investment doubles in ~4 years — after that, you're playing with house money.
- By year 9, paydown + projected appreciation supports a ~$31k cash-out refi (75% LTV) — recoverable capital for the next deal without selling this one.
Negotiation context
- It's been on market 29 days — a 2% lower offer ($98k) is reasonable based on typical stale-listing flexibility.
Risks & watch-outs
- Watch-outs: built in 1900 — expect roof / HVAC / electrical / plumbing capex.
Questions for the listing agent
- Have any recent inspections been done? Can we get a copy of the seller's disclosures and any deferred-maintenance estimates?
- Built in 1900 — when were the roof, HVAC, electrical panel, plumbing, and water heater last replaced?
- Is there a deadline driving the sale (1031 exchange, divorce, estate, relocation)? That informs how much negotiation room exists.
- Schools are F-rated, which usually means shorter tenancies and higher turnover. Who's the typical renter profile here, and what's been the actual vacancy rate?
- What's the average days-on-market for RENTAL listings here right now (not sales)? A rising rental-DOM trend means longer vacancies and softer asking-rent achievability than the comps imply.
- What's the recent tenant-quality profile in this submarket — average credit score on applications, eviction rate, late-payment / NSF rate, and stable-employment percentage? A property-management company in the area should have these aggregated.
- How much new for-sale + rental construction is in the pipeline within 1–3 miles? Heavy new supply typically softens prices + rents 12–24 months out; constrained supply supports both.
Investment metrics
- 1% rule
- 1.32% ✓
- Cap rate
- 10.52%
- Cash-on-cash
- 15.11%
- DSCR
- 1.67
- GRM
- 6.3
CMA / ARV
- ARV (on-the-fly)
- $266,220
- Comps found
- 7
Show comp detail 7 sales within ~0.75 mi
| Address | Dist | Beds/Ba | Sqft | Sold | Price | $/sf | Match |
|---|---|---|---|---|---|---|---|
| 336 Fifth St | 0.20mi | 3/2.0 (-1) | 1,600 (-8%) | 1mo | $388,000 | $243 | 71 |
| 367 Thomas | 0.14mi | 3/2.0 (-1) | 1,886 (+8%) | 9mo | $288,400 | $153 | 67 |
| 627 Henry Ave | 0.30mi | 3/1.5 (-1) | 1,850 (+6%) | 10mo | $211,000 | $114 | 60 |
| 261 Kent Ave | 0.11mi | 4/2.0 | 1,978 (+14%) | 18mo | $135,000 | $68 | 58 |
| 252 Venice Pl | 0.62mi | 3/2.0 (-1) | 1,632 (-6%) | 5mo | $475,000 | $291 | 52 |
| 475 William Ave | 0.25mi | 4/2.0 | 1,520 (-13%) | 24mo | $325,000 | $214 | 48 |
| 578 Kent Ave | 0.31mi | 4/2.0 | 1,988 (+14%) | 21mo | $172,500 | $87 | 45 |
Match score weights: distance 35% · size 25% · config 20% · recency 20%. Top-matched comps best support the ARV.
Projected returns pro-forma
3.0% appreciation · 3.0% rent growth · sell at horizon
- IRR
- 21.7%
- Equity multiple
- 2.23×
- Total profit
- $34,524
- Equity at exit
- $44,964
- IRR
- 22.7%
- Equity multiple
- 4.27×
- Total profit
- $91,471
- Equity at exit
- $69,295
Cash invested: $28,000 (down + closing). Projections, not guarantees.
Landlord ↔ Tenant lean methodology
- Overall (STATE)
- 83 Strongly Landlord-Friendly
- State West Virginia
- 83 Strongly Landlord-Friendly · R+22
- County
- — inherits STATE
- City
- — inherits STATE
ZIP-level market 26260
- Active inventory
- 88
- Price-to-rent
- 6.3×
Monthly cashflow live
- Estimated rent
- $1,321 medium interval (Pro) →
- Mortgage (P&I)
- −$524
- Tax est. 1.5%
- −$125 /mo · $1,500/yr
- Insurance
- −$42
- HOA
- −$0
- Vacancy / Maint / Mgmt
- −$277
- Net cashflow
- $353
Break-even live
UW: 25.0% down · 7.5% · 30yr · 1.5% tax · 5.0% vac · 8.0% maint · 8.0% mgmt
Financing live
Cash to close
- Down payment
- $25,000
- Closing costs
- $3,000
- Reserves months
- —
- Total cash needed
- —
Loan-product check · same deal, 3 products live
Conventional
25% down · 7.5% · 30yr
- Down + closing
- —
- Monthly P&I
- —
- Monthly cashflow
- —
- DSCR
- —
- Eligible?
- —
Personal DTI + credit; lowest rate.
DSCR
20% down · 8.5% · 30yr
- Down + closing
- —
- Monthly P&I
- —
- Monthly cashflow
- —
- DSCR
- —
- Eligible?
- —
No personal income docs; deal must DSCR.
Hard money
10% down · 12.0% · 12mo
- Down + closing
- —
- Monthly P&I
- —
- Monthly cashflow
- —
- DSCR
- —
- Eligible?
- —
Short-term bridge; refi at stabilization.
Listing history 17 events
-
2026-06-18days on market $100,000 Active 29 DOM
-
2026-06-17days on market $100,000 Active 28 DOM
-
2026-06-16days on market $100,000 Active 27 DOM
-
2026-06-15days on market $100,000 Active 26 DOM
-
2026-06-15days on market $100,000 Active 25 DOM
-
2026-06-13days on market $100,000 Active 24 DOM
-
2026-06-12days on market $100,000 Active 23 DOM
-
2026-06-09days on market $100,000 Active 20 DOM
-
2026-06-08days on market $100,000 Active 19 DOM
-
2026-06-08days on market $100,000 Active 18 DOM
-
2026-06-07days on market $100,000 Active 17 DOM
-
2026-06-04days on market $100,000 Active 15 DOM
-
2026-06-03days on market $100,000 Active 14 DOM
-
2026-06-02days on market $100,000 Active 13 DOM
-
2026-06-01days on market $100,000 Active 12 DOM
-
2026-05-31days on market $100,000 Active 11 DOM
-
2026-05-20$100,000 Active
ⓘ Source: listings_history table (triggers on properties + properties_extension) + one-shot
backfill from property_details.listing_events for pre-trigger history.
Climate risk First Street
- Flood 1/10 Low FEMA zone X (unshaded) · 0% chance over 30 yrs
- Wildfire 1/10 Low
- Heat 1/10 Low 8 d/yr ≥84°F today · 22 d/yr by 30 yrs out
- Wind 2/10 Low
- Air quality 1/10 Low 0 unhealthy d/yr today · 0 by 30 yrs out
Nearby sold comps map
Loading sold comps map…
Walkable amenities ~0.75 mi
Loading nearby amenities…
Taxation est. · year 1
- Rental income
- $15,853
- − Mortgage interest
- −$5,602
- − Property taxes
- −$1,500
- − Insurance
- −$500
- − Repairs & maintenance
- −$1,268
- − Management
- −$1,268
- − Depreciation
- −$2,909
- Taxable income
- $2,806
- Est. tax owed @ 24.0%
- −$673
- After-tax cash flow
- $3,558/yr
For passive investors: Depreciation is non-cash, so a rental often shows a tax loss while cash-flowing — sheltering income. Rental losses are passive: they offset passive income freely, and up to $25,000/yr can offset ordinary (W-2) income if you actively participate and your MAGI is under $100k (phasing out to $0 by $150k); unused losses carry forward. On sale, claimed depreciation is recaptured at up to 25%, and gains may owe capital-gains tax (a 1031 exchange can defer both). Figures are a year-1 estimate at your 24.0% rate — not tax advice; consult a CPA.
Condition & rehab AI · 10 photos
This home requires moderate renovations to bring it up to current standards, with a focus on the kitchen and bathroom. A fresh exterior and HVAC system would also significantly enhance its value.
Repairs flagged
- Major kitchen cabinets — dated and in poor condition
- Major bathroom fixtures — barely functional and unfinished
- Major exterior siding — weathered and in poor condition
- Minor HVAC system — no visible issues
Value-add opportunities
- Both kitchen renovation — modernizing the kitchen can significantly increase both resale and rental value
- Both bathroom renovation — upgrading the bathroom can significantly increase both resale and rental value
- Both exterior siding and paint — a fresh exterior can greatly enhance curb appeal and value
- Both HVAC system replacement — a new HVAC system can improve comfort and energy efficiency, increasing both resale and rental value
Renovation cost estimate screening
| Repair item | Severity | Est. cost |
|---|---|---|
| kitchen cabinets · dated and in poor condition | Major | $15,000–50,000 |
| bathroom fixtures · barely functional and unfinished | Major | $15,000–50,000 |
| exterior siding · weathered and in poor condition | Major | $15,000–50,000 |
| HVAC system · no visible issues | Minor | $500–3,000 |
| Total estimated repair cost · 4 items | $45,500–153,000 |
Value-add ROI direction
- Both kitchen renovation — modernizing the kitchen can significantly increase both resale and rental value ↑
- Both bathroom renovation — upgrading the bathroom can significantly increase both resale and rental value ↑
- Both exterior siding and paint — a fresh exterior can greatly enhance curb appeal and value ↑
- Both HVAC system replacement — a new HVAC system can improve comfort and energy efficiency, increasing both resale and rental value ↑
ⓘ Cost ranges are severity-bucket heuristics (US national rule-of-thumb). Get contractor quotes + a written scope before underwriting a rehab budget.
Schools (NCES district)
- District
- Tucker County Schools
- NCES district ID
- 5401410
- Math proficiency
- 20% ▼ -11.00%
- Reading proficiency
- 36% ▼ -6.00%
- Median HH income
- $38,697
- Composite
- 23.4/100
- National rank
- #7900
- State rank
- #40 of 55 in WV
Livability — Davis
- Score
- 75/100
- State rank
- #27
- US rank
- #4035
Category grades
Schools grade is shown separately in the Schools card above.
Census & demographics
- Census place
- Davis, WV
- Population (ZIP)
- 1,307
Population outlook (Tucker County) Hauer SSP2
- Today (2025)
- 6,675 people
- By 2030
- 6,467 · -3.1%
- By 2040
- 5,973 · -10.5%
- By 2050
- 5,460 · -18.2%
- By 2075
- 4,283 · -35.8%
- By 2100
- 3,171 · -52.5%
Race, ethnicity, and origin ACS 2023
- Neighborhood character
- Predominantly White (97%)
- Race & ethnicity
- White 97% Two or more races 2%
- Common ancestry
- Romanian 3% Lithuanian 2% Serbian 2%
- Languages at home
- 95% English-only · Spanish 3% French/Haitian/Cajun 2% German/W. Germanic 1%
Political lean MEDSL · Tucker
- 2024 margin
- Solid R (+48.9) · D 24.5% · R 73.4% · Other 2.1%
- 2008→2024 swing
- -25.1pp toward R · 2008: -23.8pp · 2024: -48.9pp
- All cycles
- 2024: R+48.9 2020: R+49.5 2016: R+52.2 2012: R+41.2 2008: R+23.8
Not yet ingested
- Civics
- —
Market trends
- HPI YoY
- —
- Current HPI
- —
- Rent YoY
- —
- Metro
- —
- State GDP YoY
- —
- F500 in state
- 0
Price history
1 event — show timeline
- 2026-05-20 Listed $100,000 NCWVREIN
Cash-flow waterfall
monthlySold comps — $/sqft
last 12 mo · ≤1 miLoading sold comps…