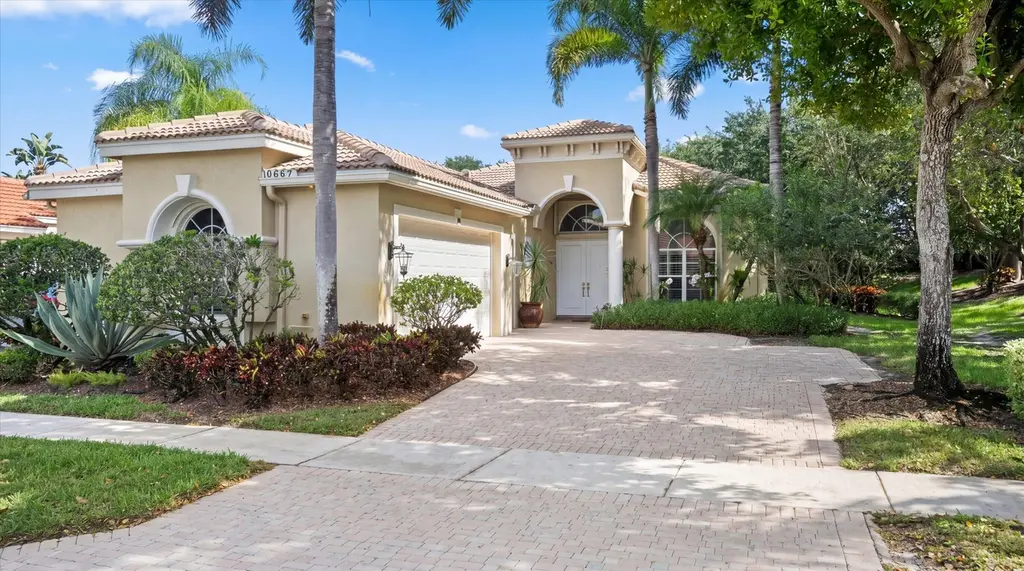
10689 Northgreen Dr · Wellington, FL
Flood risk 3/10 · Minor
- FEMA flood zone
- X (unshaded)
- Chance of flooding over 30 yrs
- 0.2%
- Est. flood insurance / yr
- $507 – $1,088
Fire risk 1/10 · Minimal
- Est. fire insurance / yr
- $947 – $1,759
Heat risk 10/10 · Severe
- Hot days now (above 106°F)
- 7 days/yr
- Hot days in 30 yrs
- 26 days/yr
Wind risk 10/10 · Severe
- Chance of severe wind over 30 yrs
- 99.0%
Air-quality risk 2/10 · Minimal
- Unhealthy air days now
- 0 days/yr
- Unhealthy air days in 30 yrs
- 2 days/yr
Risk factors via First Street. Map © Google.
Why this score? — see what drove the D+ grade
The composite is a weighted blend of 9 inputs, each scored 0–100. Each bar is that input's sub-score; the figure is the points it added to the 100-point composite (weight × sub-score).
- ARV discount +14.6/15.0
- Cash flow +8.2/30.0
- Appreciation +4.7/10.0
- Schools +4.3/10.0
- 1% rule +3.7/10.0
- Livability +3.7/5.0
- Rent growth +2.5/5.0
- Condition / age +2.5/5.0
- DSCR +2.2/10.0
$619,000
🖨 Deal sheet (PDF) 📄 Offer letter ✓ Due diligence
Listing remarks
This is the home you've been waiting for! Popular floor plan offering 3 bedrooms with an extra office/den and 3 full en-suite bathrooms with an extra powder room in Manchester Lakes at Wycliffe Golf & Country Club. Well-maintained 2,941 sq ft residence featuring high ceilings, an open layout, spacious kitchen, freshly painted interior, and new flooring in the bedrooms. Enjoy added privacy with no neighbors on one side and a private backyard from the screened-in patio. Newer roof, A/C, and water heater add peace of mind. Conveniently located near the community pool. This home is located within Wycliffe Golf & Country Club, a private country club community offering an exceptional
Key facts
- Community pool
- Private backyard
- Newer roof
Tags
Property features AI
Finance
- Financial info: Pets allowed (restrictions possible)
- HOA & community: Community amenities include clubhouse, fitness center, jogging path, tennis courts, pickleball courts, business center, cafe/restaurant, street lights, management and on-site manager; HOA charges apply (paid quarterly); HOA fees include cable TV, grounds maintenance, security, common area upkeep, and common real estate tax
Exterior
- Parking: Attached garage (about 2.5 spaces, covered)
- Security: Gated community with guard; Security patrol
- Utilities: Public water; Public sewer; Three-phase electric; Cable available
- Home design: Single-family residence; Multi/split levels; One story; Entry-level living area; Faces south
- Construction: Built with CBS construction materials; Spanish tile roof
- Exterior features: Covered patio; Screened patio; Patio; Not waterfront; Private maintained road
Interior
- Kitchen: Disposal; Dishwasher; Electric range; Microwave
- Bedrooms: Three main-level bedrooms
- Flooring: Ceramic tile; Tile; Vinyl
- Bathrooms: Three full bathrooms and one half bathroom (four total)
- Heating & cooling: Central electric heating; Central electric cooling
- Interior features: Entrance foyer; High ceilings; Walk-in closets; Split bedroom layout; Roman tub; French doors
- Laundry & utility: Laundry room inside the home; Laundry tub
Neighborhood map
What this means for you Summary
Snapshot
- This is a 3-bed/3.5-bath single-family listed at $619k.
Deal economics
- At list price, monthly cash flow is $-572 ($-7k/yr) — negative.
- To cash-flow at today's rent, offer at most $518k (16.3% below list).
- To meet the 1% rule (rent ≥ 1% of price), the offer needs to be $539k (12.9% below list).
- Recommended offer: $518k (16.3% below list) — sets the bar for cash-flow.
- Cap rate 5.2% vs local median 3.4% in Wellington — top-decile yield for the area; either an underpriced asset or a hidden risk that comps aren't pricing in. Stress-test before assuming the spread holds.
Location & tenants
- Location reads 73/100 on livability (#294 in FL, #4,986 nationally) — a middle-class / working-renter tenant base. Strengths: crime A+, employment A+, housing A+; Watch: amenities F, commute F, cost of living F.
- Palm Beach (suburban): math 46% / reading 53% proficiency, ranked #34 of 73 in FL (top 47%) — families likely to look elsewhere, expect single-tenant / working-renter base with shorter leases.
- Zoned schools: Panther Run Elementary School (math 85% / reading 82%, grade A+, #60 of 2,144 statewide, top 3%, 787 students, 19% FRL); Polo Park Middle School (math 65% / reading 68%, grade A-, #84 of 571 statewide, top 16%, 1,156 students, 33% FRL); Palm Beach Central High School (math 42% / reading 55%, grade D, #198 of 667 statewide, top 30%, 2,980 students, 40% FRL) — zoned schools average 31% FRL vs 52% district-wide (21 pts lower); this property's tenant base skews higher-income than the district average.
- Zoned-school proficiency averages 66% at this address vs 50% district-wide (+17 pts) — the actual schools serving this property are materially stronger than the Palm Beach average implies; a family-tenant draw the district grade alone would hide.
- Market conditions: 172 active listings in the ZIP; 37 comparable units currently listed for rent nearby; rentals at typical pace (median 21d on market — plan ~3-4 weeks tenant-placement turnaround); 3,974 units permitted in Palm Beach County in 2024 (1,012 in 5+ unit buildings).
Forward outlook
- In year one you build about $102 of equity ($4k loan paydown + $-4k appreciation (-0.7% local appreciation)).
- Palm Beach County population projected at +30% by 2050 — long-run rental-demand tailwind backs the buy-and-hold thesis.
Negotiation context
- It's been on market 31 days — a 3% lower offer ($600k) is reasonable based on typical stale-listing flexibility.
- 14 sale attempts since 25y ago with the ask held roughly flat each time — persistent listings suggest the price (not the market) is what's stuck; bring a comps-based counter.
- Current owner paid $365k; list at $619k implies a 70% gain — meaningful room to come down on a strong offer.
Risks & watch-outs
- Climate carrying-cost: severe wind risk, 99% chance of damaging wind over 30y; extreme-heat days projected 7→26/yr by 2055 (HVAC capex compounding) — expect insurance premiums to compound above CPI over the hold.
Questions for the listing agent
- What do current leases actually rent for vs. the listed asking? Can we see a recent rent roll and the last 12 months of T-12 income?
- It's been on market 31 days. Have you received any prior offers? Is the seller open to a 16% concession, seller financing, or rate buy-down credit?
- What does the HOA fee cover, when was the last increase, and are there any pending special assessments or reserve-fund shortfalls?
- Is there a deadline driving the sale (1031 exchange, divorce, estate, relocation)? That informs how much negotiation room exists.
- Schools are A-rated — typically a magnet for longer-tenancy family renters. What's the average tenant stay here, and is there a school-zone premium baked into asking?
- The area grade is low — what's the realistic commute time and amenity access for the typical tenant pool here? Any planned neighborhood developments (good or bad) we should know about?
- What's the average days-on-market for RENTAL listings here right now (not sales)? A rising rental-DOM trend means longer vacancies and softer asking-rent achievability than the comps imply.
- What's the recent tenant-quality profile in this submarket — average credit score on applications, eviction rate, late-payment / NSF rate, and stable-employment percentage? A property-management company in the area should have these aggregated.
- How much new for-sale + rental construction is in the pipeline within 1–3 miles? Heavy new supply typically softens prices + rents 12–24 months out; constrained supply supports both.
Investment metrics
- 1% rule
- 0.87% ✗
- Cap rate
- 5.18%
- Cash-on-cash
- -3.96%
- DSCR
- 0.82
- GRM
- 9.6
CMA / ARV
- ARV (on-the-fly)
- $735,250
- Comps found
- 3
Show comp detail 3 sales within ~0.75 mi
| Address | Dist | Beds/Ba | Sqft | Sold | Price | $/sf | Match |
|---|---|---|---|---|---|---|---|
| 4034 Manchester Lake Dr | 0.22mi | 3/3.5 | 2,967 (+1%) | 2mo | $440,000 | $148 | 86 |
| 10736 Northgreen Dr | 0.08mi | 4/3.5 (+1) | 3,202 (+9%) | 8mo | $800,000 | $250 | 70 |
| 11115 Silver Ridge St | 0.71mi | 4/3.0 (+1) | 2,578 (-12%) | 14mo | $860,000 | $334 | 28 |
Match score weights: distance 35% · size 25% · config 20% · recency 20%. Top-matched comps best support the ARV.
Projected returns pro-forma
-0.67% appreciation · 3.0% rent growth · sell at horizon
- IRR
- -9.6%
- Equity multiple
- 0.58×
- Total profit
- $-73,504
- Equity at exit
- $159,130
- IRR
- -2.9%
- Equity multiple
- 0.72×
- Total profit
- $-49,251
- Equity at exit
- $175,524
Cash invested: $173,320 (down + closing). Projections, not guarantees.
Landlord ↔ Tenant lean methodology
- Overall (STATE)
- 87 Strongly Landlord-Friendly
- State Florida
- 87 Strongly Landlord-Friendly · R+3
- County
- — inherits STATE
- City
- — inherits STATE
ZIP-level market 33449
- Home prices YoY
- -0.2%
- Active inventory
- 172
- Price-to-rent
- 9.6×
Monthly cashflow live
- Estimated rent
- $5,388 high interval (Pro) →
- Mortgage (P&I)
- −$3,246
- Tax from tax record
- −$413 /mo · $4,957/yr
- Insurance
- −$258
- HOA
- −$912
- Lot rent
- −$0
- Vacancy / Maint / Mgmt
- −$1,132
- Net cashflow
- $-572
Break-even live
Sensitivity live
| Price | -10% $-222 | -5% $-397 | +0% $-572 | +5% $-747 | +10% $-923 |
|---|---|---|---|---|---|
| Rent | -10% $-998 | -5% $-785 | +0% $-572 | +5% $-359 | +10% $-147 |
| Rate | -1.0pp $-260 | -0.5pp $-415 | base $-572 | +0.5pp $-733 | +1.0pp $-896 |
UW: 25.0% down · 7.5% · 30yr · 1.5% tax · 5.0% vac · 8.0% maint · 8.0% mgmt
Financing live
Cash to close
- Down payment
- $154,750
- Closing costs
- $18,570
- Reserves months
- —
- Total cash needed
- —
Loan-product check · same deal, 3 products live
Conventional
25% down · 7.5% · 30yr
- Down + closing
- —
- Monthly P&I
- —
- Monthly cashflow
- —
- DSCR
- —
- Eligible?
- —
Personal DTI + credit; lowest rate.
DSCR
20% down · 8.5% · 30yr
- Down + closing
- —
- Monthly P&I
- —
- Monthly cashflow
- —
- DSCR
- —
- Eligible?
- —
No personal income docs; deal must DSCR.
Hard money
10% down · 12.0% · 12mo
- Down + closing
- —
- Monthly P&I
- —
- Monthly cashflow
- —
- DSCR
- —
- Eligible?
- —
Short-term bridge; refi at stabilization.
Rent comps 37 comps
| Address | Beds | Baths | Sqft | Rent | $/sqft | DOM | Units | Dist |
|---|---|---|---|---|---|---|---|---|
| 10415 Saint Germain Ct Wellington, FL | 4.0 | 3.5 | 2469 | $6,500 | $2.63 | 24d | 1 | 0.36mi |
| 10415 Saint Germain Ct Wellington, FL | 4.0 | 3.5 | 2469 | $6,500 | $2.63 | 5d | 1 | 0.36mi |
| 10880 Northgreen Dr Lake Worth, FL | 3.0 | 3.5 | 2929 | $13,000 | $4.44 | 10d | 1 | 0.39mi |
| 3501 Collonade Dr Wellington, FL | 4.0 | 4.5 | 3581 | $8,000 | $2.23 | 7d | 1 | 0.42mi |
| 3366 Harness Cir Lake Worth, FL | 3.0 | 2.0 | 2340 | $3,750 | $1.60 | 13d | 1 | 0.45mi |
| 10283 Wellington Parc Dr Lake Worth, FL | 4.0 | 3.0 | 2076 | $3,600 | $1.73 | 26d | 1 | 0.47mi |
| 10139 Wellington Parc Dr Lake Worth, FL | 4.0 | 3.0 | 2076 | $3,795 | $1.83 | 5d | 1 | 0.50mi |
| 4173 Imperial Club Ln Lake Worth, FL | 3.0 | 2.5 | 1989 | $2,995 | $1.51 | 21d | 1 | 0.51mi |
| 10348 Wellington Parc Dr Lake Worth, FL | 3.0 | 2.5 | 2060 | $3,300 | $1.60 | 26d | 1 | 0.52mi |
| 10426 Wellington Parc Dr Unit 1 Wellington, FL | 4.0 | 2.5 | 2587 | $3,650 | $1.41 | 26d | 1 | 0.55mi |
| 10450 Wellington Parc Dr Wellington, FL | 3.0 | 2.5 | 1983 | $3,350 | $1.69 | 26d | 1 | 0.57mi |
| 11137 Grandview Mnr Wellington, FL | 4.0 | 3.0 | 2194 | $9,500 | $4.33 | 19d | 1 | 0.57mi |
| 4553 Barclay Fair Way Lake Worth, FL | 3.0 | 3.0 | 2278 | $4,000 | $1.76 | 26d | 1 | 0.58mi |
| 4553 Barclay Fair Way Lake Worth, FL | 3.0 | 3.0 | 2278 | $4,000 | $1.76 | 19d | 1 | 0.58mi |
| 11065 Stone Creek St Wellington, FL | 4.0 | 2.5 | 2478 | $4,500 | $1.82 | 26d | 1 | 0.63mi |
| 4528 Barclay Fair Way Lake Worth, FL | 3.0 | 2.0 | 2147 | $8,000 | $3.73 | 1d | 1 | 0.65mi |
| 10652 Ivanhoe Ln Wellington, FL | 4.0 | 2.5 | 2746 | $6,000 | $2.18 | 26d | 1 | 0.76mi |
| 10731 Ivanhoe Ln Wellington, FL | 4.0 | 2.5 | 2800 | $8,500 | $3.04 | 6d | 1 | 0.83mi |
| 4018 Bluff Harbor Way Wellington, FL | 4.0 | 2.5 | 2160 | $4,300 | $1.99 | 10d | 1 | 0.87mi |
| 4841 Exeter Estate Ln Lake Worth, FL | 3.0 | 3.0 | 2567 | $5,000 | $1.95 | 26d | 1 | 0.88mi |
| 3470 Custer Ave Lake Worth, FL | 3.0 | 2.0 | 2040 | $4,500 | $2.21 | 26d | 1 | 0.89mi |
| 4194 Bluff Harbor Way Wellington, FL | 3.0 | 2.5 | 2152 | $3,999 | $1.86 | 1d | 1 | 0.90mi |
| 3306 Fargo Ave Lake Worth, FL | 3.0 | 2.0 | 2370 | $5,500 | $2.32 | 26d | 1 | 1.02mi |
| 2899 Florence St Wellington, FL | 3.0 | 2.0 | 2459 | $9,500 | $3.86 | 26d | 1 | 1.09mi |
| 3425 Siena Cir Wellington, FL | 4.0 | 3.5 | 3254 | $6,500 | $2.00 | 24d | 1 | 1.10mi |
| 3425 Siena Cir Wellington, FL | 4.0 | 3.5 | 3254 | $6,500 | $2.00 | 10d | 1 | 1.10mi |
| 10640 Oak Meadow Ln Lake Worth, FL | 4.0 | 3.0 | 2727 | $7,500 | $2.75 | 20d | 1 | 1.19mi |
| 4145 Bahia Isle Cir Wellington, FL | 4.0 | 2.5 | 2442 | $16,000 | $6.55 | 1d | 1 | 1.19mi |
| 10274 Prato St Wellington, FL | 4.0 | 2.0 | 2459 | $6,500 | $2.64 | 26d | 1 | 1.20mi |
| 4127 Siena Cir Wellington, FL | 3.0 | 3.0 | 2561 | $9,600 | $3.75 | 1d | 1 | 1.22mi |
| 4127 Siena Cir Wellington, FL | 3.0 | 3.0 | 2561 | $9,600 | $3.75 | 10d | 1 | 1.22mi |
| 9676 Eagle Point Ln Lake Worth, FL | 4.0 | 3.0 | 2815 | $5,800 | $2.06 | 26d | 1 | 1.40mi |
| 9829 Scribner Ln Wellington, FL | 4.0 | 3.0 | 2244 | $3,700 | $1.65 | 26d | 1 | 1.47mi |
| 9825 Scribner Ln Wellington, FL | 4.0 | 2.5 | 2104 | $3,800 | $1.81 | 26d | 1 | 1.48mi |
| 9825 Scribner Ln Wellington, FL | 4.0 | 3.0 | 2888 | $3,750 | $1.30 | 17d | 1 | 1.48mi |
| 9825 Scribner Ln Wellington, FL | 4.0 | 2.5 | 2104 | $3,800 | $1.81 | 19d | 1 | 1.48mi |
| 9825 Scribner Ln Wellington, FL | 4.0 | 2.5 | 2104 | $3,800 | $1.81 | 24d | 1 | 1.48mi |
HOA detail
- Monthly dues
- $912 · $10,944/yr
- Likely covers
- waterpool
Listing history 50 events
-
2026-06-22days on market $619,000 Active 31 DOM
-
2026-06-21days on market $619,000 Active 30 DOM
-
2026-06-18days on market $619,000 Active 27 DOM
-
2026-06-17days on market $619,000 Active 26 DOM
-
2026-06-16days on market $619,000 Active 25 DOM
-
2026-06-15days on market $619,000 Active 24 DOM
-
2026-06-13days on market $619,000 Active 22 DOM
-
2026-06-09days on market $619,000 Active 18 DOM
-
2026-06-08days on market $619,000 Active 17 DOM
-
2026-06-07pricedays on market $619,000 Active 16 DOM
-
2026-06-04days on market $645,000 Active 13 DOM
-
2026-06-03days on market $645,000 Active 12 DOM
-
2026-06-02days on market $645,000 Active 11 DOM
-
2026-06-01days on market $645,000 Active 10 DOM
-
2026-05-31days on market $645,000 Active 9 DOM
-
2026-05-22$645,000 Active
-
2024-09-17historical
-
2024-08-19price $549,900
-
2024-07-19price $559,900
-
2024-07-15price $574,500
-
2024-07-03$589,000 Active
-
2024-06-18historical
-
2024-06-07historical
-
2024-04-25price $569,000
-
2024-03-27price $599,000
-
2024-02-21status Active
-
2024-02-21status Pending
-
2024-01-25$629,000 Active
-
2024-01-19historical
-
2024-01-04price $674,500
-
2024-01-04status Active
-
2023-11-16historical
-
2023-10-24price $673,500
-
2023-08-23$698,500 Active
-
2023-08-14historical
-
2023-08-11status Active
-
2023-08-08historical Active Under Contract
-
2023-06-30$699,999 Active
-
2022-12-23historical
-
2022-12-05$725,000 Active
-
2014-03-04soldstatus $365,000
-
2014-02-28soldstatus $365,000 Closed
-
2013-12-20status Active
-
2013-12-17status Pending
-
2013-08-03$380,000 Active
-
2013-07-30historical
-
2013-07-29$380,000 Active
-
2013-06-26historical
-
2012-07-05$399,000 Active
-
2002-11-19soldstatus $360,000
ⓘ Source: listings_history table (triggers on properties + properties_extension) + one-shot
backfill from property_details.listing_events for pre-trigger history.
Tax reassessment forecast FL · Resets to sale price
- Current annual tax
- $4,957 · $413/mo
- Projected year-2 tax
- $5,138 · $428/mo
- Expected delta
- +$181/yr (+$15/mo · 3.6%)
ⓘ Screening estimate from a state-policy table — verify with the county assessor before closing.
Climate risk First Street
- Flood 3/10 Moderate FEMA zone X (unshaded) · 20% chance over 30 yrs
- Wildfire 1/10 Low
- Heat 10/10 Extreme 7 d/yr ≥106°F today · 26 d/yr by 30 yrs out
- Wind 10/10 Extreme 99% chance of damaging wind over 30 yrs
- Air quality 2/10 Low 0 unhealthy d/yr today · 2 by 30 yrs out
Nearby sold comps map
Loading sold comps map…
Walkable amenities ~0.75 mi
Loading nearby amenities…
Taxation est. · year 1
- Rental income
- $64,661
- − Mortgage interest
- −$34,674
- − Property taxes
- −$4,957
- − Insurance
- −$3,095
- − Repairs & maintenance
- −$5,173
- − Management
- −$5,173
- − HOA
- −$10,944
- − Depreciation
- −$18,007
- Taxable loss
- −$17,361
- Est. tax savings @ 24.0%
- +$4,167
- After-tax cash flow
- $-2,700/yr
For passive investors: Depreciation is non-cash, so a rental often shows a tax loss while cash-flowing — sheltering income. Rental losses are passive: they offset passive income freely, and up to $25,000/yr can offset ordinary (W-2) income if you actively participate and your MAGI is under $100k (phasing out to $0 by $150k); unused losses carry forward. On sale, claimed depreciation is recaptured at up to 25%, and gains may owe capital-gains tax (a 1031 exchange can defer both). Figures are a year-1 estimate at your 24.0% rate — not tax advice; consult a CPA.
Schools (NCES district)
- District
- Palm Beach
- NCES district ID
- 1201500
- Math proficiency
- 46% ▼ -16.00%
- Reading proficiency
- 53% ▼ -4.00%
- Median HH income
- $53,943
- Composite
- 42.72/100
- National rank
- #3160
- State rank
- #34 of 73 in FL
Livability — Wellington
- Score
- 73/100
- State rank
- #294
- US rank
- #4986
Category grades
Schools grade is shown separately in the Schools card above.
Census & demographics
- City population
- 60,184
- Population (ZIP)
- 9,131
Population outlook (Palm Beach County) Hauer SSP2
- Today (2025)
- 1,637,487 people
- By 2030
- 1,743,255 · +6.5%
- By 2040
- 1,948,712 · +19.0%
- By 2050
- 2,132,979 · +30.3%
- By 2075
- 2,530,027 · +54.5%
- By 2100
- 2,706,979 · +65.3%
Race, ethnicity, and origin ACS 2023
- Neighborhood character
- Majority White (65%)
- Race & ethnicity
- White 65% Hispanic / Latino 16% Black 14% Two or more races 7% Asian 4%
- Hispanic origin (detail)
- Mexican 3% Puerto Rican 3% Cuban 3% Salvadoran 2%
- Common ancestry
- Scotch-Irish 5% Romanian 4% Hispanic 3%
- Foreign-born
- 21% · Canada, Jamaica, Vietnam
- Languages at home
- 75% English-only · Spanish 12% French/Haitian/Cajun 4% Other Indo-European 3%
Political lean MEDSL · Palm Beach
- 2024 margin
- Toss-up / Even · D 50.0% · R 49.2%
- 2008→2024 swing
- -22.1pp toward R · 2008: 22.9pp · 2024: 0.8pp
- All cycles
- 2024: D+0.8 2020: D+12.8 2016: D+15.3 2012: D+17.0 2008: D+22.9
Not yet ingested
- Civics
- —
Market trends
- HPI YoY
- ▼ -0.67%
- Current HPI
- 271.0184
- Rent YoY
- —
- Metro
- —
- State GDP YoY
- ▲ 3.28%
- F500 in state
- 36
Industry mix (Fortune 500 HQ in FL)
| Industry | F500 HQs | Revenue |
|---|---|---|
| Industrial Technology | 2 | $29B |
|
||
| Insurance | 2 | $17B |
|
||
| Retail | 1 | $60B |
|
||
| Technology Distribution | 1 | $58B |
|
||
| Homebuilding | 1 | $35B |
|
||
| Technology Manufacturing | 1 | $35B |
|
||
Price history
+63.3% since first listed37 events — show timeline
- 2026-05-22 Listed $645,000 Beaches MLS
- 2024-09-17 Listing Removed — Beaches MLS
- 2024-08-19 Price Changed $549,900 Beaches MLS
- 2024-07-19 Price Changed $559,900 Beaches MLS
- 2024-07-15 Price Changed $574,500 Beaches MLS
- 2024-07-03 Listed $589,000 Beaches MLS
- 2024-06-18 Coming Soon — Beaches MLS
- 2024-06-07 Listing Removed — Beaches MLS
- 2024-04-25 Price Changed $569,000 Beaches MLS
- 2024-03-27 Price Changed $599,000 Beaches MLS
- 2024-02-21 Relisted — Beaches MLS
- 2024-02-21 Pending — Beaches MLS
- 2024-01-25 Listed $629,000 Beaches MLS
- 2024-01-19 Listing Removed — Beaches MLS
- 2024-01-04 Price Changed $674,500 Beaches MLS
- 2024-01-04 Relisted — Beaches MLS
- 2023-11-16 Listing Removed — Beaches MLS
- 2023-10-24 Price Changed $673,500 Beaches MLS
- 2023-08-23 Listed $698,500 Beaches MLS
- 2023-08-14 Listing Removed — Beaches MLS
- 2023-08-11 Relisted — Beaches MLS
- 2023-08-08 Contingent — Beaches MLS
- 2023-06-30 Listed $699,999 Beaches MLS
- 2022-12-23 Listing Removed — Beaches MLS
- 2022-12-05 Listed $725,000 Beaches MLS
- 2014-03-04 Sold (Public Records) $365,000 Public Records
- 2014-02-28 Sold (MLS) $365,000 Beaches MLS
- 2013-12-20 Relisted — Beaches MLS
- 2013-12-17 Pending — Beaches MLS
- 2013-08-03 Listed $380,000 Beaches MLS
- 2013-07-30 Listing Removed — Beaches MLS
- 2013-07-29 Listed $380,000 Beaches MLS
- 2013-06-26 Listing Removed — Beaches MLS
- 2012-07-05 Listed $399,000 Beaches MLS
- 2002-11-19 Sold (MLS) $360,000 Beaches MLS
- 2002-10-22 Listing Removed — Beaches MLS
- 2001-03-17 Listed $394,915 Beaches MLS
Property tax history
-0.6%/yrLatest (2025): $4,957 · +3.1% YoY. Source: county tax records.
Cash-flow waterfall
monthlySold comps — $/sqft
last 12 mo · ≤1 miLoading sold comps…