 🔨 Auction
23710 S Highway 71 · Huntington, AR
Flood risk 1/10 · Minimal
- FEMA flood zone
- X (unshaded)
- Chance of flooding over 30 yrs
- 0.0%
- Est. flood insurance / yr
- $507 – $1,088
Fire risk 5/10 · Moderate
- Est. fire insurance / yr
- $1,499 – $2,785
Heat risk 6/10 · Moderate
- Hot days now (above 112°F)
- 7 days/yr
- Hot days in 30 yrs
- 20 days/yr
Wind risk 3/10 · Minor
- Chance of severe wind over 30 yrs
- 7.0%
Air-quality risk 1/10 · Minimal
- Unhealthy air days now
- 0 days/yr
- Unhealthy air days in 30 yrs
- 0 days/yr
Risk factors via First Street. Map © Google.
Why this score? — see what drove the C grade
The composite is a weighted blend of 9 inputs, each scored 0–100. Each bar is that input's sub-score; the figure is the points it added to the 100-point composite (weight × sub-score).
- Cash flow +18.5/30.0
- Appreciation +8.9/10.0
- ARV discount +7.5/15.0
- DSCR +5.8/10.0
- 1% rule +5.0/10.0
- Schools +3.0/10.0
- Livability +2.9/5.0
- Rent growth +2.5/5.0
- Condition / age +2.5/5.0
$1
🖨 Deal sheet (PDF) 📄 Offer letter ✓ Due diligence
Listing remarks
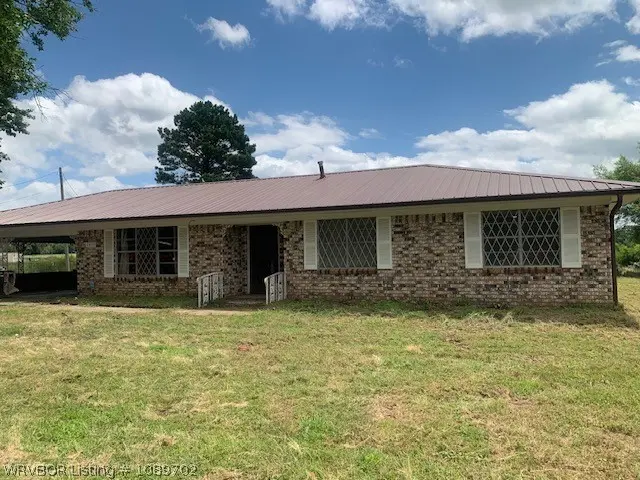
Property will come up for * * * Auction on June 27th at 2:00pm. * * * 3 Bedroom, 2 full Bath home. Has attached carport 616 SF & 160 SF sunroom. Shop is approx 24x16 with 2 door entrance, metal roof. Barn on back east side of property 16x40 approx
Key facts
- Metal roof
- Attached carport
- Barn
Tags
Property features AI
Finance
- Other: Property zoned residential; Approximately 6.1 acres
Exterior
- Parking: Attached carport; 2 covered parking spaces; Gravel parking surface
- Utilities: Public water; Septic sewer; Electricity available
- Home design: Single-family residence; One story
- Construction: Brick construction; Metal roof
- Exterior features: Covered porch; Workshop; Cleared, level lot; Gravel road access
Interior
- Kitchen: Oven; Range hood
- Flooring: Ceramic tile; Wood
- Bathrooms: 2 full bathrooms
- Heating & cooling: Central heating (natural gas); Central air conditioning; Electric cooling; Ceiling fans
- Interior features: Ceiling fans
- Laundry & utility: Electric dryer hookup; Gas water heater
Neighborhood map
What this means for you Summary
Snapshot
- This is a 3-bed/2.0-bath single-family listed at $1.
Deal economics
- At list price, monthly cash flow is $111 ($1k/yr) — positive.
- The deal already cash-flows at list — no discount required.
- Meets the 1% rule at list price ($1k rent vs $1).
Location & tenants
- Location reads 57/100 on livability (#358 in AR) — a working-class tenant base; expect higher turnover. Strengths: cost of living A+, health & safety A+, housing B+; Watch: crime F, amenities F, commute F.
- Mansfield School District (rural): math 37% / reading 34% proficiency, ranked #110 of 238 in AR (top 46%) — families likely to look elsewhere, expect single-tenant / working-renter base with shorter leases.
- Zoned schools: Mansfield Elementary School (math 37% / reading 32%, grade F, #254 of 454 statewide, top 59%, 302 students, 72% FRL); Mansfield Middle School (math 44% / reading 35%, grade F, #92 of 201 statewide, top 50%, 219 students, 73% FRL); Mansfield High School (math 27% / reading 32%, grade F, #142 of 292 statewide, top 53%, 254 students, 61% FRL) — zoned schools average 68% FRL vs 50% district-wide (18 pts higher); higher-poverty schools than district average — tighter screening recommended.
- Market conditions: 19 active listings in the ZIP; 388 units permitted in Sebastian County in 2024 (16 in 5+ unit buildings).
Forward outlook
- In year one you build about $10k of equity ($801 loan paydown + $9k appreciation (7.8% local appreciation)).
- Sebastian County population projected at +7% by 2050 — modest demand growth; plan on rents tracking national, not racing it.
- At projected returns (7.8% appreciation + 3.0% rent growth), your $32k cash investment doubles in ~3 years — after that, you're playing with house money.
- By year 4, paydown + projected appreciation supports a ~$34k cash-out refi (75% LTV) — recoverable capital for the next deal without selling this one.
Negotiation context
- Only 8 days on market — expect competitive offers; lowballing is unlikely to land.
Risks & watch-outs
- Watch-outs: property tax is 173892.0% of price.
- Climate carrying-cost: moderate wildfire risk; extreme-heat days projected 7→20/yr by 2055 (HVAC capex compounding) — expect insurance premiums to compound above CPI over the hold.
Questions for the listing agent
- Property tax is high relative to price — has the assessment been appealed recently, and will the sale trigger a re-assessment?
- Is there a deadline driving the sale (1031 exchange, divorce, estate, relocation)? That informs how much negotiation room exists.
- Schools are F-rated, which usually means shorter tenancies and higher turnover. Who's the typical renter profile here, and what's been the actual vacancy rate?
- Crime grade is F in this area — have there been break-ins, vandalism, or insurance claims at this property in the last 3 years? What carrier currently insures it and at what premium?
- What's the average days-on-market for RENTAL listings here right now (not sales)? A rising rental-DOM trend means longer vacancies and softer asking-rent achievability than the comps imply.
- What's the recent tenant-quality profile in this submarket — average credit score on applications, eviction rate, late-payment / NSF rate, and stable-employment percentage? A property-management company in the area should have these aggregated.
- How much new for-sale + rental construction is in the pipeline within 1–3 miles? Heavy new supply typically softens prices + rents 12–24 months out; constrained supply supports both.
Investment metrics
- 1% rule
- 1.00% ✗
- Cap rate
- 7.44%
- Cash-on-cash
- 4.10%
- DSCR
- 1.18
- GRM
- 8.4
CMA / ARV
- ARV (on-the-fly)
- $115,928
- Comps found
- 1
Show comp detail 1 sale within ~0.75 mi
| Address | Dist | Beds/Ba | Sqft | Sold | Price | $/sf | Match |
|---|---|---|---|---|---|---|---|
| 6305 Nickletown Rd | 0.57mi | 2/1.0 (-1) | 1,454 (+8%) | 3mo | $125,000 | $86 | 49 |
Match score weights: distance 35% · size 25% · config 20% · recency 20%. Top-matched comps best support the ARV.
Projected returns pro-forma
7.84% appreciation · 3.0% rent growth · sell at horizon
- IRR
- 22.8%
- Equity multiple
- 2.65×
- Total profit
- $53,625
- Equity at exit
- $86,778
- IRR
- 20.9%
- Equity multiple
- 5.63×
- Total profit
- $150,336
- Equity at exit
- $171,031
Cash invested: $32,460 (down + closing). Projections, not guarantees.
Landlord ↔ Tenant lean methodology
- Overall (STATE)
- 92 Strongly Landlord-Friendly
- State Arkansas
- 92 Strongly Landlord-Friendly · R+14
- County
- — inherits STATE
- City
- — inherits STATE
ZIP-level market 72940
- Home prices YoY
- 2.5%
- Active inventory
- 19
Monthly cashflow live
- Estimated rent
- $1,155 medium interval (Pro) →
- Mortgage (P&I)
- −$608
- Tax est. 1.5%
- −$145 /mo · $1,739/yr
- Insurance
- −$48
- HOA
- −$0
- Vacancy / Maint / Mgmt
- −$242
- Net cashflow
- $111
Break-even live
Sensitivity live
| Price | -10% $191 | -5% $151 | +0% $111 | +5% $71 | +10% $31 |
|---|---|---|---|---|---|
| Rent | -10% $20 | -5% $65 | +0% $111 | +5% $157 | +10% $202 |
| Rate | -1.0pp $169 | -0.5pp $140 | base $111 | +0.5pp $81 | +1.0pp $50 |
UW: 25.0% down · 7.5% · 30yr · 1.5% tax · 5.0% vac · 8.0% maint · 8.0% mgmt
Financing live
Cash to close
- Down payment
- $28,982
- Closing costs
- $3,478
- Reserves months
- —
- Total cash needed
- —
Loan-product check · same deal, 3 products live
Conventional
25% down · 7.5% · 30yr
- Down + closing
- —
- Monthly P&I
- —
- Monthly cashflow
- —
- DSCR
- —
- Eligible?
- —
Personal DTI + credit; lowest rate.
DSCR
20% down · 8.5% · 30yr
- Down + closing
- —
- Monthly P&I
- —
- Monthly cashflow
- —
- DSCR
- —
- Eligible?
- —
No personal income docs; deal must DSCR.
Hard money
10% down · 12.0% · 12mo
- Down + closing
- —
- Monthly P&I
- —
- Monthly cashflow
- —
- DSCR
- —
- Eligible?
- —
Short-term bridge; refi at stabilization.
Listing history 8 events
-
2026-06-19days on market $1 Active 8 DOM
-
2026-06-18days on market $1 Active 7 DOM
-
2026-06-17days on market $1 Active 6 DOM
-
2026-06-16days on market $1 Active 5 DOM
-
2026-06-15days on market $1 Active 4 DOM
-
2026-06-14days on market $1 Active 2 DOM
-
2026-06-12remarks 255-char remark
-
2026-06-12$1 Active 1 DOM
ⓘ Source: listings_history table (triggers on properties + properties_extension) + one-shot
backfill from property_details.listing_events for pre-trigger history.
Climate risk First Street
- Flood 1/10 Low FEMA zone X (unshaded) · 0% chance over 30 yrs
- Wildfire 5/10 Major
- Heat 6/10 Major 7 d/yr ≥112°F today · 20 d/yr by 30 yrs out
- Wind 3/10 Moderate 7% chance of damaging wind over 30 yrs
- Air quality 1/10 Low 0 unhealthy d/yr today · 0 by 30 yrs out
Nearby sold comps map
Loading sold comps map…
Walkable amenities ~0.75 mi
Loading nearby amenities…
Taxation est. · year 1
- Rental income
- $13,856
- − Mortgage interest
- −$6,494
- − Property taxes
- −$1,739
- − Insurance
- −$580
- − Repairs & maintenance
- −$1,108
- − Management
- −$1,108
- − Depreciation
- −$3,372
- Taxable loss
- −$546
- Est. tax savings @ 24.0%
- +$131
- After-tax cash flow
- $1,463/yr
For passive investors: Depreciation is non-cash, so a rental often shows a tax loss while cash-flowing — sheltering income. Rental losses are passive: they offset passive income freely, and up to $25,000/yr can offset ordinary (W-2) income if you actively participate and your MAGI is under $100k (phasing out to $0 by $150k); unused losses carry forward. On sale, claimed depreciation is recaptured at up to 25%, and gains may owe capital-gains tax (a 1031 exchange can defer both). Figures are a year-1 estimate at your 24.0% rate — not tax advice; consult a CPA.
Schools (NCES district)
- District
- Mansfield School District
- NCES district ID
- 0509330
- Math proficiency
- 37% ▼ -8.00%
- Reading proficiency
- 34% ▼ -8.00%
- Median HH income
- $46,056
- Composite
- 30.41/100
- National rank
- #6245
- State rank
- #110 of 238 in AR
Livability — Huntington
- Score
- 57/100
- State rank
- #358
- US rank
- #22053
Category grades
Schools grade is shown separately in the Schools card above.
Census & demographics
- Population (ZIP)
- 1,936
Population outlook (Sebastian County) Hauer SSP2
- Today (2025)
- 133,992 people
- By 2030
- 136,620 · +2.0%
- By 2040
- 140,832 · +5.1%
- By 2050
- 143,301 · +6.9%
- By 2075
- 147,964 · +10.4%
- By 2100
- 145,848 · +8.8%
Race, ethnicity, and origin ACS 2023
- Neighborhood character
- Predominantly White (95%)
- Race & ethnicity
- White 95% Two or more races 4%
- Common ancestry
- European 2% Lithuanian 1% Portuguese 1%
- Foreign-born
- 1%
- Languages at home
- 99% English-only · German/W. Germanic 1%
Political lean MEDSL · Sebastian
- 2024 margin
- Solid R (+37.5) · D 30.0% · R 67.6% · Other 2.4%
- 2008→2024 swing
- -2.9pp toward R · 2008: -34.6pp · 2024: -37.5pp
- All cycles
- 2024: R+37.5 2020: R+35.5 2016: R+38.1 2012: R+37.1 2008: R+34.6
Not yet ingested
- Civics
- —
Market trends
- HPI YoY
- ▲ 7.84%
- Current HPI
- 324.9353
- Rent YoY
- —
- Metro
- —
- State GDP YoY
- ▲ 3.80%
- F500 in state
- 10
Industry mix (Fortune 500 HQ in AR)
| Industry | F500 HQs | Revenue |
|---|---|---|
| Retail | 1 | $681B |
|
||
| Food / Agriculture | 1 | $53B |
|
||
| Retail / Energy | 1 | $22B |
|
||
| Transportation / Logistics | 1 | $12B |
|
||
| Energy | 1 | $4B |
|
||
Cash-flow waterfall
monthlySold comps — $/sqft
last 12 mo · ≤1 miLoading sold comps…