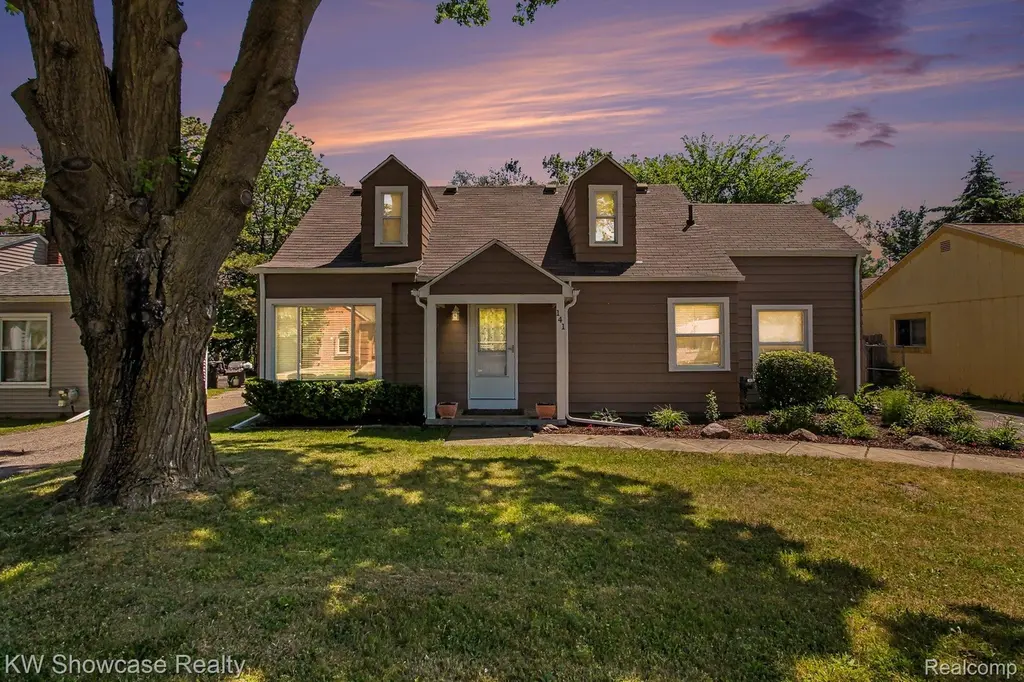
141 Kissane Ave · Brighton, MI
Flood risk 1/10 · Minimal
- FEMA flood zone
- X (unshaded)
- Chance of flooding over 30 yrs
- 0.0%
- Est. flood insurance / yr
- $507 – $1,088
Fire risk 1/10 · Minimal
- Est. fire insurance / yr
- $784 – $1,456
Heat risk 3/10 · Minor
- Hot days now (above 96°F)
- 7 days/yr
- Hot days in 30 yrs
- 15 days/yr
Wind risk 2/10 · Minimal
- Chance of severe wind over 30 yrs
- —
Air-quality risk 2/10 · Minimal
- Unhealthy air days now
- 1 days/yr
- Unhealthy air days in 30 yrs
- 2 days/yr
Risk factors via First Street. Map © Google.
Why this score? — see what drove the C- grade
The composite is a weighted blend of 9 inputs, each scored 0–100. Each bar is that input's sub-score; the figure is the points it added to the 100-point composite (weight × sub-score).
- Cash flow +20.5/30.0
- DSCR +6.5/10.0
- ARV discount +6.4/15.0
- Schools +5.8/10.0
- 1% rule +4.9/10.0
- Livability +3.9/5.0
- Rent growth +2.5/5.0
- Condition / age +2.5/5.0
- Appreciation +0.0/10.0
$299,900
🖨 Deal sheet 📄 Offer letter ✓ Due diligence
Listing remarks MLS
Beautifully Maintained Brighton Home This super well-maintained and comfortable 3-bedroom, 2 full bath home is ideally located in Brighton. Featuring beautiful birchwood hardwood floors throughout the main level, the home offers a large family room and a separate dining area, creating a warm and inviting space for both everyday living and entertaining. The thoughtfully designed main floor includes a convenient first-floor bedroom, a full bathroom, and first-floor laundry, making one-level living a possibility. Upstairs you will find two large bedrooms, a second full bathroom, and a spacious bonus room ideal for extra storage. The kitchen offers oak cabinetry and flows nicely into the dining area, with a sliding glass door leading to a large wooden deck perfect for outdoor gatherings. The standout feature of this property is the massive detached oversized 2-car garage, complete with a workshop area and second-level storage - an ideal setup for the hobbyist or anyone needing extra workspace and storage. Situated on a nice lot with mature trees and welcoming curb appeal, this home has no HOA and is just minutes from charming downtown Brighton with its excellent shopping, dining, and entertainment options, and offers quick access to US-23 and I-96. A comfortable, move-in ready home in a fantastic location - schedule your showing today!
Key facts
- Oak cabinetry
- Large family room
- Spacious bonus room
Tags
Property features AI
Finance
- Other: Lot dimensions approximately 63 x 129 x 60 x 130 (0.17 acres); Paved road; Subdivision: KISSANE PARK; Directions: E Grand River to Kissane
- HOA & community: Sidewalks in the community
Exterior
- Parking: Detached oversized garage with workshop and garage door opener; Approximately 2.5 garage spaces
- Security: Smoke detector(s); Carbon monoxide detector(s)
- Utilities: Public water; Public sewer; Electric with circuit breakers
- Home design: Single family residence; Two levels; Ground-level entry with steps; Aluminum siding
- Construction: Asphalt roof
- Exterior features: Deck; Fenced backyard; Shed
Interior
- Kitchen: Free-standing electric oven; Free-standing refrigerator
- Bedrooms: Total rooms: 8
- Bathrooms: 2 full bathrooms
- Heating & cooling: Forced air heating (natural gas); Central air conditioning
- Interior features: Smart thermostat; Crawl space basement
- Laundry & utility: Gas water heater
Neighborhood map
What this means for you Summary
Snapshot
- This is a 3-bed/2.0-bath single-family listed at $300k.
Deal economics
- At list price, monthly cash flow is $397 ($5k/yr) — positive.
- The deal already cash-flows at list — no discount required.
- To meet the 1% rule (rent ≥ 1% of price), the offer needs to be $297k (0.9% below list).
- Recommended offer: $297k (0.9% below list) — sets the bar for 1% rule.
- Cap rate 7.9% vs local median 3.2% in Brighton — top-decile yield for the area; either an underpriced asset or a hidden risk that comps aren't pricing in. Stress-test before assuming the spread holds.
Location & tenants
- Location reads 78/100 on livability (#108 in MI, #2,621 nationally) — a middle-class / working-renter tenant base. Strengths: cost of living A+, housing A+, health & safety A+; Watch: amenities F, commute F.
- Brighton Area Schools (suburban): math 59% / reading 69% proficiency, ranked #22 of 540 in MI (top 4%) — acceptable for families but not a draw, mixed tenant base, ~2y average lease; only 10% free/reduced lunch — higher-income household profile.
- Market conditions: 178 active listings in the ZIP; 4 comparable units currently listed for rent nearby; rentals lingering (median 44d on market — plan ~5-8 weeks vacancy on turnover, expect pricing pressure); 50% of comp listings sitting > 30 days — soft ceiling on asking rent; solid renter incomes; 488 units permitted in Livingston County in 2024 (0 in 5+ unit buildings).
- This rent runs 33% of the median local income ($107k/yr) — at the standard rent-burdened threshold; future hikes will face affordability resistance.
Forward outlook
- Local home prices are declining (-3.0%/yr); year-one equity from $2k of loan paydown is wiped out by about $9k of value loss. Plan a longer hold.
- Livingston County population projected at +7% by 2050 — modest demand growth; plan on rents tracking national, not racing it.
Negotiation context
- Only 11 days on market — expect competitive offers; lowballing is unlikely to land.
- 9 sale attempts since 23y ago with the ask held roughly flat each time — persistent listings suggest the price (not the market) is what's stuck; bring a comps-based counter.
- Current owner paid $115k; list at $300k implies a 161% gain — meaningful room to come down on a strong offer.
Risks & watch-outs
- Watch-outs: built in 1950 — expect roof / HVAC / electrical / plumbing capex.
Questions for the listing agent
- Built in 1950 — when were the roof, HVAC, electrical panel, plumbing, and water heater last replaced?
- Is there a deadline driving the sale (1031 exchange, divorce, estate, relocation)? That informs how much negotiation room exists.
- Schools are A-rated — typically a magnet for longer-tenancy family renters. What's the average tenant stay here, and is there a school-zone premium baked into asking?
- What's the average days-on-market for RENTAL listings here right now (not sales)? A rising rental-DOM trend means longer vacancies and softer asking-rent achievability than the comps imply.
- What's the recent tenant-quality profile in this submarket — average credit score on applications, eviction rate, late-payment / NSF rate, and stable-employment percentage? A property-management company in the area should have these aggregated.
- How much new for-sale + rental construction is in the pipeline within 1–3 miles? Heavy new supply typically softens prices + rents 12–24 months out; constrained supply supports both.
Investment metrics
- 1% rule
- 0.99% ✗
- Cap rate
- 7.88%
- Cash-on-cash
- 5.67%
- DSCR
- 1.25
- GRM
- 8.4
CMA / ARV
- ARV (on-the-fly)
- $292,746
- Comps found
- 9
Show comp detail 9 sales within ~0.75 mi
| Address | Dist | Beds/Ba | Sqft | Sold | Price | $/sf | Match |
|---|---|---|---|---|---|---|---|
| 128 Becker Dr | 0.23mi | 3/1.5 | 1,648 (+9%) | 0mo | $320,000 | $194 | 71 |
| 5320 Leland St | 0.33mi | 3/1.0 | 1,573 (+4%) | 10mo | $305,000 | $194 | 65 |
| 5417 Leland St | 0.24mi | 3/2.0 | 1,725 (+14%) | 9mo | $320,000 | $186 | 57 |
| 215 S East St | 0.56mi | 3/2.0 | 1,528 (+1%) | 22mo | $375,000 | $245 | 53 |
| 5221 Van Winkle St | 0.52mi | 3/1.0 | 1,536 (+2%) | 20mo | $255,000 | $166 | 52 |
| 5418 Military Ave | 0.39mi | 3/2.5 | 1,692 (+12%) | 16mo | $241,000 | $142 | 46 |
| 5258 Ethel St | 0.48mi | 4/1.0 (+1) | 1,419 (-6%) | 20mo | $308,000 | $217 | 42 |
| 739 Nelson St | 0.75mi | 3/1.5 | 1,640 (+9%) | 13mo | $316,500 | $193 | 38 |
| 234 Woodlake Dr | 0.68mi | 3/1.0 | 1,306 (-14%) | 10mo | $341,500 | $261 | 34 |
Match score weights: distance 35% · size 25% · config 20% · recency 20%. Top-matched comps best support the ARV.
Projected returns pro-forma
-3.0% appreciation · 3.0% rent growth · sell at horizon
- IRR
- -7.5%
- Equity multiple
- 0.72×
- Total profit
- $-23,344
- Equity at exit
- $44,716
- IRR
- 2.0%
- Equity multiple
- 1.14×
- Total profit
- $12,105
- Equity at exit
- $25,930
Cash invested: $83,972 (down + closing). Projections, not guarantees.
Landlord ↔ Tenant lean methodology
- Overall (STATE)
- 62 Landlord-Friendly
- State Michigan
- 62 Landlord-Friendly · EVEN
- County
- — inherits STATE
- City
- — inherits STATE
ZIP-level market 48116
- Active inventory
- 178
- Price-to-rent
- 8.4×
Monthly cashflow live
- Estimated rent
- $2,972 medium interval (Pro) →
- Mortgage (P&I)
- −$1,573
- Tax from tax record
- −$253 /mo · $3,036/yr
- Insurance
- −$125
- HOA
- −$0
- Vacancy / Maint / Mgmt
- −$624
- Net cashflow
- $397
Break-even live
Sensitivity live
| Price | -10% $567 | -5% $482 | +0% $397 | +5% $312 | +10% $227 |
|---|---|---|---|---|---|
| Rent | -10% $162 | -5% $280 | +0% $397 | +5% $514 | +10% $632 |
| Rate | -1.0pp $548 | -0.5pp $473 | base $397 | +0.5pp $319 | +1.0pp $240 |
UW: 25.0% down · 7.5% · 30yr · 1.5% tax · 5.0% vac · 8.0% maint · 8.0% mgmt
Financing live
Cash to close
- Down payment
- $74,975
- Closing costs
- $8,997
- Reserves months
- —
- Total cash needed
- —
Loan-product check · same deal, 3 products live
Conventional
25% down · 7.5% · 30yr
- Down + closing
- —
- Monthly P&I
- —
- Monthly cashflow
- —
- DSCR
- —
- Eligible?
- —
Personal DTI + credit; lowest rate.
DSCR
20% down · 8.5% · 30yr
- Down + closing
- —
- Monthly P&I
- —
- Monthly cashflow
- —
- DSCR
- —
- Eligible?
- —
No personal income docs; deal must DSCR.
Hard money
10% down · 12.0% · 12mo
- Down + closing
- —
- Monthly P&I
- —
- Monthly cashflow
- —
- DSCR
- —
- Eligible?
- —
Short-term bridge; refi at stabilization.
Rent comps 4 comps
| Address | Beds | Baths | Sqft | Rent | $/sqft | DOM | Units | Dist |
|---|---|---|---|---|---|---|---|---|
| 293 N 2nd St Brighton, MI | 2.0 | 2.0 | 1139 | $2,300 | $2.02 | 44d | 1 | 0.99mi |
| 700 N 2nd St Brighton, MI | 1.0–3.0 | 1.0–2.0 | 1039 | $3,335 | $3.21 | 2d | 1 | 1.17mi |
| 4229 Deeside Dr Brighton, MI | 2.0–3.0 | 2.0 | 1632 | $2,669 | $1.64 | 2d | 1 | 1.26mi |
| 6891 Somerset Dr Brighton, MI | 3.0 | 1.5 | 1532 | $2,775 | $1.81 | 44d | 1 | 1.44mi |
Listing history 8 events
-
2026-06-15statusdays on market $299,900 Pending 11 DOM
-
2026-06-13days on market $299,900 Active Under Contract 10 DOM
-
2026-06-13days on market $299,900 Active Under Contract 9 DOM
-
2026-06-09days on market $299,900 Active Under Contract 6 DOM
-
2026-06-08days on market $299,900 Active Under Contract 5 DOM
-
2026-06-07statusdays on market $299,900 Active Under Contract 4 DOM
-
2026-06-04remarks 699-char remark
-
2026-06-04$299,900 Active 1 DOM
ⓘ Source: listings_history table (triggers on properties + properties_extension) + one-shot
backfill from property_details.listing_events for pre-trigger history.
Tax reassessment forecast MI · Partial reset (capped growth)
- Current annual tax
- $3,036 · $253/mo
- Projected year-2 tax
- $3,827 · $319/mo
- Expected delta
- +$791/yr (+$66/mo · 26.1%)
ⓘ Screening estimate from a state-policy table — verify with the county assessor before closing.
Climate risk First Street
- Flood 1/10 Low FEMA zone X (unshaded) · 0% chance over 30 yrs
- Wildfire 1/10 Low
- Heat 3/10 Moderate 7 d/yr ≥96°F today · 15 d/yr by 30 yrs out
- Wind 2/10 Low
- Air quality 2/10 Low 1 unhealthy d/yr today · 2 by 30 yrs out
Nearby sold comps map
Loading sold comps map…
Walkable amenities ~0.75 mi
Loading nearby amenities…
Taxation est. · year 1
- Rental income
- $35,660
- − Mortgage interest
- −$16,799
- − Property taxes
- −$3,036
- − Insurance
- −$1,500
- − Repairs & maintenance
- −$2,853
- − Management
- −$2,853
- − Depreciation
- −$8,724
- Taxable loss
- −$104
- Est. tax savings @ 24.0%
- +$25
- After-tax cash flow
- $4,789/yr
For passive investors: Depreciation is non-cash, so a rental often shows a tax loss while cash-flowing — sheltering income. Rental losses are passive: they offset passive income freely, and up to $25,000/yr can offset ordinary (W-2) income if you actively participate and your MAGI is under $100k (phasing out to $0 by $150k); unused losses carry forward. On sale, claimed depreciation is recaptured at up to 25%, and gains may owe capital-gains tax (a 1031 exchange can defer both). Figures are a year-1 estimate at your 24.0% rate — not tax advice; consult a CPA.
Schools (NCES district)
- District
- Brighton Area Schools
- NCES district ID
- 2606870
- Math proficiency
- 59% ▼ -3.00%
- Reading proficiency
- 69% ▼ -2.00%
- Median HH income
- $84,114
- Composite
- 57.62/100
- National rank
- #1062
- State rank
- #22 of 540 in MI
Livability — Brighton
- Score
- 78/100
- State rank
- #108
- US rank
- #2621
Category grades
Schools grade is shown separately in the Schools card above.
Census & demographics
- Census place
- Brighton, MI
- County
- Livingston County · 121,626 people
- City population
- 27,289
- Metro
- Detroit-Warren-Dearborn, MI
- Population (ZIP)
- 27,289
- Household income
- $106,763
- Rent vs Own
- Severe rent burden
- 495.0
Population outlook (Livingston County) Hauer SSP2
- Today (2025)
- 202,920 people
- By 2030
- 209,173 · +3.1%
- By 2040
- 216,878 · +6.9%
- By 2050
- 217,485 · +7.2%
- By 2075
- 217,590 · +7.2%
- By 2100
- 197,095 · -2.9%
Race, ethnicity, and origin ACS 2023
- Neighborhood character
- Predominantly White (93%)
- Race & ethnicity
- White 93% Two or more races 4% Hispanic / Latino 2% Asian 1%
- Common ancestry
- Romanian 12% Italian 6% Lithuanian 4%
- Foreign-born
- 4% · Canada, China
- Languages at home
- 96% English-only · Other Indo-European 1% German/W. Germanic 1% Russian/Polish/Slavic 1%
Political lean MEDSL · Livingston
- 2024 margin
- Strong R (+23.9) · D 37.4% · R 61.3% · Other 1.3%
- 2008→2024 swing
- -10.7pp toward R · 2008: -13.3pp · 2024: -23.9pp
- All cycles
- 2024: R+23.9 2020: R+22.6 2016: R+29.6 2012: R+23.3 2008: R+13.3
Not yet ingested
- Civics
- —
Market trends
- HPI YoY
- ▼ -300.62%
- Current HPI
- 183.6902
- Rent YoY
- —
- Metro
- Detroit-Warren-Dearborn, MI
- State GDP YoY
- ▲ 1.37%
- F500 in state
- 28
Industry mix (Fortune 500 HQ in MI)
| Industry | F500 HQs | Revenue |
|---|---|---|
| Automotive Parts | 3 | $48B |
|
||
| Automotive | 2 | $372B |
|
||
| Chemicals | 1 | $45B |
|
||
| Automotive Retail | 1 | $29B |
|
||
| Healthcare / Medical Devices | 1 | $23B |
|
||
| Automotive Technology | 1 | $20B |
|
||
Price history
+95.4% since first listed19 events — show timeline
- 2026-06-03 Listed $299,900 REALCOMP
- 2026-06-03 Listed $299,900 MiRealSource-MiMLS
- 2009-11-19 Sold (Public Records) $115,000 Public Records
- 2009-11-13 Sold (MLS) $115,000 REALCOMP
- 2009-08-02 Listed $127,500 REALCOMP
- 2004-12-10 Sold (Public Records) $160,000 Public Records
- 2004-11-24 Sold (MLS) $160,000 REALCOMP
- 2004-08-01 Listed $161,900 REALCOMP
- 2004-06-10 Listing Removed — REALCOMP
- 2004-05-11 Listed $165,500 REALCOMP
- 2004-05-10 Listing Removed — REALCOMP
- 2004-02-11 Listed $165,500 REALCOMP
- 2004-02-10 Listing Removed — REALCOMP
- 2003-11-10 Listing Removed — REALCOMP
- 2003-11-10 Listed $165,500 REALCOMP
- 2003-07-18 Listing Removed — REALCOMP
- 2003-07-18 Listed $169,500 REALCOMP
- 2003-05-30 Listed $174,999 REALCOMP
- 2001-10-31 Sold (Public Records) $153,500 Public Records
Property tax history
+2.3%/yrLatest (2025): $3,036 · -2.9% YoY. Source: county tax records.
Cash-flow waterfall
monthlySold comps — $/sqft
last 12 mo · ≤1 miLoading sold comps…