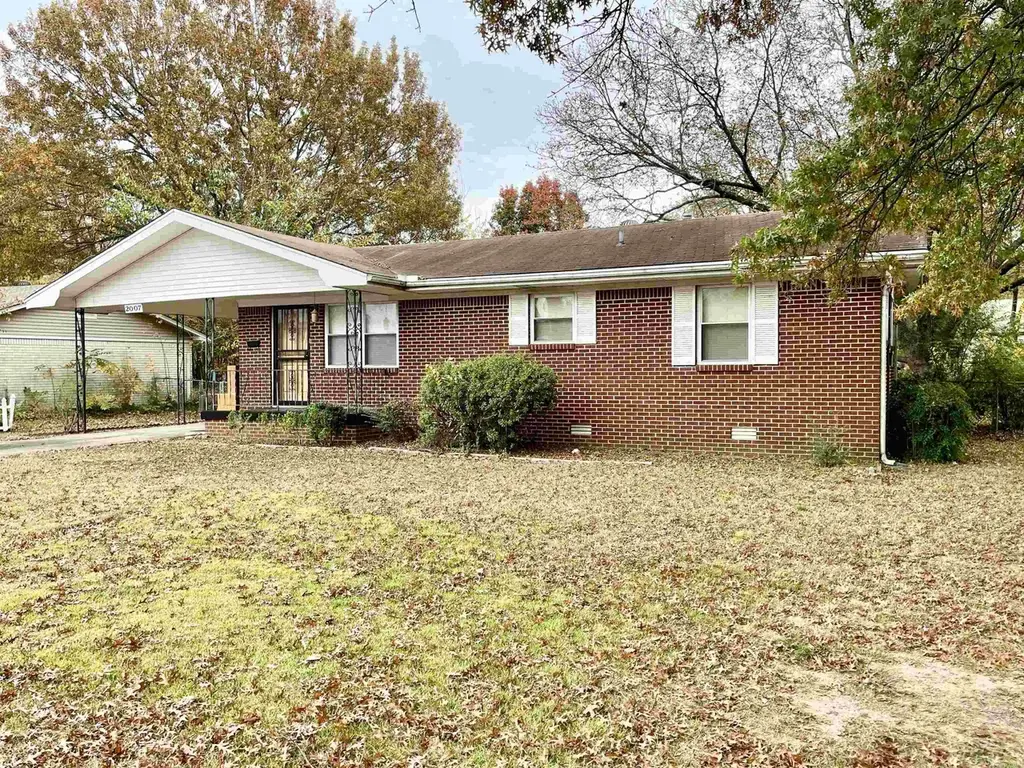
2007 Arkansas Ave · Conway, AR
Flood risk 1/10 · Minimal
- FEMA flood zone
- X (unshaded)
- Chance of flooding over 30 yrs
- 0.0%
- Est. flood insurance / yr
- $507 – $1,088
Fire risk 2/10 · Minimal
- Est. fire insurance / yr
- $1,499 – $2,785
Heat risk 6/10 · Moderate
- Hot days now (above 111°F)
- 7 days/yr
- Hot days in 30 yrs
- 19 days/yr
Wind risk 3/10 · Minor
- Chance of severe wind over 30 yrs
- 7.0%
Air-quality risk 2/10 · Minimal
- Unhealthy air days now
- 0 days/yr
- Unhealthy air days in 30 yrs
- 1 days/yr
Risk factors via First Street. Map © Google.
Why this score? — see what drove the C- grade
The composite is a weighted blend of 9 inputs, each scored 0–100. Each bar is that input's sub-score; the figure is the points it added to the 100-point composite (weight × sub-score).
- Cash flow +21.5/30.0
- ARV discount +9.3/15.0
- DSCR +6.9/10.0
- 1% rule +4.4/10.0
- Schools +3.8/10.0
- Livability +3.5/5.0
- Condition / age +2.5/5.0
- Rent growth +2.4/5.0
- Appreciation +0.0/10.0
$169,900
🖨 Deal sheet (PDF) 📄 Offer letter ✓ Due diligence
Listing remarks
Locaion, Location, Location!! Near the colleges!! Perfect for your home or investing for a rental! 3 Bedrooms 1 bath. Large Living Room. Kitchen/Dining room off the carport. Washer, Dryer, and Refrigerator conveys to the buyer!! There are 4 ceiling fans! Large backyard with a 12' X 14 ' storage or workshop. Also there is another storage/workshop at the end of the carport! Concrete Storm Celler just outside the back door!! Utilities are with Conway Corp!!! Tons of possibilities with this one.
Key facts
- Large backyard
- Large living room
- Storage or workshop
Tags
Property features AI
Finance
- Financial info: Potential financing: VA loan, FHA loan, conventional loan, or cash
- HOA & community: Community amenities include swimming pool(s), playground, and golf course
Exterior
- Parking: Carport
- Utilities: Public sewer; Public water; Electric via co-op; Natural gas; Cable TV available; Antenna and satellite TV options; Insulated windows; Attic turbo vent
- Home design: Brick exterior
- Construction: Crawl space foundation; Composition roof
- Exterior features: Porch; Fully fenced yard; Outside storage area; Guttering; Storm cellar; Chain link fencing; Paved road access; Level lot in a subdivision; Approx. lot size 130' x 80' (inside city limits)
Interior
- Kitchen: Microwave; Gas range; Surface range; Disposal; Wall oven; Refrigerator stays
- Flooring: Carpet; Laminate
- Bathrooms: 1 full bathroom
- Heating & cooling: Central gas heat; Central electric cooling
- Interior features: Washer connection and washer stays; Dryer connection (electric) and dryer stays; Gas water heater; Window treatments; Ceiling fans; Formica kitchen counters; Sheetrock and paneling walls; Sheetrock ceilings
- Laundry & utility: Washer and dryer connections; washer and dryer stay
Neighborhood map
What this means for you Summary
Snapshot
- This is a 3-bed/1.0-bath single-family listed at $170k.
Deal economics
- At list price, monthly cash flow is $255 ($3k/yr) — positive.
- The deal already cash-flows at list — no discount required.
- To meet the 1% rule (rent ≥ 1% of price), the offer needs to be $160k (5.6% below list).
- Recommended offer: $160k (5.6% below list) — sets the bar for 1% rule.
- Cap rate 8.1% vs local median 3.9% in Conway — top-decile yield for the area; either an underpriced asset or a hidden risk that comps aren't pricing in. Stress-test before assuming the spread holds.
Location & tenants
- Location reads 69/100 on livability (#71 in AR) — a middle-class / working-renter tenant base. Strengths: cost of living A+, housing A+, schools B; Watch: employment C-, crime F, amenities F.
- Conway School District (urban): math 43% / reading 47% proficiency, ranked #36 of 238 in AR (top 15%) — families likely to look elsewhere, expect single-tenant / working-renter base with shorter leases.
- Market conditions: Rents soft (-0.3%/yr); 262 active listings in the ZIP; 16 comparable units currently listed for rent nearby; rentals at typical pace (median 15d on market — plan ~3-4 weeks tenant-placement turnaround); 865 units permitted in Faulkner County in 2024 (451 in 5+ unit buildings).
Forward outlook
- Local home prices are declining (-3.0%/yr); year-one equity from $1k of loan paydown is wiped out by about $5k of value loss. Plan a longer hold.
- Faulkner County population projected at +32% by 2050 — long-run rental-demand tailwind backs the buy-and-hold thesis.
Negotiation context
- It's been on market 30 days — a 2% lower offer ($167k) is reasonable based on typical stale-listing flexibility.
- 2 sale attempts with the ask held roughly flat each time — persistent listings suggest the price (not the market) is what's stuck; bring a comps-based counter.
- Current owner paid $80k; list at $170k implies a 112% gain — meaningful room to come down on a strong offer.
Risks & watch-outs
- Climate carrying-cost: extreme-heat days projected 7→19/yr by 2055 (HVAC capex compounding) — expect insurance premiums to compound above CPI over the hold.
Questions for the listing agent
- Built in 1969 — when were the roof, HVAC, electrical panel, plumbing, and water heater last replaced?
- Is there a deadline driving the sale (1031 exchange, divorce, estate, relocation)? That informs how much negotiation room exists.
- Schools are B-rated — typically a magnet for longer-tenancy family renters. What's the average tenant stay here, and is there a school-zone premium baked into asking?
- Crime grade is F in this area — have there been break-ins, vandalism, or insurance claims at this property in the last 3 years? What carrier currently insures it and at what premium?
- What's the average days-on-market for RENTAL listings here right now (not sales)? A rising rental-DOM trend means longer vacancies and softer asking-rent achievability than the comps imply.
- What's the recent tenant-quality profile in this submarket — average credit score on applications, eviction rate, late-payment / NSF rate, and stable-employment percentage? A property-management company in the area should have these aggregated.
- How much new for-sale + rental construction is in the pipeline within 1–3 miles? Heavy new supply typically softens prices + rents 12–24 months out; constrained supply supports both.
Investment metrics
- 1% rule
- 0.94% ✗
- Cap rate
- 8.09%
- Cash-on-cash
- 6.43%
- DSCR
- 1.29
- GRM
- 8.8
CMA / ARV
- ARV (on-the-fly)
- $176,936
- Comps found
- 12
Show comp detail 12 sales within ~0.75 mi
| Address | Dist | Beds/Ba | Sqft | Sold | Price | $/sf | Match |
|---|---|---|---|---|---|---|---|
| 2107 Broadview Ave | 0.16mi | 3/2.0 | 1,275 (-2%) | 4mo | $190,700 | $150 | 81 |
| 1314 Mitchell St | 0.23mi | 3/2.0 | 1,247 (-4%) | 1mo | $215,000 | $172 | 77 |
| 2207 Independence | 0.25mi | 3/1.0 | 1,385 (+6%) | 2mo | $189,000 | $136 | 76 |
| 2109 Arkansas Ave | 0.17mi | 3/1.5 | 1,412 (+8%) | 2mo | $140,000 | $99 | 75 |
| 1324 Eastfield Dr | 0.23mi | 3/1.0 | 1,196 (-8%) | 2mo | $193,000 | $161 | 74 |
| 1834 Johnston | 0.21mi | 4/2.0 (+1) | 1,346 (+4%) | 2mo | $173,000 | $129 | 74 |
| 1309 Clifton St | 0.40mi | 3/1.0 | 1,215 (-7%) | 3mo | $155,000 | $128 | 67 |
| 2104 West St | 0.52mi | 3/2.0 | 1,389 (+7%) | 4mo | $140,000 | $101 | 57 |
| 2207 Broadview Ave | 0.27mi | 4/2.0 (+1) | 1,460 (+12%) | 4mo | $230,000 | $158 | 55 |
| 2120 Duncan St | 0.45mi | 4/1.0 (+1) | 1,176 (-10%) | 4mo | $159,000 | $135 | 55 |
| 1307 Sunset Dr | 0.63mi | 4/2.0 (+1) | 1,236 (-5%) | 4mo | $130,000 | $105 | 50 |
| 2485 Crestwood Ct | 0.72mi | 3/2.0 | 1,430 (+10%) | 1mo | $207,500 | $145 | 45 |
Match score weights: distance 35% · size 25% · config 20% · recency 20%. Top-matched comps best support the ARV.
Projected returns pro-forma
-3.0% appreciation · 0.0% rent growth · sell at horizon
- IRR
- -9.5%
- Equity multiple
- 0.66×
- Total profit
- $-16,070
- Equity at exit
- $25,333
- IRR
- -4.2%
- Equity multiple
- 0.76×
- Total profit
- $-11,558
- Equity at exit
- $14,690
Cash invested: $47,572 (down + closing). Projections, not guarantees.
Landlord ↔ Tenant lean methodology
- Overall (STATE)
- 92 Strongly Landlord-Friendly
- State Arkansas
- 92 Strongly Landlord-Friendly · R+14
- County
- — inherits STATE
- City
- — inherits STATE
ZIP-level market 72034
- Rents YoY
- -0.3%
- Active inventory
- 262
- Price-to-rent
- 8.8×
Monthly cashflow live
- Estimated rent
- $1,604 high interval (Pro) →
- Mortgage (P&I)
- −$891
- Tax from tax record
- −$50 /mo · $604/yr
- Insurance
- −$71
- HOA
- −$0
- Vacancy / Maint / Mgmt
- −$337
- Net cashflow
- $255
Break-even live
Sensitivity live
| Price | -10% $351 | -5% $303 | +0% $255 | +5% $207 | +10% $159 |
|---|---|---|---|---|---|
| Rent | -10% $128 | -5% $192 | +0% $255 | +5% $318 | +10% $382 |
| Rate | -1.0pp $340 | -0.5pp $298 | base $255 | +0.5pp $211 | +1.0pp $166 |
UW: 25.0% down · 7.5% · 30yr · 1.5% tax · 5.0% vac · 8.0% maint · 8.0% mgmt
Financing live
Cash to close
- Down payment
- $42,475
- Closing costs
- $5,097
- Reserves months
- —
- Total cash needed
- —
Loan-product check · same deal, 3 products live
Conventional
25% down · 7.5% · 30yr
- Down + closing
- —
- Monthly P&I
- —
- Monthly cashflow
- —
- DSCR
- —
- Eligible?
- —
Personal DTI + credit; lowest rate.
DSCR
20% down · 8.5% · 30yr
- Down + closing
- —
- Monthly P&I
- —
- Monthly cashflow
- —
- DSCR
- —
- Eligible?
- —
No personal income docs; deal must DSCR.
Hard money
10% down · 12.0% · 12mo
- Down + closing
- —
- Monthly P&I
- —
- Monthly cashflow
- —
- DSCR
- —
- Eligible?
- —
Short-term bridge; refi at stabilization.
Rent comps 16 comps
| Address | Beds | Baths | Sqft | Rent | $/sqft | DOM | Units | Dist |
|---|---|---|---|---|---|---|---|---|
| 2004 Hairston St Conway, AR | 3.0 | 2.0 | 1703 | $2,650 | $1.56 | 24d | 1 | 0.04mi |
| 1404 Donaghey Ave Conway, AR | 3.0 | 1.0 | 1056 | $1,125 | $1.07 | 14d | 1 | 0.13mi |
| 1305 Clifton St Conway, AR | 3.0 | 1.0 | 1215 | $985 | $0.81 | 14d | 1 | 0.42mi |
| 1230 Clifton St Unit 3 Conway, AR | 2.0 | 1.5 | 881 | $880 | $1.00 | 14d | 1 | 0.48mi |
| 1948 Cambridge Village Dr Conway, AR | 3.0 | 2.0 | 1502 | $1,500 | $1.00 | 14d | 1 | 0.71mi |
| 1940 Cambridge Village Dr Conway, AR | 3.0 | 2.0 | 1502 | $1,500 | $1.00 | 14d | 1 | 0.71mi |
| 1835 Ott Memorial Dr Conway, AR | 2.0 | 2.0 | 857 | $912 | $1.06 | 14d | 5 | 0.76mi |
| 2415 Washington Ave Unit A-4 Conway, AR | 2.0 | 1.5 | 885 | $850 | $0.96 | 24d | 1 | 0.78mi |
| 2415 Washington Ave Unit C-2 Conway, AR | 2.0 | 1.5 | 885 | $825 | $0.93 | 14d | 1 | 0.78mi |
| 2550 Morse Dr Conway, AR | 3.0 | 2.0 | 1462 | $1,500 | $1.03 | 14d | 1 | 0.98mi |
| 867 Fendley Dr Conway, AR | 1.0–3.0 | 1.0–2.0 | 957 | $1,198 | $1.25 | 14d | 5 | 1.00mi |
| 2340 Linda Dr Conway, AR | 3.0 | 2.0 | 1249 | $1,650 | $1.32 | 24d | 1 | 1.03mi |
| 2905 Billy Jack Dr Conway, AR | 2.0 | 2.0 | 1120 | $1,245 | $1.11 | 14d | 2 | 1.29mi |
| 2515 Martin St Conway, AR | 2.0 | 2.0 | 960 | $850 | $0.89 | 14d | 5 | 1.42mi |
| 513 3rd St Conway, AR | 3.0 | 2.0 | 1428 | $1,250 | $0.88 | 24d | 1 | 1.42mi |
| 235 Oliver St Conway, AR | 3.0 | 2.0 | 1414 | $1,450 | $1.03 | 24d | 1 | 1.45mi |
Listing history 20 events
-
2026-06-18days on market $169,900 Active 30 DOM
-
2026-06-17days on market $169,900 Active 29 DOM
-
2026-06-16days on market $169,900 Active 28 DOM
-
2026-06-15days on market $169,900 Active 27 DOM
-
2026-06-14days on market $169,900 Active 25 DOM
-
2026-06-10days on market $169,900 Active 22 DOM
-
2026-06-09days on market $169,900 Active 21 DOM
-
2026-06-08days on market $169,900 Active 20 DOM
-
2026-06-07days on market $169,900 Active 19 DOM
-
2026-06-03days on market $169,900 Active 15 DOM
-
2026-06-02days on market $169,900 Active 14 DOM
-
2026-06-01days on market $169,900 Active 13 DOM
-
2026-05-31days on market $169,900 Active 12 DOM
-
2026-05-31days on market $169,900 Active 11 DOM
-
2026-05-19$169,900 New Listing
-
2026-05-19historical
-
2026-04-18price $169,900
-
2026-03-10price $179,900
-
2025-11-18$185,000 New Listing
-
2012-05-07soldstatus $80,000
ⓘ Source: listings_history table (triggers on properties + properties_extension) + one-shot
backfill from property_details.listing_events for pre-trigger history.
Tax reassessment forecast AR · Resets to sale price
- Current annual tax
- $604 · $50/mo
- Projected year-2 tax
- $1,087 · $91/mo
- Expected delta
- +$484/yr (+$40/mo · 80.1%)
ⓘ Screening estimate from a state-policy table — verify with the county assessor before closing.
Climate risk First Street
- Flood 1/10 Low FEMA zone X (unshaded) · 0% chance over 30 yrs
- Wildfire 2/10 Low
- Heat 6/10 Major 7 d/yr ≥111°F today · 19 d/yr by 30 yrs out
- Wind 3/10 Moderate 7% chance of damaging wind over 30 yrs
- Air quality 2/10 Low 0 unhealthy d/yr today · 1 by 30 yrs out
Nearby sold comps map
Loading sold comps map…
Walkable amenities ~0.75 mi
Loading nearby amenities…
Taxation est. · year 1
- Rental income
- $19,246
- − Mortgage interest
- −$9,517
- − Property taxes
- −$604
- − Insurance
- −$850
- − Repairs & maintenance
- −$1,540
- − Management
- −$1,540
- − Depreciation
- −$4,943
- Taxable income
- $253
- Est. tax owed @ 24.0%
- −$61
- After-tax cash flow
- $2,998/yr
For passive investors: Depreciation is non-cash, so a rental often shows a tax loss while cash-flowing — sheltering income. Rental losses are passive: they offset passive income freely, and up to $25,000/yr can offset ordinary (W-2) income if you actively participate and your MAGI is under $100k (phasing out to $0 by $150k); unused losses carry forward. On sale, claimed depreciation is recaptured at up to 25%, and gains may owe capital-gains tax (a 1031 exchange can defer both). Figures are a year-1 estimate at your 24.0% rate — not tax advice; consult a CPA.
Schools (NCES district)
- District
- Conway School District
- NCES district ID
- 0504590
- Math proficiency
- 43% ▼ -17.00%
- Reading proficiency
- 47% ▼ -9.00%
- Median HH income
- $46,270
- Composite
- 38.27/100
- National rank
- #4236
- State rank
- #36 of 238 in AR
Livability — Conway
- Score
- 69/100
- State rank
- #71
- US rank
- #8673
Category grades
Schools grade is shown separately in the Schools card above.
Census & demographics
- Census place
- Conway, AR
- County
- Faulkner County · 103,634 people
- City population
- 84,754
- Metro
- Little Rock-North Little Rock-Conway, AR
- Population (ZIP)
- 50,285
- Household income
- $65,635
- Rent vs Own
- Severe rent burden
- 2282.0
Population outlook (Faulkner County) Hauer SSP2
- Today (2025)
- 138,985 people
- By 2030
- 148,264 · +6.7%
- By 2040
- 166,010 · +19.4%
- By 2050
- 183,362 · +31.9%
- By 2075
- 224,593 · +61.6%
- By 2100
- 250,603 · +80.3%
Race, ethnicity, and origin ACS 2023
- Neighborhood character
- Predominantly White (71%)
- Race & ethnicity
- White 71% Black 17% Hispanic / Latino 5% Two or more races 5% Asian 2%
- Hispanic origin (detail)
- Mexican 3%
- Common ancestry
- Slovak 2% Lithuanian 2% Italian 1%
- Foreign-born
- 4% · Canada, South Korea
- Languages at home
- 94% English-only · Spanish 3% Korean 1%
Political lean MEDSL · Faulkner
- 2024 margin
- Solid R (+32.3) · D 32.6% · R 64.9% · Other 2.5%
- 2008→2024 swing
- -7.1pp toward R · 2008: -25.3pp · 2024: -32.3pp
- All cycles
- 2024: R+32.3 2020: R+29.5 2016: R+31.6 2012: R+31.7 2008: R+25.3
Not yet ingested
- Civics
- —
Market trends
- HPI YoY
- ▼ -122.99%
- Current HPI
- 225.7805
- Rent YoY
- ▼ -0.28%
- Metro
- Little Rock-North Little Rock-Conway, AR
- State GDP YoY
- ▲ 3.80%
- F500 in state
- 10
Industry mix (Fortune 500 HQ in AR)
| Industry | F500 HQs | Revenue |
|---|---|---|
| Retail | 1 | $681B |
|
||
| Food / Agriculture | 1 | $53B |
|
||
| Retail / Energy | 1 | $22B |
|
||
| Transportation / Logistics | 1 | $12B |
|
||
| Energy | 1 | $4B |
|
||
Price history
+112.4% since first listed6 events — show timeline
- 2026-05-19 Listed $169,900 CARMLS
- 2026-05-19 Listing Removed — CARMLS
- 2026-04-18 Price Changed $169,900 CARMLS
- 2026-03-10 Price Changed $179,900 CARMLS
- 2025-11-18 Listed $185,000 CARMLS
- 2012-05-07 Sold (Public Records) $80,000 Public Records
Property tax history
+0.0%/yrLatest (2025): $604 · -7.0% YoY. Source: county tax records.
Cash-flow waterfall
monthlySold comps — $/sqft
last 12 mo · ≤1 miLoading sold comps…