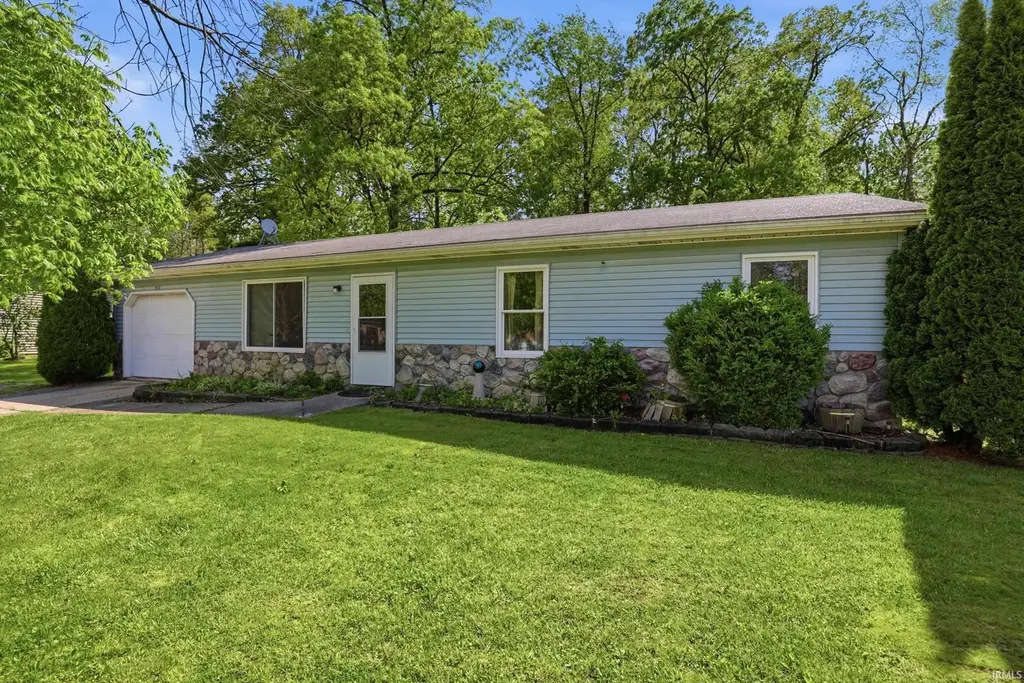
512 N Mckinley St · Angola, IN
Flood risk 6/10 · Moderate
- FEMA flood zone
- X (unshaded)
- Chance of flooding over 30 yrs
- 0.74%
- Est. flood insurance / yr
- $507 – $1,088
Fire risk 3/10 · Minor
- Est. fire insurance / yr
- $717 – $1,331
Heat risk 2/10 · Minimal
- Hot days now (above 99°F)
- 7 days/yr
- Hot days in 30 yrs
- 15 days/yr
Wind risk 2/10 · Minimal
- Chance of severe wind over 30 yrs
- —
Air-quality risk 2/10 · Minimal
- Unhealthy air days now
- 1 days/yr
- Unhealthy air days in 30 yrs
- 2 days/yr
Risk factors via First Street. Map © Google.
Why this score? — see what drove the D grade
The composite is a weighted blend of 9 inputs, each scored 0–100. Each bar is that input's sub-score; the figure is the points it added to the 100-point composite (weight × sub-score).
- Cash flow +12.9/30.0
- ARV discount +10.7/15.0
- Schools +5.0/10.0
- DSCR +3.9/10.0
- Livability +3.3/5.0
- 1% rule +2.6/10.0
- Rent growth +2.5/5.0
- Condition / age +2.5/5.0
- Appreciation +0.0/10.0
$190,000
🖨 Deal sheet (PDF) 📄 Offer letter ✓ Due diligence
Listing remarks
Come see this 3-bedroom, 1 bath home with a 1-car garage and wood privacy fence. Conveniently located near restaurants, shopping, and Trine University. The home offers solid potential for an owner-occupant or investor willing to put in some TLC. Major mechanical updates include a water heater that is 4 years old, HVAC system that is 3 years old, and AC unit that is 5 years old. Fenced backyard provides added privacy and space to enjoy outdoors. Great opportunity to make it your own.
Key facts
- Wood privacy fence
- Fenced backyard
- 0.25 acre lot
Tags
Property features AI
Exterior
- Parking: Attached garage (1 car)
- Utilities: Public water; Public sewer
- Home design: Single-family residence, site-built; Single-story
- Construction: Stone and vinyl siding exterior; Shingle roof; Slab with concrete perimeter foundation; Built as site-built home
- Exterior features: Wood fencing; Wooded lot
Interior
- Kitchen: Dishwasher; Microwave; Refrigerator; Electric range/oven
- Flooring: Carpet; Vinyl
- Bathrooms: 1 full bathroom (main level)
- Heating & cooling: Forced air heating; Central air conditioning
- Interior features: Window treatments; One fireplace
- Laundry & utility: Washer and dryer included; Laundry on main level
Neighborhood map
What this means for you Summary
Snapshot
- This is a 3-bed/1.0-bath single-family listed at $190k.
Deal economics
- At list price, monthly cash flow is $-14 ($-169/yr) — negative.
- To cash-flow at today's rent, offer at most $188k (1.3% below list).
- To meet the 1% rule (rent ≥ 1% of price), the offer needs to be $144k (24.0% below list).
- Recommended offer: $144k (24.0% below list) — sets the bar for 1% rule.
- Cap rate 6.2% vs local median 3.7% in Angola — top-decile yield for the area; either an underpriced asset or a hidden risk that comps aren't pricing in. Stress-test before assuming the spread holds.
Location & tenants
- Location reads 66/100 on livability (#309 in IN) — a middle-class / working-renter tenant base. Strengths: cost of living A+, housing A+, crime B+; Watch: schools D, amenities F, commute F.
- Market conditions: 10 active listings in the ZIP; 4 comparable units currently listed for rent nearby; rentals lingering (median 44d on market — plan ~5-8 weeks vacancy on turnover, expect pricing pressure); 75% of comp listings sitting > 30 days — soft ceiling on asking rent; 209 units permitted in Steuben County in 2024 (72 in 5+ unit buildings).
Forward outlook
- Local home prices are declining (-3.0%/yr); year-one equity from $1k of loan paydown is wiped out by about $6k of value loss. Plan a longer hold.
- Steuben County population projected at -13% by 2050 — secular population decline; favor cash flow + early exit over multi-decade hold.
Negotiation context
- It's been on market 27 days — a 2% lower offer ($187k) is reasonable based on typical stale-listing flexibility.
- 2 sale attempts since 9y ago with the ask held roughly flat each time — persistent listings suggest the price (not the market) is what's stuck; bring a comps-based counter.
Risks & watch-outs
- Climate carrying-cost: major flood risk — expect insurance premiums to compound above CPI over the hold.
Questions for the listing agent
- What do current leases actually rent for vs. the listed asking? Can we see a recent rent roll and the last 12 months of T-12 income?
- Is there a deadline driving the sale (1031 exchange, divorce, estate, relocation)? That informs how much negotiation room exists.
- Schools are D-rated, which usually means shorter tenancies and higher turnover. Who's the typical renter profile here, and what's been the actual vacancy rate?
- The area grade is low — what's the realistic commute time and amenity access for the typical tenant pool here? Any planned neighborhood developments (good or bad) we should know about?
- What's the average days-on-market for RENTAL listings here right now (not sales)? A rising rental-DOM trend means longer vacancies and softer asking-rent achievability than the comps imply.
- What's the recent tenant-quality profile in this submarket — average credit score on applications, eviction rate, late-payment / NSF rate, and stable-employment percentage? A property-management company in the area should have these aggregated.
- How much new for-sale + rental construction is in the pipeline within 1–3 miles? Heavy new supply typically softens prices + rents 12–24 months out; constrained supply supports both.
Investment metrics
- 1% rule
- 0.76% ✗
- Cap rate
- 6.20%
- Cash-on-cash
- -0.32%
- DSCR
- 0.99
- GRM
- 11.0
CMA / ARV
- ARV (on-the-fly)
- $204,624
- Comps found
- 6
Show comp detail 6 sales within ~0.75 mi
| Address | Dist | Beds/Ba | Sqft | Sold | Price | $/sf | Match |
|---|---|---|---|---|---|---|---|
| 412 N Mckinley St | 0.10mi | 2/1.0 (-1) | 992 (-2%) | 1mo | $220,000 | $222 | 87 |
| 1109 Manahan Dr | 0.13mi | 3/1.0 | 1,008 (0%) | 12mo | $205,000 | $203 | 84 |
| 421 Manahan Dr | 0.08mi | 3/2.0 | 1,150 (+14%) | 6mo | $205,000 | $178 | 64 |
| 301 Fieldcrest Dr | 0.27mi | 3/1.0 | 936 (-7%) | 20mo | $163,000 | $174 | 59 |
| 303 Fieldcrest Dr | 0.26mi | 2/1.0 (-1) | 900 (-11%) | 12mo | $153,250 | $170 | 55 |
| 1108 Manahan Dr | 0.16mi | 3/2.0 | 1,132 (+12%) | 18mo | $243,000 | $215 | 53 |
Match score weights: distance 35% · size 25% · config 20% · recency 20%. Top-matched comps best support the ARV.
Projected returns pro-forma
-3.0% appreciation · 3.0% rent growth · sell at horizon
- IRR
- -16.9%
- Equity multiple
- 0.40×
- Total profit
- $-31,758
- Equity at exit
- $28,330
- IRR
- -8.8%
- Equity multiple
- 0.45×
- Total profit
- $-29,111
- Equity at exit
- $16,428
Cash invested: $53,200 (down + closing). Projections, not guarantees.
Landlord ↔ Tenant lean methodology
- Overall (STATE)
- 90 Strongly Landlord-Friendly
- State Indiana
- 90 Strongly Landlord-Friendly · R+11
- County
- — inherits STATE
- City
- — inherits STATE
ZIP-level market 46703
- Home prices YoY
- -27.1%
- Active inventory
- 10
- Price-to-rent
- 11.0×
Monthly cashflow live
- Estimated rent
- $1,445 medium interval (Pro) →
- Mortgage (P&I)
- −$996
- Tax from tax record
- −$80 /mo · $960/yr
- Insurance
- −$79
- HOA
- −$0
- Vacancy / Maint / Mgmt
- −$303
- Net cashflow
- $-14
Break-even live
Sensitivity live
| Price | -10% $94 | -5% $40 | +0% $-14 | +5% $-68 | +10% $-122 |
|---|---|---|---|---|---|
| Rent | -10% $-128 | -5% $-71 | +0% $-14 | +5% $43 | +10% $100 |
| Rate | -1.0pp $82 | -0.5pp $34 | base $-14 | +0.5pp $-63 | +1.0pp $-113 |
UW: 25.0% down · 7.5% · 30yr · 1.5% tax · 5.0% vac · 8.0% maint · 8.0% mgmt
Financing live
Cash to close
- Down payment
- $47,500
- Closing costs
- $5,700
- Reserves months
- —
- Total cash needed
- —
Loan-product check · same deal, 3 products live
Conventional
25% down · 7.5% · 30yr
- Down + closing
- —
- Monthly P&I
- —
- Monthly cashflow
- —
- DSCR
- —
- Eligible?
- —
Personal DTI + credit; lowest rate.
DSCR
20% down · 8.5% · 30yr
- Down + closing
- —
- Monthly P&I
- —
- Monthly cashflow
- —
- DSCR
- —
- Eligible?
- —
No personal income docs; deal must DSCR.
Hard money
10% down · 12.0% · 12mo
- Down + closing
- —
- Monthly P&I
- —
- Monthly cashflow
- —
- DSCR
- —
- Eligible?
- —
Short-term bridge; refi at stabilization.
Rent comps 4 comps
| Address | Beds | Baths | Sqft | Rent | $/sqft | DOM | Units | Dist |
|---|---|---|---|---|---|---|---|---|
| 125 McKinley St Angola, IN | 2.0 | 1.0–2.0 | 746 | $1,699 | $2.28 | 44d | 23 | 0.25mi |
| 209 S West St Unit 2 Angola, IN | 2.0 | 1.0 | 700 | $795 | $1.14 | 44d | 1 | 0.75mi |
| 607 Apple Hill Way Angola, IN | 2.0 | 2.0 | 1200 | $1,695 | $1.41 | 44d | 1 | 1.07mi |
| 1700 N Wayne St Angola, IN | 1.0–2.0 | 1.0 | 712 | $1,371 | $1.93 | 14d | 8 | 1.26mi |
Listing history 14 events
-
2026-06-17days on market $190,000 Active 27 DOM
-
2026-06-16days on market $190,000 Active 26 DOM
-
2026-06-15days on market $190,000 Active 25 DOM
-
2026-06-13days on market $190,000 Active 23 DOM
-
2026-06-12days on market $190,000 Active 22 DOM
-
2026-06-09days on market $190,000 Active 19 DOM
-
2026-06-08days on market $190,000 Active 18 DOM
-
2026-06-07days on market $190,000 Active 17 DOM
-
2026-06-04days on market $190,000 Active 13 DOM
-
2026-06-02days on market $190,000 Active 12 DOM
-
2026-06-01days on market $190,000 Active 11 DOM
-
2026-05-31days on market $190,000 Active 10 DOM
-
2026-05-21$190,000 Active
-
2017-08-03$112,500
ⓘ Source: listings_history table (triggers on properties + properties_extension) + one-shot
backfill from property_details.listing_events for pre-trigger history.
Tax reassessment forecast IN · Partial reset (capped growth)
- Current annual tax
- $960 · $80/mo
- Projected year-2 tax
- $1,287 · $107/mo
- Expected delta
- +$328/yr (+$27/mo · 34.2%)
ⓘ Screening estimate from a state-policy table — verify with the county assessor before closing.
Climate risk First Street
- Flood 6/10 Major FEMA zone X (unshaded) · 74% chance over 30 yrs
- Wildfire 3/10 Moderate
- Heat 2/10 Low 7 d/yr ≥99°F today · 15 d/yr by 30 yrs out
- Wind 2/10 Low
- Air quality 2/10 Low 1 unhealthy d/yr today · 2 by 30 yrs out
Nearby sold comps map
Loading sold comps map…
Walkable amenities ~0.75 mi
Loading nearby amenities…
Taxation est. · year 1
- Rental income
- $17,339
- − Mortgage interest
- −$10,643
- − Property taxes
- −$960
- − Insurance
- −$950
- − Repairs & maintenance
- −$1,387
- − Management
- −$1,387
- − Depreciation
- −$5,527
- Taxable loss
- −$3,515
- Est. tax savings @ 24.0%
- +$844
- After-tax cash flow
- $675/yr
For passive investors: Depreciation is non-cash, so a rental often shows a tax loss while cash-flowing — sheltering income. Rental losses are passive: they offset passive income freely, and up to $25,000/yr can offset ordinary (W-2) income if you actively participate and your MAGI is under $100k (phasing out to $0 by $150k); unused losses carry forward. On sale, claimed depreciation is recaptured at up to 25%, and gains may owe capital-gains tax (a 1031 exchange can defer both). Figures are a year-1 estimate at your 24.0% rate — not tax advice; consult a CPA.
Schools (NCES district)
No district data.
Livability — Angola
- Score
- 66/100
- State rank
- #309
- US rank
- #12201
Category grades
Schools grade is shown separately in the Schools card above.
Census & demographics
- Census place
- Angola, IN
- County
- Steuben County · 18,572 people
- City population
- 18,572
- Metro
- Angola, IN
- Population (ZIP)
- 18,572
- Household income
- $74,569
- Rent vs Own
- Severe rent burden
- 433.0
Population outlook (Steuben County) Hauer SSP2
- Today (2025)
- 34,334 people
- By 2030
- 33,801 · -1.6%
- By 2040
- 32,076 · -6.6%
- By 2050
- 30,022 · -12.6%
- By 2075
- 25,626 · -25.4%
- By 2100
- 21,257 · -38.1%
Race, ethnicity, and origin ACS 2023
- Neighborhood character
- Predominantly White (90%)
- Race & ethnicity
- White 90% Hispanic / Latino 6% Two or more races 5% Black 1%
- Hispanic origin (detail)
- Mexican 4%
- Common ancestry
- Romanian 3% Lithuanian 2% Slovak 2%
- Foreign-born
- 2% · Canada
- Languages at home
- 96% English-only · Spanish 2% Other Indo-European 1%
Political lean MEDSL · Steuben
- 2024 margin
- Solid R (+42.1) · D 28.1% · R 70.2% · Other 1.6%
- 2008→2024 swing
- -32.3pp toward R · 2008: -9.8pp · 2024: -42.1pp
- All cycles
- 2024: R+42.1 2020: R+42.2 2016: R+44.0 2012: R+27.0 2008: R+9.8
Not yet ingested
- Civics
- —
Market trends
- HPI YoY
- ▼ -78.35%
- Current HPI
- 211.2495
- Rent YoY
- —
- Metro
- Angola, IN
- State GDP YoY
- ▲ 2.90%
- F500 in state
- 18
Industry mix (Fortune 500 HQ in IN)
| Industry | F500 HQs | Revenue |
|---|---|---|
| Industrial Machinery | 2 | $37B |
|
||
| Healthcare | 1 | $177B |
|
||
| Pharmaceuticals | 1 | $45B |
|
||
| Metals / Steel | 1 | $18B |
|
||
| Agriculture | 1 | $17B |
|
||
| Packaging | 1 | $12B |
|
||
Price history
+68.9% since first listed2 events — show timeline
- 2026-05-21 Listed $190,000 IRMLS
- 2017-08-03 Listed $112,500 IRMLS
Property tax history
+10.5%/yrLatest (2024): $960 · +13.9% YoY. Source: county tax records.
Cash-flow waterfall
monthlySold comps — $/sqft
last 12 mo · ≤1 miLoading sold comps…