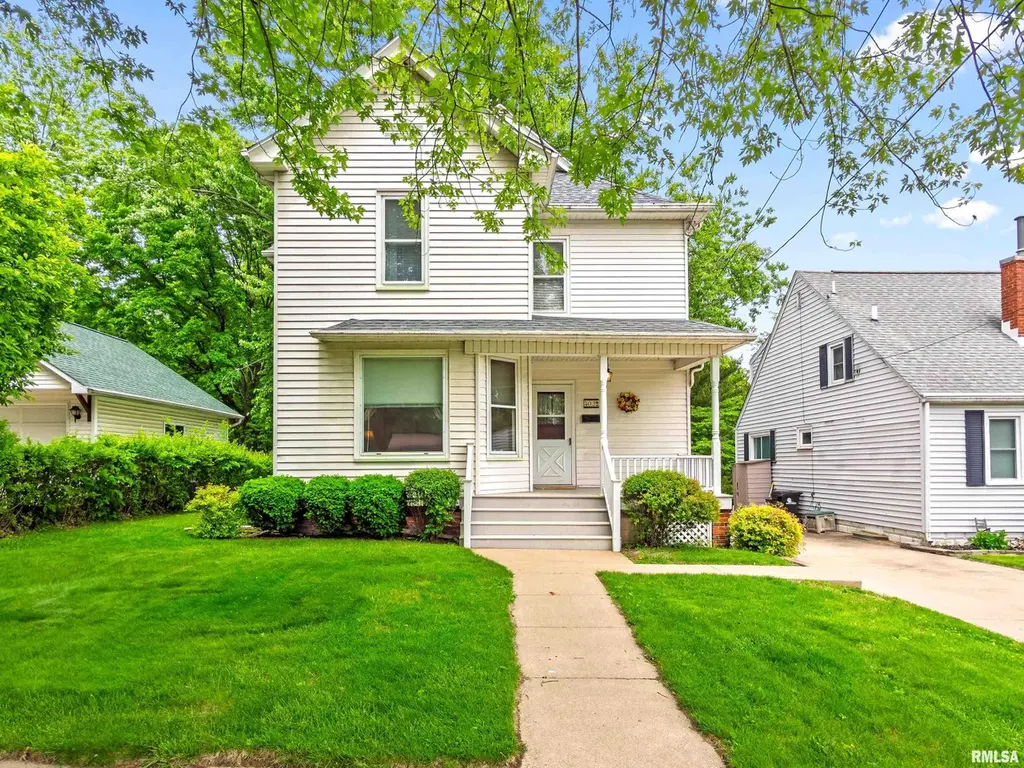
403 W Adams St · Washington, IL
Flood risk 1/10 · Minimal
- FEMA flood zone
- X (unshaded)
- Chance of flooding over 30 yrs
- 0.0%
- Est. flood insurance / yr
- $473 – $860
Fire risk 1/10 · Minimal
- Est. fire insurance / yr
- $804 – $1,492
Heat risk 3/10 · Minor
- Hot days now (above 104°F)
- 7 days/yr
- Hot days in 30 yrs
- 18 days/yr
Wind risk 2/10 · Minimal
- Chance of severe wind over 30 yrs
- 1.0%
Air-quality risk 2/10 · Minimal
- Unhealthy air days now
- 1 days/yr
- Unhealthy air days in 30 yrs
- 1 days/yr
Risk factors via First Street. Map © Google.
Why this score? — see what drove the B- grade
The composite is a weighted blend of 9 inputs, each scored 0–100. Each bar is that input's sub-score; the figure is the points it added to the 100-point composite (weight × sub-score).
- Cash flow +30.0/30.0
- DSCR +10.0/10.0
- 1% rule +8.8/10.0
- ARV discount +7.8/15.0
- Schools +3.8/10.0
- Livability +3.7/5.0
- Rent growth +2.5/5.0
- Condition / age +2.5/5.0
- Appreciation +0.0/10.0
$200,000
🖨 Deal sheet 📄 Offer letter ✓ Due diligence
Listing remarks
Don’t miss your chance to own this beautiful, well-maintained home in a fabulous location in Washington! This charming 3-bedroom, 2-full-bath home is filled with character and warmth throughout. The eat-in kitchen features sliding doors that open to a spacious deck overlooking a beautiful tree-lined backyard, perfect for relaxing or entertaining. Thoughtful updates make this home truly move-in ready, including a new roof and chimney (2023), updated shower (2022), dishwasher (2025), and updated electrical (2026). Conveniently located within walking distance to the historic square, Five Points, Lincoln Grade School, Washington Community High School as well as local parks and trails. Wit
Key facts
- New chimney
- Spacious deck
- Tree-lined backyard
Tags
Property features AI
Exterior
- Parking: On-street parking (paved)
- Utilities: Public water; Public sewer
- Home design: Single family residence; Two levels; Built in 1898
- Construction: Shingle roof; Original construction (not new)
- Exterior features: Level, wooded lot; Paved road access; Shingle roof
Interior
- Kitchen: Kitchen with tile flooring
- Bedrooms: Three bedrooms (all with egress windows); Upper level bedrooms: approx. 13.04 x 8.03, 13.02 x 12.01, and 13.02 x 11.07 (dimensions listed where provided)
- Flooring: Carpet in bedrooms, living room, dining room, and office; Tile in kitchen
- Bathrooms: Two full bathrooms
- Heating & cooling: Central air conditioning; Forced air heating
- Interior features: Full basement; No fireplaces reported
- Laundry & utility: Main level laundry; Gas water heater
Neighborhood map
What this means for you Summary
Snapshot
- This is a 4-bed/2.0-bath single-family listed at $200k.
Deal economics
- At list price, monthly cash flow is $859 ($10k/yr) — positive.
- The deal already cash-flows at list — no discount required.
- Meets the 1% rule at list price ($3k rent vs $200k).
- Cap rate 11.4% vs local median 3.2% in Washington — top-decile yield for the area; either an underpriced asset or a hidden risk that comps aren't pricing in. Stress-test before assuming the spread holds.
Location & tenants
- Location reads 73/100 on livability (#272 in IL) — a middle-class / working-renter tenant base. Strengths: crime A+, employment A+, cost of living A+; Watch: amenities F, commute F, health & safety F.
- Washington Chsd 308 (suburban): math 42% / reading 42% proficiency, ranked #112 of 620 in IL (top 18%) — families likely to look elsewhere, expect single-tenant / working-renter base with shorter leases.
- Zoned schools: Washington Comm High School (math 42% / reading 42%, grade F, #76 of 693 statewide, top 12%, 1,484 students, 0% FRL).
- Market conditions: 129 active listings in the ZIP; 3 comparable units currently listed for rent nearby; rentals leasing fast (median 13d on market — plan ~1-2 weeks tenant-placement turnaround); 77 units permitted in Tazewell County in 2024 (0 in 5+ unit buildings).
Forward outlook
- Local home prices are declining (-3.0%/yr); year-one equity from $1k of loan paydown is wiped out by about $6k of value loss. Plan a longer hold.
- Tazewell County population projected at -15% by 2050 — secular population decline; favor cash flow + early exit over multi-decade hold.
- At projected returns (-3.0% appreciation + 3.0% rent growth), your $56k cash investment doubles in ~7 years — after that, you're playing with house money.
Negotiation context
- Only 4 days on market — expect competitive offers; lowballing is unlikely to land.
Risks & watch-outs
- Watch-outs: built in 1898 — expect roof / HVAC / electrical / plumbing capex.
Questions for the listing agent
- Built in 1898 — when were the roof, HVAC, electrical panel, plumbing, and water heater last replaced?
- Is there a deadline driving the sale (1031 exchange, divorce, estate, relocation)? That informs how much negotiation room exists.
- What's the average days-on-market for RENTAL listings here right now (not sales)? A rising rental-DOM trend means longer vacancies and softer asking-rent achievability than the comps imply.
- What's the recent tenant-quality profile in this submarket — average credit score on applications, eviction rate, late-payment / NSF rate, and stable-employment percentage? A property-management company in the area should have these aggregated.
- How much new for-sale + rental construction is in the pipeline within 1–3 miles? Heavy new supply typically softens prices + rents 12–24 months out; constrained supply supports both.
Investment metrics
- 1% rule
- 1.38% ✓
- Cap rate
- 11.45%
- Cash-on-cash
- 18.41%
- DSCR
- 1.82
- GRM
- 6.1
CMA / ARV
- ARV (on-the-fly)
- $201,390
- Comps found
- 12
Show comp detail 12 sales within ~0.75 mi
| Address | Dist | Beds/Ba | Sqft | Sold | Price | $/sf | Match |
|---|---|---|---|---|---|---|---|
| 307 Walnut St | 0.52mi | 3/1.5 (-1) | 1,896 (-1%) | 3mo | $190,000 | $100 | 64 |
| 203 Court Dr | 0.49mi | 4/2.0 | 1,797 (-6%) | 4mo | $207,500 | $115 | 64 |
| 706 N Main St | 0.40mi | 3/2.0 (-1) | 1,795 (-6%) | 4mo | $189,000 | $105 | 62 |
| 600 E Jefferson St | 0.68mi | 4/2.0 | 1,915 (-0%) | 8mo | $195,000 | $102 | 61 |
| 202 North St | 0.47mi | 4/2.0 | 2,061 (+8%) | 8mo | $186,500 | $90 | 59 |
| 501 N Wood St | 0.15mi | 3/2.0 (-1) | 1,638 (-15%) | 6mo | $162,900 | $99 | 59 |
| 1101 Kingsbury Rd | 0.56mi | 4/1.5 | 1,861 (-3%) | 11mo | $289,000 | $155 | 58 |
| 1109 Lawson St | 0.70mi | 3/2.0 (-1) | 1,941 (+1%) | 4mo | $277,750 | $143 | 57 |
| 707 Devonshire Rd | 0.71mi | 3/2.0 (-1) | 1,931 (+1%) | 8mo | $229,900 | $119 | 54 |
| 602 Ridge St | 0.55mi | 3/1.5 (-1) | 1,718 (-10%) | 3mo | $200,000 | $116 | 47 |
| 308 S Pine St | 0.67mi | 3/1.0 (-1) | 1,876 (-2%) | 12mo | $165,000 | $88 | 46 |
| 505 E Jefferson St | 0.62mi | 4/2.0 | 1,664 (-13%) | 9mo | $110,000 | $66 | 42 |
Match score weights: distance 35% · size 25% · config 20% · recency 20%. Top-matched comps best support the ARV.
Projected returns pro-forma
-3.0% appreciation · 3.0% rent growth · sell at horizon
- IRR
- 10.1%
- Equity multiple
- 1.40×
- Total profit
- $22,305
- Equity at exit
- $29,821
- IRR
- 19.2%
- Equity multiple
- 2.60×
- Total profit
- $89,873
- Equity at exit
- $17,292
Cash invested: $56,000 (down + closing). Projections, not guarantees.
Landlord ↔ Tenant lean methodology
- Overall (STATE)
- 43 Moderately Tenant-Leaning
- State Illinois
- 43 Moderately Tenant-Leaning · D+7
- County
- — inherits STATE
- City
- — inherits STATE
ZIP-level market 61571
- Active inventory
- 129
- Price-to-rent
- 6.1×
Monthly cashflow live
- Estimated rent
- $2,750 medium interval (Pro) →
- Mortgage (P&I)
- −$1,049
- Tax from tax record
- −$181 /mo · $2,175/yr
- Insurance
- −$83
- HOA
- −$0
- Vacancy / Maint / Mgmt
- −$578
- Net cashflow
- $859
Break-even live
UW: 25.0% down · 7.5% · 30yr · 1.5% tax · 5.0% vac · 8.0% maint · 8.0% mgmt
Financing live
Cash to close
- Down payment
- $50,000
- Closing costs
- $6,000
- Reserves months
- —
- Total cash needed
- —
Loan-product check · same deal, 3 products live
Conventional
25% down · 7.5% · 30yr
- Down + closing
- —
- Monthly P&I
- —
- Monthly cashflow
- —
- DSCR
- —
- Eligible?
- —
Personal DTI + credit; lowest rate.
DSCR
20% down · 8.5% · 30yr
- Down + closing
- —
- Monthly P&I
- —
- Monthly cashflow
- —
- DSCR
- —
- Eligible?
- —
No personal income docs; deal must DSCR.
Hard money
10% down · 12.0% · 12mo
- Down + closing
- —
- Monthly P&I
- —
- Monthly cashflow
- —
- DSCR
- —
- Eligible?
- —
Short-term bridge; refi at stabilization.
Rent comps 3 comps
| Address | Beds | Baths | Sqft | Rent | $/sqft | DOM | Units | Dist |
|---|---|---|---|---|---|---|---|---|
| 700 Debates St Washington, IL | 3.0 | 2.0 | 1319 | $2,750 | $2.08 | 13d | 1 | 1.17mi |
| 713 Stephanie Ct Washington, IL | 3.0 | 2.0 | 1319 | $2,750 | $2.08 | 20d | 1 | 1.25mi |
| 704 Debates St Washington, IL | 3.0 | 2.0 | 1319 | $2,750 | $2.08 | 13d | 1 | 1.29mi |
Listing history 1 events
-
2026-05-21$200,000 Active
ⓘ Source: listings_history table (triggers on properties + properties_extension) + one-shot
backfill from property_details.listing_events for pre-trigger history.
Tax reassessment forecast IL · Partial reset (capped growth)
- Current annual tax
- $2,175 · $181/mo
- Projected year-2 tax
- $3,358 · $280/mo
- Expected delta
- +$1,182/yr (+$99/mo · 54.3%)
ⓘ Screening estimate from a state-policy table — verify with the county assessor before closing.
Climate risk First Street
- Flood 1/10 Low FEMA zone X (unshaded) · 0% chance over 30 yrs
- Wildfire 1/10 Low
- Heat 3/10 Moderate 7 d/yr ≥104°F today · 18 d/yr by 30 yrs out
- Wind 2/10 Low 100% chance of damaging wind over 30 yrs
- Air quality 2/10 Low 1 unhealthy d/yr today · 1 by 30 yrs out
Nearby sold comps map
Loading sold comps map…
Walkable amenities ~0.75 mi
Loading nearby amenities…
Taxation est. · year 1
- Rental income
- $33,000
- − Mortgage interest
- −$11,203
- − Property taxes
- −$2,175
- − Insurance
- −$1,000
- − Repairs & maintenance
- −$2,640
- − Management
- −$2,640
- − Depreciation
- −$5,818
- Taxable income
- $7,523
- Est. tax owed @ 24.0%
- −$1,806
- After-tax cash flow
- $8,503/yr
For passive investors: Depreciation is non-cash, so a rental often shows a tax loss while cash-flowing — sheltering income. Rental losses are passive: they offset passive income freely, and up to $25,000/yr can offset ordinary (W-2) income if you actively participate and your MAGI is under $100k (phasing out to $0 by $150k); unused losses carry forward. On sale, claimed depreciation is recaptured at up to 25%, and gains may owe capital-gains tax (a 1031 exchange can defer both). Figures are a year-1 estimate at your 24.0% rate — not tax advice; consult a CPA.
Schools (NCES district)
- District
- Washington Chsd 308
- NCES district ID
- 1740980
- Math proficiency
- 42% ▬ 0.00%
- Reading proficiency
- 42% ▼ -2.00%
- Median HH income
- $66,029
- Composite
- 37.69/100
- National rank
- #4361
- State rank
- #112 of 620 in IL
Livability — Washington
- Score
- 73/100
- State rank
- #272
- US rank
- #5136
Category grades
Schools grade is shown separately in the Schools card above.
Census & demographics
- Census place
- Washington, IL
- City population
- 24,544
- Population (ZIP)
- 24,544
Population outlook (Tazewell County) Hauer SSP2
- Today (2025)
- 131,252 people
- By 2030
- 128,028 · -2.5%
- By 2040
- 120,443 · -8.2%
- By 2050
- 111,872 · -14.8%
- By 2075
- 89,843 · -31.5%
- By 2100
- 66,468 · -49.4%
Race, ethnicity, and origin ACS 2023
- Neighborhood character
- Predominantly White (93%)
- Race & ethnicity
- White 93% Hispanic / Latino 3% Two or more races 3% Asian 1%
- Common ancestry
- Lithuanian 4% Italian 3% Iranian 2%
- Foreign-born
- 2% · Canada, China
- Languages at home
- 97% English-only · Spanish 2%
Political lean MEDSL · Tazewell
- 2024 margin
- Strong R (+26.7) · D 35.8% · R 62.5% · Other 1.8%
- 2008→2024 swing
- -20.6pp toward R · 2008: -6.0pp · 2024: -26.7pp
- All cycles
- 2024: R+26.7 2020: R+25.6 2016: R+28.5 2012: R+17.9 2008: R+6.0
Not yet ingested
- Civics
- —
Market trends
- HPI YoY
- ▼ -135.85%
- Current HPI
- 149.5627
- Rent YoY
- —
- Metro
- —
- State GDP YoY
- ▲ 1.59%
- F500 in state
- 60
Industry mix (Fortune 500 HQ in IL)
| Industry | F500 HQs | Revenue |
|---|---|---|
| Insurance | 4 | $201B |
|
||
| Consumer Goods | 4 | $87B |
|
||
| Industrial Machinery | 3 | $64B |
|
||
| Healthcare | 2 | $55B |
|
||
| Retail / Pharmacy | 1 | $148B |
|
||
| Agriculture / Food | 1 | $86B |
|
||
Price history
1 event — show timeline
- 2026-05-21 Listed $200,000 RMLSA as Distributed by MLS Grid
Property tax history
+2.6%/yrLatest (2024): $2,175 · -3.0% YoY. Source: county tax records.
Cash-flow waterfall
monthlySold comps — $/sqft
last 12 mo · ≤1 miLoading sold comps…