33 Wildwood Dr · Ladonia, AL
Flood risk 1/10 · Minimal
- FEMA flood zone
- X (unshaded)
- Chance of flooding over 30 yrs
- 0.0%
- Est. flood insurance / yr
- $507 – $1,088
Fire risk 5/10 · Moderate
- Est. fire insurance / yr
- $916 – $1,700
Heat risk 6/10 · Moderate
- Hot days now (above 107°F)
- 7 days/yr
- Hot days in 30 yrs
- 19 days/yr
Wind risk 6/10 · Moderate
- Chance of severe wind over 30 yrs
- 76.0%
Air-quality risk 2/10 · Minimal
- Unhealthy air days now
- 2 days/yr
- Unhealthy air days in 30 yrs
- 2 days/yr
Risk factors via First Street. Map © Google.
Why this score? — see what drove the D+ grade
The composite is a weighted blend of 9 inputs, each scored 0–100. Each bar is that input's sub-score; the figure is the points it added to the 100-point composite (weight × sub-score).
- Cash flow +19.7/30.0
- ARV discount +7.5/15.0
- DSCR +6.2/10.0
- 1% rule +4.2/10.0
- Livability +3.1/5.0
- Rent growth +2.6/5.0
- Schools +2.6/10.0
- Condition / age +2.5/5.0
- Appreciation +0.0/10.0
$179,900
🖨 Deal sheet 📄 Offer letter ✓ Due diligence
Listing remarks
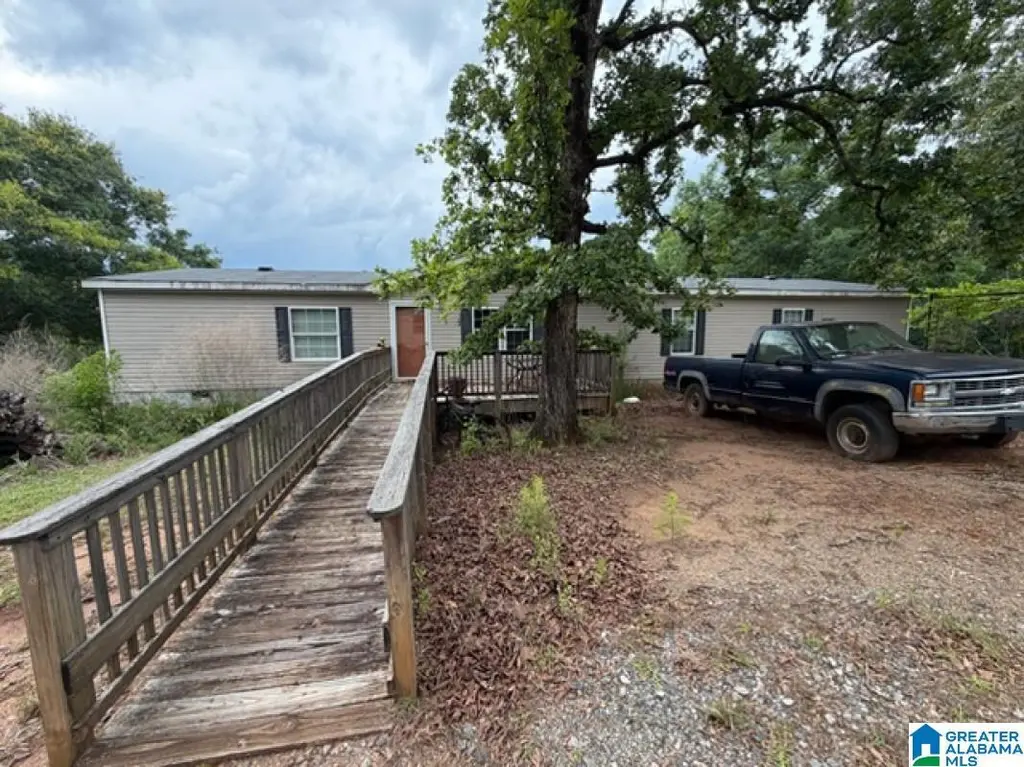
Spacious 2013 home on approximately 16 acres offering privacy and endless potential. Features approx. 2,240 sqft, large living areas, spacious kitchen, split-bedroom floorplan, and plenty of outdoor space for RVs, boats, recreation, or future expansion.
Key facts
- 16 acre lot
- Built 2013
- Listed 9 days
Property features AI
Finance
- Financial info: Down payment assistance available
Exterior
- Parking: Attached parking
- Utilities: Public water; Sewer connected; Electric water heater; Internet availability unknown
- Home design: Existing home; Single-story living areas (rooms listed on main level); Entrance direction not specified
- Construction: Vinyl siding; Crawl space foundation
- Exterior features: Open deck; No pool; No patio; Not waterfront; No notable lot view; Located on 16 acres
Interior
- Kitchen: Laminate countertops; Eating area
- Bedrooms: Master bedroom on main level; Four additional bedrooms on main level
- Flooring: Carpet; Vinyl
- Bathrooms: Two full bathrooms; Tub/shower combo
- Heating & cooling: Central heating; Central cooling
- Interior features: Crown molding; Split bedroom floorplan; Eating area in kitchen; Attic not present
- Laundry & utility: Main-level laundry room; Washer hookup; Electric dryer hookup; Electric water heater
Neighborhood map
What this means for you Summary
Snapshot
- This is a 4-bed/2.0-bath manufactured listed at $180k.
Deal economics
- At list price, monthly cash flow is $210 ($3k/yr) — positive.
- The deal already cash-flows at list — no discount required.
- To meet the 1% rule (rent ≥ 1% of price), the offer needs to be $165k (8.1% below list).
- Recommended offer: $165k (8.1% below list) — sets the bar for 1% rule.
- Cap rate 7.7% vs local median 4.4% in Ladonia — top-decile yield for the area; either an underpriced asset or a hidden risk that comps aren't pricing in. Stress-test before assuming the spread holds.
Location & tenants
- Location reads 61/100 on livability (#251 in AL) — a middle-class / working-renter tenant base. Strengths: cost of living A+, housing A+, crime A-; Watch: employment D, amenities F, commute F.
- Russell County (rural): math 18% / reading 45% proficiency, ranked #65 of 129 in AL (top 50%) — families likely to look elsewhere, expect single-tenant / working-renter base with shorter leases.
- Zoned schools: Mt Olive Primary School (392 students, 62% FRL); Russell County High School (math 17% / reading 27%, grade F, #142 of 305 statewide, top 51%, 1,014 students, 76% FRL).
- Market conditions: Rents flat; 105 active listings in the ZIP; 1 comparable units currently listed for rent nearby; 183 units permitted in Russell County in 2024 (0 in 5+ unit buildings).
- This rent runs 40% of the median local income ($50k/yr) — at the standard rent-burdened threshold; future hikes will face affordability resistance.
Forward outlook
- Local home prices are declining (-3.0%/yr); year-one equity from $1k of loan paydown is wiped out by about $5k of value loss. Plan a longer hold.
- Russell County population projected at +42% by 2050 — long-run rental-demand tailwind backs the buy-and-hold thesis.
Negotiation context
- Only 9 days on market — expect competitive offers; lowballing is unlikely to land.
- 2 sale attempts; this cycle's ask has dropped $20k (10%) from the opening price — seller is motivated, your offer sets the floor, not the list.
- Current owner paid $130k; 39% above their basis — modest negotiation headroom, anchor on the comps not their cost.
Risks & watch-outs
- Climate carrying-cost: major wind risk, 76% chance of damaging wind over 30y; moderate wildfire risk; extreme-heat days projected 7→19/yr by 2055 (HVAC capex compounding) — expect insurance premiums to compound above CPI over the hold.
Questions for the listing agent
- Is there a deadline driving the sale (1031 exchange, divorce, estate, relocation)? That informs how much negotiation room exists.
- Schools are F-rated, which usually means shorter tenancies and higher turnover. Who's the typical renter profile here, and what's been the actual vacancy rate?
- The area grade is low — what's the realistic commute time and amenity access for the typical tenant pool here? Any planned neighborhood developments (good or bad) we should know about?
- What's the average days-on-market for RENTAL listings here right now (not sales)? A rising rental-DOM trend means longer vacancies and softer asking-rent achievability than the comps imply.
- What's the recent tenant-quality profile in this submarket — average credit score on applications, eviction rate, late-payment / NSF rate, and stable-employment percentage? A property-management company in the area should have these aggregated.
- How much new for-sale + rental construction is in the pipeline within 1–3 miles? Heavy new supply typically softens prices + rents 12–24 months out; constrained supply supports both.
Investment metrics
- 1% rule
- 0.92% ✗
- Cap rate
- 7.70%
- Cash-on-cash
- 5.01%
- DSCR
- 1.22
- GRM
- 9.1
CMA / ARV
No comps found within radius.
Projected returns pro-forma
-3.0% appreciation · 0.43% rent growth · sell at horizon
- IRR
- -11.2%
- Equity multiple
- 0.60×
- Total profit
- $-19,992
- Equity at exit
- $26,824
- IRR
- -5.7%
- Equity multiple
- 0.67×
- Total profit
- $-16,671
- Equity at exit
- $15,554
Cash invested: $50,372 (down + closing). Projections, not guarantees.
Landlord ↔ Tenant lean methodology
- Overall (STATE)
- 90 Strongly Landlord-Friendly
- State Alabama
- 90 Strongly Landlord-Friendly · R+15
- County
- — inherits STATE
- City
- — inherits STATE
ZIP-level market 36869
- Home prices YoY
- -22.2%
- Rents YoY
- 0.4%
- Active inventory
- 105
- Price-to-rent
- 9.1×
Monthly cashflow live
- Estimated rent
- $1,652 medium interval (Pro) →
- Mortgage (P&I)
- −$943
- Tax from tax record
- −$77 /mo · $922/yr
- Insurance
- −$75
- HOA
- −$0
- Vacancy / Maint / Mgmt
- −$347
- Net cashflow
- $210
Break-even live
UW: 25.0% down · 7.5% · 30yr · 1.5% tax · 5.0% vac · 8.0% maint · 8.0% mgmt
Financing live
Cash to close
- Down payment
- $44,975
- Closing costs
- $5,397
- Reserves months
- —
- Total cash needed
- —
Loan-product check · same deal, 3 products live
Conventional
25% down · 7.5% · 30yr
- Down + closing
- —
- Monthly P&I
- —
- Monthly cashflow
- —
- DSCR
- —
- Eligible?
- —
Personal DTI + credit; lowest rate.
DSCR
20% down · 8.5% · 30yr
- Down + closing
- —
- Monthly P&I
- —
- Monthly cashflow
- —
- DSCR
- —
- Eligible?
- —
No personal income docs; deal must DSCR.
Hard money
10% down · 12.0% · 12mo
- Down + closing
- —
- Monthly P&I
- —
- Monthly cashflow
- —
- DSCR
- —
- Eligible?
- —
Short-term bridge; refi at stabilization.
Rent comps 1 comps
| Address | Beds | Baths | Sqft | Rent | $/sqft | DOM | Units | Dist |
|---|---|---|---|---|---|---|---|---|
| 7 Rodney Ct Phenix City, AL | 3.0 | 2.0 | 1700 | $1,450 | $0.85 | 13d | 1 | 1.14mi |
Listing history 9 events
-
2026-06-18days on market $179,900 Active 9 DOM
-
2026-06-17days on market $179,900 Active 8 DOM
-
2026-06-16days on market $179,900 Active 7 DOM
-
2026-06-15days on market $179,900 Active 6 DOM
-
2026-06-14days on market $179,900 Active 4 DOM
-
2026-06-13pricestatusdays on market $179,900 Active 3 DOM
-
2026-05-16status Pending 253-char remark
-
2026-05-13$199,900 Active 253-char remark
-
1997-01-21soldstatus $129,836
ⓘ Source: listings_history table (triggers on properties + properties_extension) + one-shot
backfill from property_details.listing_events for pre-trigger history.
Tax reassessment forecast AL · Resets to sale price
- Current annual tax
- $922 · $77/mo
- Projected year-2 tax
- $922 · $77/mo
- Expected delta
- $0/yr ($0/mo · 0.0%)
ⓘ Screening estimate from a state-policy table — verify with the county assessor before closing.
Climate risk First Street
- Flood 1/10 Low FEMA zone X (unshaded) · 0% chance over 30 yrs
- Wildfire 5/10 Major
- Heat 6/10 Major 7 d/yr ≥107°F today · 19 d/yr by 30 yrs out
- Wind 6/10 Major 76% chance of damaging wind over 30 yrs
- Air quality 2/10 Low 2 unhealthy d/yr today · 2 by 30 yrs out
Nearby sold comps map
Loading sold comps map…
Walkable amenities ~0.75 mi
Loading nearby amenities…
Taxation est. · year 1
- Rental income
- $19,829
- − Mortgage interest
- −$10,077
- − Property taxes
- −$922
- − Insurance
- −$900
- − Repairs & maintenance
- −$1,586
- − Management
- −$1,586
- − Depreciation
- −$5,233
- Taxable loss
- −$475
- Est. tax savings @ 24.0%
- +$114
- After-tax cash flow
- $2,637/yr
For passive investors: Depreciation is non-cash, so a rental often shows a tax loss while cash-flowing — sheltering income. Rental losses are passive: they offset passive income freely, and up to $25,000/yr can offset ordinary (W-2) income if you actively participate and your MAGI is under $100k (phasing out to $0 by $150k); unused losses carry forward. On sale, claimed depreciation is recaptured at up to 25%, and gains may owe capital-gains tax (a 1031 exchange can defer both). Figures are a year-1 estimate at your 24.0% rate — not tax advice; consult a CPA.
Schools (NCES district)
- District
- Russell County
- NCES district ID
- 0102880
- Math proficiency
- 18% ▼ -28.00%
- Reading proficiency
- 45% ▲ 1.00%
- Median HH income
- $40,292
- Composite
- 26.41/100
- National rank
- #7226
- State rank
- #65 of 129 in AL
Livability — Ladonia
- Score
- 61/100
- State rank
- #251
- US rank
- #17877
Category grades
Schools grade is shown separately in the Schools card above.
Census & demographics
- County
- Russell County · 53,055 people
- Metro
- Columbus, GA-AL
- Population (ZIP)
- 21,518
- Household income
- $50,061
- Rent vs Own
- Severe rent burden
- 789.0
Population outlook (Russell County) Hauer SSP2
- Today (2025)
- 70,137 people
- By 2030
- 75,826 · +8.1%
- By 2040
- 87,858 · +25.3%
- By 2050
- 99,721 · +42.2%
- By 2075
- 128,009 · +82.5%
- By 2100
- 149,251 · +112.8%
Race, ethnicity, and origin ACS 2023
- Neighborhood character
- Diverse neighborhood (Simpson 0.58)
- Race & ethnicity
- Black 50% White 41% Hispanic / Latino 5% Two or more races 4%
- Common ancestry
- Slovak 1% Lithuanian 1% Portuguese 1%
- Foreign-born
- 3% · Canada
- Languages at home
- 95% English-only · Spanish 4%
Political lean MEDSL · Russell
- 2024 margin
- Toss-up / Even · D 50.4% · R 48.7%
- 2008→2024 swing
- -5.6pp toward R · 2008: 7.3pp · 2024: 1.7pp
- All cycles
- 2024: D+1.7 2020: D+6.4 2016: D+1.9 2012: D+11.8 2008: D+7.3
Not yet ingested
- Civics
- —
Market trends
- HPI YoY
- ▼ -47.69%
- Current HPI
- 166.9094
- Rent YoY
- ▲ 0.43%
- Metro
- Columbus, GA-AL
- State GDP YoY
- ▲ 2.94%
- F500 in state
- 4
Industry mix (Fortune 500 HQ in AL)
| Industry | F500 HQs | Revenue |
|---|---|---|
| Financial Services | 1 | $8B |
|
||
| Healthcare | 1 | $5B |
|
||
Price history
+38.6% since first listed5 events — show timeline
- 2026-06-13 Price Changed $179,900 Greater Alabama MLS
- 2026-06-11 Relisted — Greater Alabama MLS
- 2026-05-16 Pending — Greater Alabama MLS
- 2026-05-13 Listed $199,900 Greater Alabama MLS
- 1997-01-21 Sold (Public Records) $129,836 Public Records
Property tax history
+7.9%/yrLatest (2025): $922 · +6.9% YoY. Source: county tax records.
Cash-flow waterfall
monthlySold comps — $/sqft
last 12 mo · ≤1 miLoading sold comps…