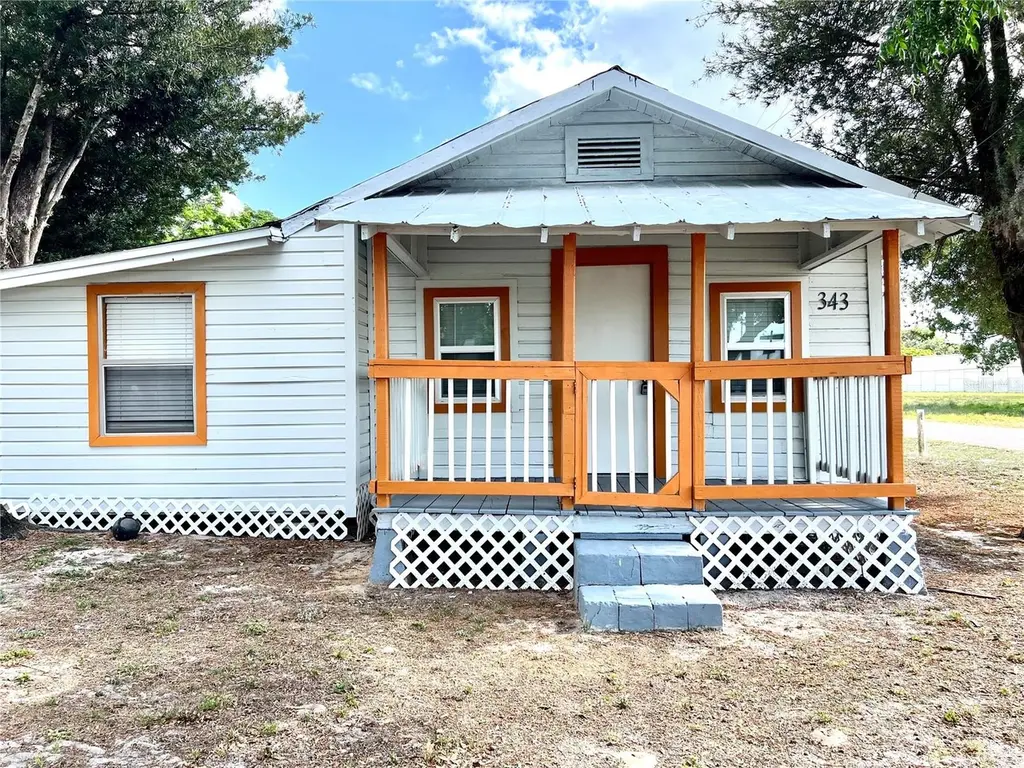
343 Weaver Ave · Lake Wales, FL
Flood risk 1/10 · Minimal
- FEMA flood zone
- X (unshaded)
- Chance of flooding over 30 yrs
- 0.0%
- Est. flood insurance / yr
- $507 – $1,088
Fire risk 5/10 · Moderate
- Est. fire insurance / yr
- $947 – $1,759
Heat risk 8/10 · Major
- Hot days now (above 108°F)
- 7 days/yr
- Hot days in 30 yrs
- 23 days/yr
Wind risk 9/10 · Severe
- Chance of severe wind over 30 yrs
- 99.0%
Air-quality risk 2/10 · Minimal
- Unhealthy air days now
- 0 days/yr
- Unhealthy air days in 30 yrs
- 2 days/yr
Risk factors via First Street. Map © Google.
Why this score? — see what drove the C+ grade
The composite is a weighted blend of 9 inputs, each scored 0–100. Each bar is that input's sub-score; the figure is the points it added to the 100-point composite (weight × sub-score).
- Cash flow +26.6/30.0
- DSCR +9.1/10.0
- 1% rule +7.8/10.0
- ARV discount +7.5/15.0
- Schools +3.5/10.0
- Livability +3.4/5.0
- Rent growth +2.5/5.0
- Condition / age +2.5/5.0
- Appreciation +0.0/10.0
$115,000
🖨 Deal sheet 📄 Offer letter ✓ Due diligence
Listing remarks
Great opportunity to own a move-in ready home with flexible living space! This 2-bedroom, 2-bath home offers approximately 1,159 sq ft with a spacious and functional layout. Generous room sizes and natural light create a comfortable living environment. The property also includes an additional rear room currently in use, offering flexible potential for future use such as a guest space, office, or storage. Enjoy a covered front porch, No HOA. Convenient location near major roads, shopping, and local amenities. Perfect for a primary residence or investment opportunity with strong upside potential. Important: The lot adjacent to the property does not convey with the sale of the home. The home i
Key facts
- Covered front porch
- Open living area
- Updated flooring
Tags
Property features AI
Finance
- Other: Zoned C-2; Property type: Residential — Single Family Residence; Unfurnished; Universal property ID available; Directions: From US-27 S, turn onto FL-60 E (W State Rd 60) toward Lake Wales. Continue on FL-60 E, then turn left onto Weaver Ave. Property will be on your right
- HOA & community: No HOA/association
Exterior
- Utilities: Public water available; Septic needed; Electricity available
- Home design: Single-family residence; One story; Faces north
- Construction: Frame construction; Shingle roof; Crawlspace foundation; Built area about 1,159 (public records)
- Exterior features: Paved road access; Lot dimensions about 50 x 73; Lot approximately 0.17 acre
Interior
- Kitchen: Cooktop; Refrigerator
- Bedrooms: 2 bedrooms
- Flooring: Laminate
- Bathrooms: 2 full bathrooms
- Heating & cooling: Ductless heating; Wall/window cooling units
- Interior features: Ceiling fans
- Laundry & utility: Laundry: Other
Neighborhood map
What this means for you Summary
Snapshot
- This is a 2-bed/2.0-bath single-family listed at $115k.
Deal economics
- At list price, monthly cash flow is $308 ($4k/yr) — positive.
- The deal already cash-flows at list — no discount required.
- Meets the 1% rule at list price ($1k rent vs $115k).
- Recommended offer: $108k (6.0% below list) — sets the bar for market timing.
Location & tenants
- Location reads 68/100 on livability (#535 in FL) — a middle-class / working-renter tenant base. Strengths: cost of living A+, housing A+; Watch: employment D+, schools D, amenities F.
- Polk (suburban): math 39% / reading 43% proficiency, ranked #62 of 73 in FL (top 85%) — families likely to look elsewhere, expect single-tenant / working-renter base with shorter leases.
- Market conditions: 182 active listings in the ZIP; 17 comparable units currently listed for rent nearby; rentals at typical pace (median 23d on market — plan ~3-4 weeks tenant-placement turnaround); 10,384 units permitted in Polk County in 2024 (1,716 in 5+ unit buildings).
Forward outlook
- Local home prices are declining (-3.0%/yr); year-one equity from $795 of loan paydown is wiped out by about $3k of value loss. Plan a longer hold.
- Polk County population projected at +33% by 2050 — long-run rental-demand tailwind backs the buy-and-hold thesis.
- At projected returns (-3.0% appreciation + 3.0% rent growth), your $32k cash investment doubles in ~10 years — after that, you're playing with house money.
Negotiation context
- It's been on market 90 days — a 6% lower offer ($108k) is reasonable based on typical stale-listing flexibility.
Risks & watch-outs
- Watch-outs: built in 1920 — expect roof / HVAC / electrical / plumbing capex.
- Climate carrying-cost: severe wind risk, 99% chance of damaging wind over 30y; moderate wildfire risk; extreme-heat days projected 7→23/yr by 2055 (HVAC capex compounding) — expect insurance premiums to compound above CPI over the hold.
Questions for the listing agent
- It's been on market 90 days. Have you received any prior offers? Is the seller open to a 6% concession, seller financing, or rate buy-down credit?
- Built in 1920 — when were the roof, HVAC, electrical panel, plumbing, and water heater last replaced?
- Why hasn't it sold? Are there any deal-killer items the seller is aware of (foundation, flood, title, zoning, code violations)?
- Is there a deadline driving the sale (1031 exchange, divorce, estate, relocation)? That informs how much negotiation room exists.
- Schools are D-rated, which usually means shorter tenancies and higher turnover. Who's the typical renter profile here, and what's been the actual vacancy rate?
- What's the average days-on-market for RENTAL listings here right now (not sales)? A rising rental-DOM trend means longer vacancies and softer asking-rent achievability than the comps imply.
- What's the recent tenant-quality profile in this submarket — average credit score on applications, eviction rate, late-payment / NSF rate, and stable-employment percentage? A property-management company in the area should have these aggregated.
- How much new for-sale + rental construction is in the pipeline within 1–3 miles? Heavy new supply typically softens prices + rents 12–24 months out; constrained supply supports both.
Investment metrics
- 1% rule
- 1.28% ✓
- Cap rate
- 9.51%
- Cash-on-cash
- 11.49%
- DSCR
- 1.51
- GRM
- 6.5
CMA / ARV
No comps found within radius.
Projected returns pro-forma
-3.0% appreciation · 3.0% rent growth · sell at horizon
- IRR
- 0.9%
- Equity multiple
- 1.03×
- Total profit
- $1,068
- Equity at exit
- $17,147
- IRR
- 10.5%
- Equity multiple
- 1.82×
- Total profit
- $26,466
- Equity at exit
- $9,943
Cash invested: $32,200 (down + closing). Projections, not guarantees.
Landlord ↔ Tenant lean methodology
- Overall (STATE)
- 87 Strongly Landlord-Friendly
- State Florida
- 87 Strongly Landlord-Friendly · R+3
- County
- — inherits STATE
- City
- — inherits STATE
ZIP-level market 33853
- Home prices YoY
- -9.2%
- Active inventory
- 182
- Price-to-rent
- 6.5×
Monthly cashflow live
- Estimated rent
- $1,473 high interval (Pro) →
- Mortgage (P&I)
- −$603
- Tax from tax record
- −$204 /mo · $2,451/yr
- Insurance
- −$48
- HOA
- −$0
- Vacancy / Maint / Mgmt
- −$309
- Net cashflow
- $308
Break-even live
UW: 25.0% down · 7.5% · 30yr · 1.5% tax · 5.0% vac · 8.0% maint · 8.0% mgmt
Financing live
Cash to close
- Down payment
- $28,750
- Closing costs
- $3,450
- Reserves months
- —
- Total cash needed
- —
Loan-product check · same deal, 3 products live
Conventional
25% down · 7.5% · 30yr
- Down + closing
- —
- Monthly P&I
- —
- Monthly cashflow
- —
- DSCR
- —
- Eligible?
- —
Personal DTI + credit; lowest rate.
DSCR
20% down · 8.5% · 30yr
- Down + closing
- —
- Monthly P&I
- —
- Monthly cashflow
- —
- DSCR
- —
- Eligible?
- —
No personal income docs; deal must DSCR.
Hard money
10% down · 12.0% · 12mo
- Down + closing
- —
- Monthly P&I
- —
- Monthly cashflow
- —
- DSCR
- —
- Eligible?
- —
Short-term bridge; refi at stabilization.
Rent comps 17 comps
| Address | Beds | Baths | Sqft | Rent | $/sqft | DOM | Units | Dist |
|---|---|---|---|---|---|---|---|---|
| 133 W Park Ave Unit B Lake Wales, FL | 3.0 | 2.0 | 1151 | $1,600 | $1.39 | 23d | 1 | 0.43mi |
| 104 W Stuart Ave Lake Wales, FL | 2.0 | 1.0 | 720 | $1,100 | $1.53 | 3d | 1 | 0.47mi |
| 244 E Park Ave Unit 201 Lake Wales, FL | 2.0 | 2.5 | 1119 | $1,850 | $1.65 | 23d | 1 | 0.73mi |
| 244 E Park Ave Unit 204 Lake Wales, FL | 2.0 | 1.0 | 847 | $1,800 | $2.13 | 23d | 1 | 0.73mi |
| 307 Steedly Ave Lake Wales, FL | 3.0 | 1.0 | 1335 | $1,895 | $1.42 | 2d | 1 | 0.82mi |
| 100 E St Lake Wales, FL | 2.0 | 1.5 | 860 | $1,200 | $1.40 | 23d | 1 | 0.89mi |
| 403 E Johnson Ave Lake Wales, FL | 3.0 | 2.0 | 1196 | $1,650 | $1.38 | 23d | 1 | 0.91mi |
| 444 E Tillman Ave Unit 5 Lake Wales, FL | 2.0 | 1.0 | 892 | $1,100 | $1.23 | 23d | 1 | 1.00mi |
| 444 E Tillman Ave Lake Wales, FL | 2.0 | 1.0 | 892 | $1,100 | $1.23 | 14d | 1 | 1.00mi |
| 609 Washington Ave Lake Wales, FL | 3.0 | 2.0 | 1392 | $1,549 | $1.11 | 13d | 1 | 1.05mi |
| 114 E Northside Dr #3 Lake Wales, FL | 2.0 | 1.0 | 900 | $1,200 | $1.33 | 23d | 1 | 1.11mi |
| 610 Emerald Ave Unit 3 Lake Wales, FL | 2.0 | 1.0 | 864 | $1,299 | $1.50 | 21d | 1 | 1.26mi |
| 425 F St Unit 2 Lake Wales, FL | 3.0 | 2.0 | 977 | $1,195 | $1.22 | 13d | 1 | 1.26mi |
| 202 Owens Rd Lake Wales, FL | 3.0 | 2.0 | 1133 | $1,850 | $1.63 | 23d | 1 | 1.28mi |
| 620 Emerald Ave Unit 1 Lake Wales, FL | 2.0 | 1.0 | 780 | $1,000 | $1.28 | 23d | 1 | 1.28mi |
| 711 Springer Dr #3 Lake Wales, FL | 2.0 | 2.0 | 972 | $1,400 | $1.44 | 23d | 1 | 1.46mi |
| 711 Springer Dr Lake Wales, FL | 1.0–2.0 | 1.0–2.0 | 848 | $1,400 | $1.65 | 3d | 2 | 1.46mi |
Listing history 24 events
-
2026-06-18days on market $115,000 Active 90 DOM
-
2026-06-17price $115,000 Active 89 DOM
-
2026-06-17days on market $119,900 Active 89 DOM
-
2026-06-16days on market $119,900 Active 88 DOM
-
2026-06-15price $119,900 Active 87 DOM
-
2026-06-15days on market $127,000 Active 87 DOM
-
2026-06-13pricedays on market $127,000 Active 85 DOM
-
2026-06-10days on market $120,000 Active 82 DOM
-
2026-06-09days on market $120,000 Active 81 DOM
-
2026-06-08days on market $120,000 Active 80 DOM
-
2026-06-07days on market $120,000 Active 79 DOM
-
2026-06-05days on market $120,000 Active 76 DOM
-
2026-06-03pricedays on market $120,000 Active 75 DOM
-
2026-06-03days on market $125,000 Active 74 DOM
-
2026-06-01days on market $125,000 Active 73 DOM
-
2026-05-31pricedays on market $125,000 Active 72 DOM
-
2026-05-21price $127,000
-
2026-04-28price $128,000
-
2026-04-20price $129,999
-
2026-04-14soldstatus $102,000
-
2026-04-10price $138,000
-
2026-03-25price $139,900
-
2026-03-20$140,000 Active
-
2005-01-03soldstatus $70,000
ⓘ Source: listings_history table (triggers on properties + properties_extension) + one-shot
backfill from property_details.listing_events for pre-trigger history.
Tax reassessment forecast FL · Resets to sale price
- Current annual tax
- $2,451 · $204/mo
- Projected year-2 tax
- $2,451 · $204/mo
- Expected delta
- $0/yr ($0/mo · 0.0%)
ⓘ Screening estimate from a state-policy table — verify with the county assessor before closing.
Climate risk First Street
- Flood 1/10 Low FEMA zone X (unshaded) · 0% chance over 30 yrs
- Wildfire 5/10 Major
- Heat 8/10 Severe 7 d/yr ≥108°F today · 23 d/yr by 30 yrs out
- Wind 9/10 Extreme 99% chance of damaging wind over 30 yrs
- Air quality 2/10 Low 0 unhealthy d/yr today · 2 by 30 yrs out
Nearby sold comps map
Loading sold comps map…
Walkable amenities ~0.75 mi
Loading nearby amenities…
Taxation est. · year 1
- Rental income
- $17,676
- − Mortgage interest
- −$6,442
- − Property taxes
- −$2,451
- − Insurance
- −$575
- − Repairs & maintenance
- −$1,414
- − Management
- −$1,414
- − Depreciation
- −$3,345
- Taxable income
- $2,035
- Est. tax owed @ 24.0%
- −$488
- After-tax cash flow
- $3,213/yr
For passive investors: Depreciation is non-cash, so a rental often shows a tax loss while cash-flowing — sheltering income. Rental losses are passive: they offset passive income freely, and up to $25,000/yr can offset ordinary (W-2) income if you actively participate and your MAGI is under $100k (phasing out to $0 by $150k); unused losses carry forward. On sale, claimed depreciation is recaptured at up to 25%, and gains may owe capital-gains tax (a 1031 exchange can defer both). Figures are a year-1 estimate at your 24.0% rate — not tax advice; consult a CPA.
Schools (NCES district)
- District
- Polk
- NCES district ID
- 1201590
- Math proficiency
- 39% ▼ -11.00%
- Reading proficiency
- 43% ▼ -4.00%
- Median HH income
- $43,979
- Composite
- 34.74/100
- National rank
- #5132
- State rank
- #62 of 73 in FL
Livability — Lake Wales
- Score
- 68/100
- State rank
- #535
- US rank
- #10036
Category grades
Schools grade is shown separately in the Schools card above.
Census & demographics
- Census place
- Lake Wales, FL
- City population
- 30,351
- Population (ZIP)
- 12,385
Population outlook (Polk County) Hauer SSP2
- Today (2025)
- 752,975 people
- By 2030
- 804,621 · +6.9%
- By 2040
- 906,117 · +20.3%
- By 2050
- 1,000,476 · +32.9%
- By 2075
- 1,197,520 · +59.0%
- By 2100
- 1,271,518 · +68.9%
Race, ethnicity, and origin ACS 2023
- Neighborhood character
- Diverse neighborhood (Simpson 0.65)
- Race & ethnicity
- White 42% Hispanic / Latino 36% Black 19% Two or more races 16%
- Hispanic origin (detail)
- Mexican 10% Puerto Rican 18% Cuban 2% Dominican 1%
- Common ancestry
- Romanian 2% Slovak 1% Lithuanian 1%
- Foreign-born
- 10% · Canada
- Languages at home
- 72% English-only · Spanish 27%
Political lean MEDSL · Polk
- 2024 margin
- Strong R (+20.7) · D 39.2% · R 59.9%
- 2008→2024 swing
- -14.6pp toward R · 2008: -6.1pp · 2024: -20.7pp
- All cycles
- 2024: R+20.7 2020: R+14.4 2016: R+14.1 2012: R+6.8 2008: R+6.1
Not yet ingested
- Civics
- —
Market trends
- HPI YoY
- ▼ -33.98%
- Current HPI
- 333.8292
- Rent YoY
- —
- Metro
- —
- State GDP YoY
- ▲ 3.28%
- F500 in state
- 36
Industry mix (Fortune 500 HQ in FL)
| Industry | F500 HQs | Revenue |
|---|---|---|
| Industrial Technology | 2 | $29B |
|
||
| Insurance | 2 | $17B |
|
||
| Retail | 1 | $60B |
|
||
| Technology Distribution | 1 | $58B |
|
||
| Homebuilding | 1 | $35B |
|
||
| Technology Manufacturing | 1 | $35B |
|
||
Price history
+81.4% since first listed8 events — show timeline
- 2026-05-21 Price Changed $127,000 Stellar MLS as Distributed by MLS Grid
- 2026-04-28 Price Changed $128,000 Stellar MLS as Distributed by MLS Grid
- 2026-04-20 Price Changed $129,999 Stellar MLS as Distributed by MLS Grid
- 2026-04-14 Sold (Public Records) $102,000 Public Records
- 2026-04-10 Price Changed $138,000 Stellar MLS as Distributed by MLS Grid
- 2026-03-25 Price Changed $139,900 Stellar MLS as Distributed by MLS Grid
- 2026-03-20 Listed $140,000 Stellar MLS as Distributed by MLS Grid
- 2005-01-03 Sold (Public Records) $70,000 Public Records
Property tax history
+11.1%/yrLatest (2025): $2,451 · +9.2% YoY. Source: county tax records.
Cash-flow waterfall
monthlySold comps — $/sqft
last 12 mo · ≤1 miLoading sold comps…