 Duplex
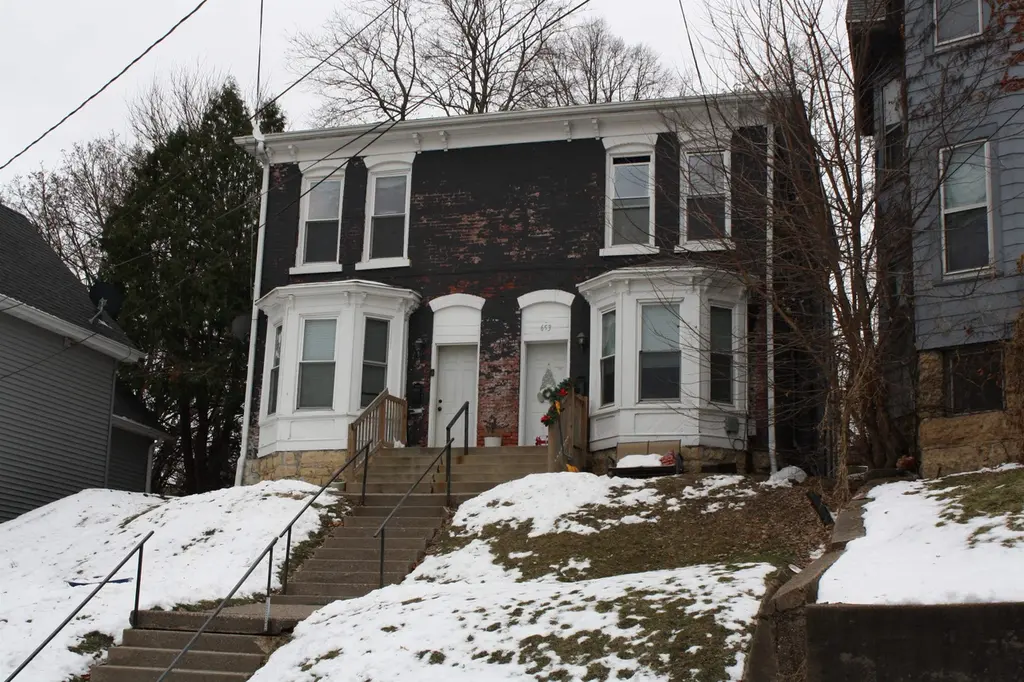
651 Caledonia Pl Unit 653 Caledonia Place · Dubuque, IA
Flood risk 1/10 · Minimal
- FEMA flood zone
- X (unshaded)
- Chance of flooding over 30 yrs
- 0.0%
- Est. flood insurance / yr
- $507 – $1,088
Fire risk 1/10 · Minimal
- Est. fire insurance / yr
- $902 – $1,676
Heat risk 3/10 · Minor
- Hot days now (above 102°F)
- 7 days/yr
- Hot days in 30 yrs
- 15 days/yr
Wind risk 2/10 · Minimal
- Chance of severe wind over 30 yrs
- —
Air-quality risk 2/10 · Minimal
- Unhealthy air days now
- 1 days/yr
- Unhealthy air days in 30 yrs
- 2 days/yr
Risk factors via First Street. Map © Google.
Why this score? — see what drove the A- grade
The composite is a weighted blend of 9 inputs, each scored 0–100. Each bar is that input's sub-score; the figure is the points it added to the 100-point composite (weight × sub-score).
- Cash flow +30.0/30.0
- ARV discount +15.0/15.0
- 1% rule +10.0/10.0
- DSCR +10.0/10.0
- Schools +5.5/10.0
- Livability +4.5/5.0
- Rent growth +3.9/5.0
- Condition / age +2.2/5.0
- Appreciation +0.0/10.0
$144,000
🖨 Deal sheet 📄 Offer letter ✓ Due diligence
Multi-family units
County records classify this as Multi-Family (2-4 Unit). Listing-text estimate: 2 units. confirmed
Listing remarks MLS
Well-maintained two-unit duplex that is fully rented and generating steady cash flow. Both units are currently occupied, providing immediate income for the next owner. A great investment opportunity with strong rental demand. Ideal for investors looking to expand or start their portfolio.
Key facts
- Built 1898
- Listed 120 days
Neighborhood map
What this means for you Summary
Snapshot
- This is a 2 × 3-bed/1.0-bath units multifamily listed at $144k. Condition is rated fair.
Deal economics
- At list price, monthly cash flow is $1k ($14k/yr) — positive. Per door: $590/mo.
- The deal already cash-flows at list — no discount required.
- Meets the 1% rule at list price ($3k rent vs $144k).
- Recommended offer: $127k (12.0% below list) — sets the bar for market timing.
- Cap rate 16.1% vs local median 3.5% in Dubuque — top-decile yield for the area; either an underpriced asset or a hidden risk that comps aren't pricing in. Stress-test before assuming the spread holds.
Location & tenants
- Location reads 89/100 on livability (#7 in IA, #119 nationally) — a professional / high-income tenant draw. Strengths: amenities A+, commute A+, cost of living A+; Watch: crime C-.
- Dubuque Community School District (urban): math 63% / reading 65% proficiency, ranked #205 of 289 in IA (top 71%) — acceptable for families but not a draw, mixed tenant base, ~2y average lease.
- Market conditions: Rents rising fast (+5.6%/yr); 225 active listings in the ZIP; 473 units permitted in Dubuque County in 2024 (319 in 5+ unit buildings).
- At $2,753/mo this rent would consume 54% of the median local household income ($62k/yr) (locally 1940% of renters already pay >50% of income on rent) — very limited rent-growth headroom before tenants either downsize or default.
Forward outlook
- Local home prices are declining (-3.0%/yr); year-one equity from $996 of loan paydown is wiped out by about $4k of value loss. Plan a longer hold.
- Dubuque County population projected at +13% by 2050 — modest demand growth; plan on rents tracking national, not racing it.
- At projected returns (-3.0% appreciation + 5.6% rent growth), your $40k cash investment doubles in ~4 years — after that, you're playing with house money.
Negotiation context
- It's been on market 121 days — a 12% lower offer ($127k) is reasonable based on typical stale-listing flexibility.
Risks & watch-outs
- Watch-outs: built in 1898 — expect roof / HVAC / electrical / plumbing capex.
Questions for the listing agent
- It's been on market 121 days. Have you received any prior offers? Is the seller open to a 12% concession, seller financing, or rate buy-down credit?
- Can we see the unit-by-unit rent roll, current vacancy, and any below-market leases? What's the average tenancy length?
- What capital expenditures (roof, boiler, parking lot, exteriors) have been made in the last 5 years, and what's planned in the next 2?
- Have any recent inspections been done? Can we get a copy of the seller's disclosures and any deferred-maintenance estimates?
- Built in 1898 — when were the roof, HVAC, electrical panel, plumbing, and water heater last replaced?
- Why hasn't it sold? Are there any deal-killer items the seller is aware of (foundation, flood, title, zoning, code violations)?
- Is there a deadline driving the sale (1031 exchange, divorce, estate, relocation)? That informs how much negotiation room exists.
- Schools are B-rated — typically a magnet for longer-tenancy family renters. What's the average tenant stay here, and is there a school-zone premium baked into asking?
- What's the average days-on-market for RENTAL listings here right now (not sales)? A rising rental-DOM trend means longer vacancies and softer asking-rent achievability than the comps imply.
- What's the recent tenant-quality profile in this submarket — average credit score on applications, eviction rate, late-payment / NSF rate, and stable-employment percentage? A property-management company in the area should have these aggregated.
- How much new apartment / multifamily construction is in the pipeline within 1–3 miles? Heavy new supply (>2% of stock underway) typically softens rents 12–24 months out; light construction supports rent growth.
Investment metrics
- 1% rule
- 1.91% ✓
- Cap rate
- 16.12%
- Cash-on-cash
- 35.11%
- DSCR
- 2.56
- GRM
- 4.4
CMA / ARV
- ARV (median comp)
- $187,966
- List price
- $144,000
- Delta
- -23.39%
- Verdict
- UNDERPRICED
- Comps
- 20 within 1.0 mi
Show comp detail 5 sales within ~0.75 mi
| Address | Dist | Beds/Ba | Sqft | Sold | Price | $/sf | Match |
|---|---|---|---|---|---|---|---|
| 850 Alpine St | 0.29mi | 6/2.0 | 2,840 (-3%) | 3mo | $272,500 | $96 | 79 |
| 460 Loras Blvd | 0.50mi | 6/2.0 | 2,921 (-1%) | 3mo | $191,000 | $65 | 73 |
| 800 W 5th St | 0.09mi | 7/3.0 (+1) | 3,129 (+6%) | 4mo | $185,000 | $59 | 72 |
| 935 W 5th St | 0.13mi | 6/2.0 | 2,638 (-10%) | 12mo | $210,000 | $80 | 67 |
| 25-27 W 15th St | 0.72mi | 6/2.0 | 2,636 (-10%) | 2mo | $205,000 | $78 | 48 |
Match score weights: distance 35% · size 25% · config 20% · recency 20%. Top-matched comps best support the ARV.
Projected returns pro-forma
-3.0% appreciation · 5.63% rent growth · sell at horizon
- IRR
- 33.6%
- Equity multiple
- 2.47×
- Total profit
- $59,320
- Equity at exit
- $21,471
- IRR
- 42.0%
- Equity multiple
- 5.49×
- Total profit
- $180,954
- Equity at exit
- $12,450
Cash invested: $40,320 (down + closing). Projections, not guarantees.
Landlord ↔ Tenant lean methodology
- Overall (STATE)
- 83 Strongly Landlord-Friendly
- State Iowa
- 83 Strongly Landlord-Friendly · R+6
- County
- — inherits STATE
- City
- — inherits STATE
ZIP-level market 52001
- Rents YoY
- 5.6%
- Active inventory
- 225
- Price-to-rent
- 8.7×
Monthly cashflow live
- Estimated rent
- $2,753 high interval (Pro) →
- Mortgage (P&I)
- −$755
- Tax est. 1.5%
- −$180 /mo · $2,160/yr
- Insurance
- −$60
- HOA
- −$0
- Vacancy / Maint / Mgmt
- −$578
- Net cashflow
- $1,180
Break-even live
2-unit breakdown (identical units grouped — click to expand)
| Units | Beds | Baths | Est. rent |
|---|---|---|---|
| 2× units | 3 | 1 | $2,754 |
| #1 | 3 | 1 | $1,377 |
| #2 | 3 | 1 | $1,377 |
| Total (2 units) | $2,753 | ||
UW: 25.0% down · 7.5% · 30yr · 1.5% tax · 5.0% vac · 8.0% maint · 8.0% mgmt
Financing live
Cash to close
- Down payment
- $36,000
- Closing costs
- $4,320
- Reserves months
- —
- Total cash needed
- —
Loan-product check · same deal, 3 products live
Conventional
25% down · 7.5% · 30yr
- Down + closing
- —
- Monthly P&I
- —
- Monthly cashflow
- —
- DSCR
- —
- Eligible?
- —
Personal DTI + credit; lowest rate.
DSCR
20% down · 8.5% · 30yr
- Down + closing
- —
- Monthly P&I
- —
- Monthly cashflow
- —
- DSCR
- —
- Eligible?
- —
No personal income docs; deal must DSCR.
Hard money
10% down · 12.0% · 12mo
- Down + closing
- —
- Monthly P&I
- —
- Monthly cashflow
- —
- DSCR
- —
- Eligible?
- —
Short-term bridge; refi at stabilization.
Listing history 19 events
-
2026-06-19days on market $144,000 Active 121 DOM
-
2026-06-18days on market $144,000 Active 120 DOM
-
2026-06-17days on market $144,000 Active 119 DOM
-
2026-06-16days on market $144,000 Active 118 DOM
-
2026-06-15days on market $144,000 Active 117 DOM
-
2026-06-14days on market $144,000 Active 115 DOM
-
2026-06-13days on market $144,000 Active 114 DOM
-
2026-06-10days on market $144,000 Active 112 DOM
-
2026-06-09days on market $144,000 Active 111 DOM
-
2026-06-08days on market $144,000 Active 110 DOM
-
2026-06-07days on market $144,000 Active 109 DOM
-
2026-06-05days on market $144,000 Active 106 DOM
-
2026-06-03days on market $144,000 Active 105 DOM
-
2026-06-02days on market $144,000 Active 104 DOM
-
2026-06-01days on market $144,000 Active 103 DOM
-
2026-05-31days on market $144,000 Active 102 DOM
-
2026-05-30days on market $144,000 Active 101 DOM
-
2026-04-23price $144,000 289-char remark
Show marketing remark (289 chars)
Well-maintained two-unit duplex that is fully rented and generating steady cash flow. Both units are currently occupied, providing immediate income for the next owner. A great investment opportunity with strong rental demand. Ideal for investors looking to expand or start their portfolio.
-
2026-02-17$160,000 Active 289-char remark
Show marketing remark (289 chars)
Well-maintained two-unit duplex that is fully rented and generating steady cash flow. Both units are currently occupied, providing immediate income for the next owner. A great investment opportunity with strong rental demand. Ideal for investors looking to expand or start their portfolio.
ⓘ Source: listings_history table (triggers on properties + properties_extension) + one-shot
backfill from property_details.listing_events for pre-trigger history.
Climate risk First Street
- Flood 1/10 Low FEMA zone X (unshaded) · 0% chance over 30 yrs
- Wildfire 1/10 Low
- Heat 3/10 Moderate 7 d/yr ≥102°F today · 15 d/yr by 30 yrs out
- Wind 2/10 Low
- Air quality 2/10 Low 1 unhealthy d/yr today · 2 by 30 yrs out
Nearby sold comps map
Loading sold comps map…
Walkable amenities ~0.75 mi
Loading nearby amenities…
Taxation est. · year 1
- Rental income
- $33,036
- − Mortgage interest
- −$8,066
- − Property taxes
- −$2,160
- − Insurance
- −$720
- − Repairs & maintenance
- −$2,643
- − Management
- −$2,643
- − Depreciation
- −$4,189
- Taxable income
- $12,615
- Est. tax owed @ 24.0%
- −$3,028
- After-tax cash flow
- $11,129/yr
For passive investors: Depreciation is non-cash, so a rental often shows a tax loss while cash-flowing — sheltering income. Rental losses are passive: they offset passive income freely, and up to $25,000/yr can offset ordinary (W-2) income if you actively participate and your MAGI is under $100k (phasing out to $0 by $150k); unused losses carry forward. On sale, claimed depreciation is recaptured at up to 25%, and gains may owe capital-gains tax (a 1031 exchange can defer both). Figures are a year-1 estimate at your 24.0% rate — not tax advice; consult a CPA.
Condition & rehab AI · 1 photo
This two-unit duplex requires significant exterior repairs and maintenance to improve its condition and value. Immediate attention to the exterior and roof is recommended.
Repairs flagged
- Major Exterior siding — Significant wear and dirt
- Major Roof — Appears aged
- Major Flooring — No visible flooring, but exterior suggests older materials
- Major Interior walls/paint — No visible interior, but exterior suggests older paint
- Major Windows — No visible windows, but exterior suggests older windows
- Major HVAC/mechanicals — No visible systems, but exterior suggests older systems
- Major Landscaping — Minimal landscaping, with snow and dirt
Value-add opportunities
- Both Paint exterior — Enhances curb appeal and value
- Both Clean exterior — Improves curb appeal and value
- Both Inspect roof for leaks — Prevents costly repairs and improves value
Renovation cost estimate screening
| Repair item | Severity | Est. cost |
|---|---|---|
| Exterior siding · Significant wear and dirt | Major | $15,000–50,000 |
| Roof · Appears aged | Major | $15,000–50,000 |
| Flooring · No visible flooring, but exterior suggests older materials | Major | $15,000–50,000 |
| Interior walls/paint · No visible interior, but exterior suggests older paint | Major | $15,000–50,000 |
| Windows · No visible windows, but exterior suggests older windows | Major | $15,000–50,000 |
| HVAC/mechanicals · No visible systems, but exterior suggests older systems | Major | $15,000–50,000 |
| Landscaping · Minimal landscaping, with snow and dirt | Major | $15,000–50,000 |
| Total estimated repair cost · 7 items | $105,000–350,000 |
Value-add ROI direction
- Both Paint exterior — Enhances curb appeal and value ↑
- Both Clean exterior — Improves curb appeal and value ↑
- Both Inspect roof for leaks — Prevents costly repairs and improves value ↑
ⓘ Cost ranges are severity-bucket heuristics (US national rule-of-thumb). Get contractor quotes + a written scope before underwriting a rehab budget.
Schools (NCES district)
- District
- Dubuque Community School District
- NCES district ID
- 1909480
- Math proficiency
- 63% ▼ -7.00%
- Reading proficiency
- 65% ▼ -1.00%
- Median HH income
- $51,237
- Composite
- 54.51/100
- National rank
- #1345
- State rank
- #205 of 289 in IA
Livability — Dubuque
- Score
- 89/100
- State rank
- #7
- US rank
- #119
Category grades
Schools grade is shown separately in the Schools card above.
Census & demographics
- Census place
- Dubuque, IA
- County
- Dubuque County · 60,106 people
- City population
- 60,106
- Metro
- Dubuque, IA
- Population (ZIP)
- 43,101
- Household income
- $61,643
- Rent vs Own
- Severe rent burden
- 1940.0
Population outlook (Dubuque County) Hauer SSP2
- Today (2025)
- 103,359 people
- By 2030
- 106,472 · +3.0%
- By 2040
- 112,043 · +8.4%
- By 2050
- 116,553 · +12.8%
- By 2075
- 128,014 · +23.9%
- By 2100
- 132,892 · +28.6%
Race, ethnicity, and origin ACS 2023
- Neighborhood character
- Predominantly White (84%)
- Race & ethnicity
- White 84% Two or more races 6% Black 5% Hispanic / Latino 4% Asian 1% Pacific Islander 1%
- Common ancestry
- Portuguese 3% Italian 2% Lithuanian 2%
- Foreign-born
- 4% · Canada, China
- Languages at home
- 95% English-only · Spanish 3% Tagalog/Filipino 1% Other Asian/Pacific 1%
Political lean MEDSL · Dubuque
- 2024 margin
- Lean R (+8.6) · D 45.1% · R 53.7% · Other 1.2%
- 2008→2024 swing
- -29.4pp toward R · 2008: 20.8pp · 2024: -8.6pp
- All cycles
- 2024: R+8.6 2020: R+2.9 2016: R+1.2 2012: D+14.5 2008: D+20.8
Not yet ingested
- Civics
- —
Market trends
- HPI YoY
- ▼ -156.36%
- Current HPI
- 173.5536
- Rent YoY
- ▲ 5.63%
- Metro
- Dubuque, IA
- State GDP YoY
- ▲ 2.48%
- F500 in state
- 4
Industry mix (Fortune 500 HQ in IA)
| Industry | F500 HQs | Revenue |
|---|---|---|
| Financial Services | 1 | $16B |
|
||
| Retail / Convenience | 1 | $15B |
|
||
Price history
-10.0% since first listed2 events — show timeline
- 2026-04-23 Price Changed $144,000 ECIMLS
- 2026-02-17 Listed $160,000 ECIMLS
Cash-flow waterfall
monthlySold comps — $/sqft
last 12 mo · ≤1 miLoading sold comps…