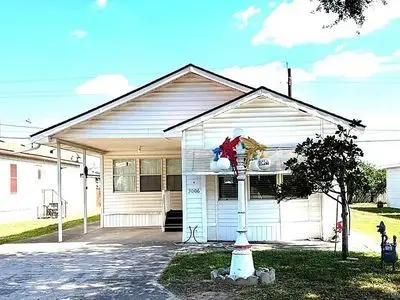
3006 Spur Dr · Mission, TX
Flood risk 7/10 · Major
- FEMA flood zone
- X
- Chance of flooding over 30 yrs
- 0.96%
- Est. flood insurance / yr
- $507 – $1,088
Fire risk 1/10 · Minimal
- Est. fire insurance / yr
- $1,222 – $2,270
Heat risk 9/10 · Severe
- Hot days now (above 111°F)
- 7 days/yr
- Hot days in 30 yrs
- 21 days/yr
Wind risk 8/10 · Major
- Chance of severe wind over 30 yrs
- 99.0%
Air-quality risk 2/10 · Minimal
- Unhealthy air days now
- 1 days/yr
- Unhealthy air days in 30 yrs
- 2 days/yr
Risk factors via First Street. Map © Google.
Why this score? — see what drove the C- grade
The composite is a weighted blend of 9 inputs, each scored 0–100. Each bar is that input's sub-score; the figure is the points it added to the 100-point composite (weight × sub-score).
- Cash flow +27.0/30.0
- DSCR +9.3/10.0
- 1% rule +7.5/10.0
- Livability +3.8/5.0
- Rent growth +2.5/5.0
- Condition / age +2.5/5.0
- Schools +1.7/10.0
- ARV discount +0.0/15.0
- Appreciation +0.0/10.0
$105,000
🖨 Deal sheet (PDF) 📄 Offer letter ✓ Due diligence
Listing remarks MLS
Welcome to easy living in the desirable Wagon City North, a friendly and well-maintained 55+ community in the heart of Mission, Texas! Own your own lot in this move-in ready furnished 2-bedroom, 2-bath mobile home, 2 living areas which features a spacious open layout, large windows for natural light, and a cozy 2nd living area perfect for enjoying your morning coffee. The kitchen area offers ample cabinet space, a built-in hutch area and comes with all major appliances. Other features include fully furnished, central A/C and heating, storage shed, golf cart storage, and covered porch. Community amenities include a Clubhouse with planned social activities, swimming pool, shuffleboard courts, library and game room. Located just minutes from shopping and dining.
Key facts
- Built 2000
- Listed 31 days
Neighborhood map
What this means for you Summary
Snapshot
- This is a 2-bed/1.0-bath manufactured listed at $105k.
Deal economics
- At list price, monthly cash flow is $228 ($3k/yr) — positive.
- The deal already cash-flows at list — no discount required.
- Meets the 1% rule at list price ($1k rent vs $105k).
- Recommended offer: $102k (3.0% below list) — sets the bar for market timing.
- Cap rate 9.7% vs local median 3.5% in Mission — top-decile yield for the area; either an underpriced asset or a hidden risk that comps aren't pricing in. Stress-test before assuming the spread holds.
Location & tenants
- Location reads 75/100 on livability (#148 in TX, #4,155 nationally) — a middle-class / working-renter tenant base. Strengths: cost of living A+, housing A+, health & safety A+; Watch: schools C-, amenities F, commute F.
- Mission CISD (urban): math 15% / reading 28% proficiency, ranked #775 of 826 in TX (top 94%) — low school quality limits family demand, transient renter base, plan for 1-2y turnover; 78% free/reduced lunch — lower-income household profile, screen leases tightly.
- Market conditions: 474 active listings in the ZIP; 16 comparable units currently listed for rent nearby; rentals at typical pace (median 24d on market — plan ~3-4 weeks tenant-placement turnaround); 7,378 units permitted in Hidalgo County in 2024 (641 in 5+ unit buildings).
- This rent runs 30% of the median local income ($52k/yr) — at the standard rent-burdened threshold; future hikes will face affordability resistance.
Forward outlook
- Local home prices are declining (-3.0%/yr); year-one equity from $726 of loan paydown is wiped out by about $3k of value loss. Plan a longer hold.
- Hidalgo County population projected at +28% by 2050 — long-run rental-demand tailwind backs the buy-and-hold thesis.
Negotiation context
- It's been on market 31 days — a 3% lower offer ($102k) is reasonable based on typical stale-listing flexibility.
- 2 sale attempts with the ask held roughly flat each time — persistent listings suggest the price (not the market) is what's stuck; bring a comps-based counter.
Risks & watch-outs
- Watch-outs: flood insurance adds $66/mo.
- Climate carrying-cost: major flood risk; severe wind risk, 99% chance of damaging wind over 30y; extreme-heat days projected 7→21/yr by 2055 (HVAC capex compounding) — expect insurance premiums to compound above CPI over the hold.
Questions for the listing agent
- It's been on market 31 days. Have you received any prior offers? Is the seller open to a 3% concession, seller financing, or rate buy-down credit?
- What's the actual annual flood-insurance premium (NFIP or private), and is the property in a SFHA with mandatory coverage?
- Is there a deadline driving the sale (1031 exchange, divorce, estate, relocation)? That informs how much negotiation room exists.
- What's the average days-on-market for RENTAL listings here right now (not sales)? A rising rental-DOM trend means longer vacancies and softer asking-rent achievability than the comps imply.
- What's the recent tenant-quality profile in this submarket — average credit score on applications, eviction rate, late-payment / NSF rate, and stable-employment percentage? A property-management company in the area should have these aggregated.
- How much new for-sale + rental construction is in the pipeline within 1–3 miles? Heavy new supply typically softens prices + rents 12–24 months out; constrained supply supports both.
Investment metrics
- 1% rule
- 1.25% ✓
- Cap rate
- 9.66%
- Cash-on-cash
- 12.02%
- DSCR
- 1.53
- GRM
- 6.6
CMA / ARV
- ARV (on-the-fly)
- $77,616
- Comps found
- 4
Show comp detail 4 sales within ~0.75 mi
| Address | Dist | Beds/Ba | Sqft | Sold | Price | $/sf | Match |
|---|---|---|---|---|---|---|---|
| 210 Hub Dr | 0.13mi | 2/1.0 | 784 (-1%) | 2mo | $65,000 | $83 | 90 |
| 2900 Spur Dr | 0.12mi | 2/1.0 | 784 (-1%) | 13mo | $69,000 | $88 | 82 |
| 215 Covered Wagon Dr | 0.38mi | 2/1.5 | 784 (-1%) | 14mo | $77,000 | $98 | 67 |
| 202 Stage Coach Dr | 0.28mi | 2/2.0 | 900 (+14%) | 9mo | $142,500 | $158 | 52 |
Match score weights: distance 35% · size 25% · config 20% · recency 20%. Top-matched comps best support the ARV.
Projected returns pro-forma
-3.0% appreciation · 3.0% rent growth · sell at horizon
- IRR
- -2.2%
- Equity multiple
- 0.92×
- Total profit
- $-2,423
- Equity at exit
- $15,656
- IRR
- 7.6%
- Equity multiple
- 1.57×
- Total profit
- $16,882
- Equity at exit
- $9,078
Cash invested: $29,400 (down + closing). Projections, not guarantees.
Landlord ↔ Tenant lean methodology
- Overall (STATE)
- 87 Strongly Landlord-Friendly
- State Texas
- 87 Strongly Landlord-Friendly · R+5
- County
- — inherits STATE
- City
- — inherits STATE
ZIP-level market 78574
- Home prices YoY
- -16.1%
- Active inventory
- 474
- Price-to-rent
- 6.6×
Monthly cashflow live
- Estimated rent
- $1,317 high interval (Pro) →
- Mortgage (P&I)
- −$551
- Tax from tax record
- −$151 /mo · $1,817/yr
- Insurance
- −$44
- Flood insurance flood zone
- −$66 /mo · $798/yr
- HOA
- −$0
- Vacancy / Maint / Mgmt
- −$277
- Net cashflow
- $228
Break-even live
Sensitivity live
| Price | -10% $287 | -5% $258 | +0% $228 | +5% $198 | +10% $169 |
|---|---|---|---|---|---|
| Rent | -10% $124 | -5% $176 | +0% $228 | +5% $280 | +10% $332 |
| Rate | -1.0pp $281 | -0.5pp $255 | base $228 | +0.5pp $201 | +1.0pp $173 |
UW: 25.0% down · 7.5% · 30yr · 1.5% tax · 5.0% vac · 8.0% maint · 8.0% mgmt
Financing live
Cash to close
- Down payment
- $26,250
- Closing costs
- $3,150
- Reserves months
- —
- Total cash needed
- —
Loan-product check · same deal, 3 products live
Conventional
25% down · 7.5% · 30yr
- Down + closing
- —
- Monthly P&I
- —
- Monthly cashflow
- —
- DSCR
- —
- Eligible?
- —
Personal DTI + credit; lowest rate.
DSCR
20% down · 8.5% · 30yr
- Down + closing
- —
- Monthly P&I
- —
- Monthly cashflow
- —
- DSCR
- —
- Eligible?
- —
No personal income docs; deal must DSCR.
Hard money
10% down · 12.0% · 12mo
- Down + closing
- —
- Monthly P&I
- —
- Monthly cashflow
- —
- DSCR
- —
- Eligible?
- —
Short-term bridge; refi at stabilization.
Rent comps 16 comps
| Address | Beds | Baths | Sqft | Rent | $/sqft | DOM | Units | Dist |
|---|---|---|---|---|---|---|---|---|
| 707 Palmer Rd Unit 1 Mission, TX | 2.0 | 2.0 | 760 | $1,200 | $1.58 | 15d | 1 | 0.80mi |
| 707 Palmer Rd Unit 2 Mission, TX | 1.0 | 1.0 | 960 | $900 | $0.94 | 15d | 1 | 0.80mi |
| 707 Palmer Rd Unit 3 Mission, TX | 3.0 | 2.0 | 960 | $1,350 | $1.41 | 15d | 1 | 0.80mi |
| 712 Palmer Rd Unit 1 Mission, TX | 2.0 | 2.0 | 960 | $1,100 | $1.15 | 15d | 1 | 0.86mi |
| 2008 N Cummings Ave Mission, TX | 3.0 | 2.0 | 1012 | $1,300 | $1.28 | 44d | 1 | 0.88mi |
| 1811 Perkins Ave Unit 7 Mission, TX | 2.0 | 1.0 | 850 | $750 | $0.88 | 15d | 1 | 1.00mi |
| 1809 Ramirez St Unit 2 Mission, TX | 3.0 | 2.0 | 1033 | $1,300 | $1.26 | 44d | 1 | 1.16mi |
| 1400 N Dunlap Ave Mission, TX | 2.0 | 1.0 | 1068 | $800 | $0.75 | 19d | 1 | 1.32mi |
| 1006 Fairway Dr Mission, TX | 2.0 | 2.0 | 1072 | $1,100 | $1.03 | 44d | 1 | 1.36mi |
| 2903 Estevan St #3 Mission, TX | 3.0 | 2.0 | 1044 | $1,400 | $1.34 | 15d | 1 | 1.43mi |
| 2905 Estevan St #4 Mission, TX | 3.0 | 2.0 | 1044 | $1,300 | $1.25 | 44d | 1 | 1.43mi |
| 2905 Estevan St #3 Mission, TX | 2.0 | 2.0 | 1044 | $1,300 | $1.25 | 24d | 1 | 1.43mi |
| 2903 Estevan St #4 Mission, TX | 3.0 | 2.0 | 1056 | $1,399 | $1.32 | 19d | 1 | 1.43mi |
| 1805 Ramirez St Unit 4 Mission, TX | 3.0 | 2.0 | 1020 | $1,095 | $1.07 | 44d | 1 | 1.47mi |
| 1804 Ramirez St Unit 1 Mission, TX | 3.0 | 2.0 | 1020 | $1,250 | $1.23 | 24d | 1 | 1.49mi |
| 1500 E 24th St Unit B-6 Mission, TX | 2.0 | 2.0 | 1010 | $975 | $0.97 | 44d | 1 | 1.49mi |
Listing history 19 events
-
2026-06-18days on market $105,000 Active 31 DOM
-
2026-06-17days on market $105,000 Active 30 DOM
-
2026-06-16days on market $105,000 Active 29 DOM
-
2026-06-15days on market $105,000 Active 28 DOM
-
2026-06-14days on market $105,000 Active 26 DOM
-
2026-06-10days on market $105,000 Active 23 DOM
-
2026-06-09days on market $105,000 Active 22 DOM
-
2026-06-08days on market $105,000 Active 21 DOM
-
2026-06-07days on market $105,000 Active 20 DOM
-
2026-06-03days on market $105,000 Active 16 DOM
-
2026-06-02days on market $105,000 Active 15 DOM
-
2026-06-01days on market $105,000 Active 14 DOM
-
2026-05-31days on market $105,000 Active 13 DOM
-
2026-05-31days on market $105,000 Active 12 DOM
-
2026-05-18$105,000 Active
-
2025-12-22soldstatus
-
2025-12-19soldstatus Sold 773-char remark
Show marketing remark (773 chars)
Welcome to easy living in the desirable Wagon City North, a friendly and well-maintained 55+ community in the heart of Mission, Texas! Own your own lot in this move-in ready furnished 2-bedroom, 2-bath mobile home, 2 living areas which features a spacious open layout, large windows for natural light, and a cozy 2nd living area perfect for enjoying your morning coffee. The kitchen area offers ample cabinet space, a built-in hutch area and comes with all major appliances. Other features include fully furnished, central A/C and heating, storage shed, golf cart storage, and covered porch. Community amenities include a Clubhouse with planned social activities, swimming pool, shuffleboard courts, library and game room. Located just minutes from shopping and dining.
-
2025-10-22status Pending 773-char remark
Show marketing remark (773 chars)
Welcome to easy living in the desirable Wagon City North, a friendly and well-maintained 55+ community in the heart of Mission, Texas! Own your own lot in this move-in ready furnished 2-bedroom, 2-bath mobile home, 2 living areas which features a spacious open layout, large windows for natural light, and a cozy 2nd living area perfect for enjoying your morning coffee. The kitchen area offers ample cabinet space, a built-in hutch area and comes with all major appliances. Other features include fully furnished, central A/C and heating, storage shed, golf cart storage, and covered porch. Community amenities include a Clubhouse with planned social activities, swimming pool, shuffleboard courts, library and game room. Located just minutes from shopping and dining.
-
2025-10-20$74,500 Active 773-char remark
Show marketing remark (773 chars)
Welcome to easy living in the desirable Wagon City North, a friendly and well-maintained 55+ community in the heart of Mission, Texas! Own your own lot in this move-in ready furnished 2-bedroom, 2-bath mobile home, 2 living areas which features a spacious open layout, large windows for natural light, and a cozy 2nd living area perfect for enjoying your morning coffee. The kitchen area offers ample cabinet space, a built-in hutch area and comes with all major appliances. Other features include fully furnished, central A/C and heating, storage shed, golf cart storage, and covered porch. Community amenities include a Clubhouse with planned social activities, swimming pool, shuffleboard courts, library and game room. Located just minutes from shopping and dining.
ⓘ Source: listings_history table (triggers on properties + properties_extension) + one-shot
backfill from property_details.listing_events for pre-trigger history.
Tax reassessment forecast TX · Resets to sale price
- Current annual tax
- $1,817 · $151/mo
- Projected year-2 tax
- $1,922 · $160/mo
- Expected delta
- +$105/yr (+$9/mo · 5.8%)
ⓘ Screening estimate from a state-policy table — verify with the county assessor before closing.
Climate risk First Street
- Flood 7/10 Severe FEMA zone X · 96% chance over 30 yrs
- Wildfire 1/10 Low
- Heat 9/10 Extreme 7 d/yr ≥111°F today · 21 d/yr by 30 yrs out
- Wind 8/10 Severe 99% chance of damaging wind over 30 yrs
- Air quality 2/10 Low 1 unhealthy d/yr today · 2 by 30 yrs out
Nearby sold comps map
Loading sold comps map…
Walkable amenities ~0.75 mi
Loading nearby amenities…
Taxation est. · year 1
- Rental income
- $15,800
- − Mortgage interest
- −$5,882
- − Property taxes
- −$1,817
- − Insurance
- −$1,322
- − Repairs & maintenance
- −$1,264
- − Management
- −$1,264
- − Depreciation
- −$3,055
- Taxable income
- $1,197
- Est. tax owed @ 24.0%
- −$287
- After-tax cash flow
- $2,448/yr
For passive investors: Depreciation is non-cash, so a rental often shows a tax loss while cash-flowing — sheltering income. Rental losses are passive: they offset passive income freely, and up to $25,000/yr can offset ordinary (W-2) income if you actively participate and your MAGI is under $100k (phasing out to $0 by $150k); unused losses carry forward. On sale, claimed depreciation is recaptured at up to 25%, and gains may owe capital-gains tax (a 1031 exchange can defer both). Figures are a year-1 estimate at your 24.0% rate — not tax advice; consult a CPA.
Schools (NCES district)
- District
- Mission CISD
- NCES district ID
- 4831040
- Math proficiency
- 15% ▼ -35.00%
- Reading proficiency
- 28% ▼ -15.00%
- Median HH income
- $32,855
- Composite
- 17.47/100
- National rank
- #9061
- State rank
- #775 of 826 in TX
Livability — Mission
- Score
- 75/100
- State rank
- #148
- US rank
- #4155
Category grades
Schools grade is shown separately in the Schools card above.
Census & demographics
- Census place
- Mission, TX
- County
- Hidalgo County · 623,128 people
- City population
- 78,024
- Metro
- McAllen-Edinburg-Mission, TX
- Population (ZIP)
- 62,456
- Household income
- $52,393
- Rent vs Own
- Severe rent burden
- 803.0
Population outlook (Hidalgo County) Hauer SSP2
- Today (2025)
- 955,232 people
- By 2030
- 1,009,774 · +5.7%
- By 2040
- 1,120,332 · +17.3%
- By 2050
- 1,225,036 · +28.2%
- By 2075
- 1,439,189 · +50.7%
- By 2100
- 1,533,429 · +60.5%
Race, ethnicity, and origin ACS 2023
- Neighborhood character
- Predominantly Hispanic (97%)
- Race & ethnicity
- Hispanic / Latino 97% Two or more races 62% White 2%
- Hispanic origin (detail)
- Mexican 93%
- Foreign-born
- 33% · Canada
- Languages at home
- 12% English-only · Spanish 87%
Political lean MEDSL · Hidalgo
- 2024 margin
- Toss-up / Even · D 48.1% · R 51.0%
- 2008→2024 swing
- -41.6pp toward R · 2008: 38.7pp · 2024: -2.9pp
- All cycles
- 2024: R+2.9 2020: D+17.1 2016: D+40.5 2012: D+41.8 2008: D+38.7
Not yet ingested
- Civics
- —
Market trends
- HPI YoY
- ▼ -44.13%
- Current HPI
- 230.3323
- Rent YoY
- —
- Metro
- McAllen-Edinburg-Mission, TX
- State GDP YoY
- ▲ 3.95%
- F500 in state
- 110
Industry mix (Fortune 500 HQ in TX)
| Industry | F500 HQs | Revenue |
|---|---|---|
| Energy | 16 | $1,198B |
|
||
| Technology | 5 | $198B |
|
||
| Engineering / Construction | 4 | $72B |
|
||
| Energy Services | 3 | $60B |
|
||
| Utilities | 3 | $41B |
|
||
| Healthcare | 2 | $330B |
|
||
Price history
+40.9% since first listed5 events — show timeline
- 2026-05-18 Listed $105,000 FSBO.com
- 2025-12-22 Sold (Public Records) — Public Records
- 2025-12-19 Sold (MLS) — MCALLENMLS
- 2025-10-22 Pending — MCALLENMLS
- 2025-10-20 Listed $74,500 MCALLENMLS
Property tax history
+5.2%/yrLatest (2025): $1,817 · +10.0% YoY. Source: county tax records.
Cash-flow waterfall
monthlySold comps — $/sqft
last 12 mo · ≤1 miLoading sold comps…