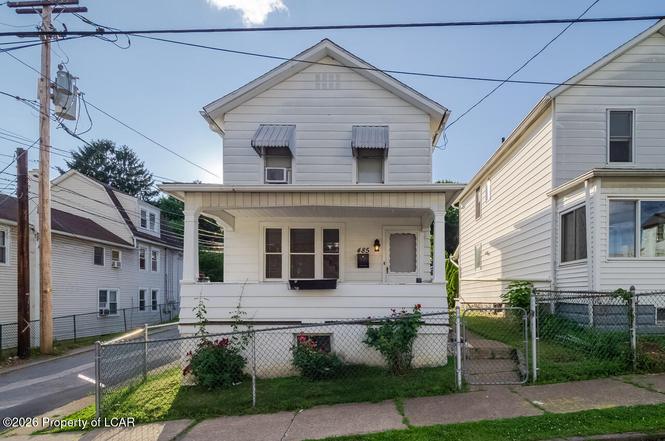
485 Grant St · Wilkes-Barre, PA
Flood risk 1/10 · Minimal
- FEMA flood zone
- X (unshaded)
- Chance of flooding over 30 yrs
- 0.0%
- Est. flood insurance / yr
- $507 – $1,088
Fire risk 4/10 · Minor
- Est. fire insurance / yr
- $511 – $949
Heat risk 4/10 · Minor
- Hot days now (above 90°F)
- 7 days/yr
- Hot days in 30 yrs
- 16 days/yr
Wind risk 3/10 · Minor
- Chance of severe wind over 30 yrs
- 5.0%
Air-quality risk 2/10 · Minimal
- Unhealthy air days now
- 1 days/yr
- Unhealthy air days in 30 yrs
- 2 days/yr
Risk factors via First Street. Map © Google.
Why this score? — see what drove the D- grade
The composite is a weighted blend of 9 inputs, each scored 0–100. Each bar is that input's sub-score; the figure is the points it added to the 100-point composite (weight × sub-score).
- Cash flow +16.2/30.0
- DSCR +5.0/10.0
- 1% rule +4.4/10.0
- Rent growth +4.2/5.0
- ARV discount +2.7/15.0
- Livability +2.5/5.0
- Condition / age +2.5/5.0
- Schools +2.1/10.0
- Appreciation +0.0/10.0
$135,000
🖨 Deal sheet (PDF) 📄 Offer letter ✓ Due diligence
Listing remarks
Welcome Home to this well maintained 2 bedroom, 1 bath residence offering comfort, convenience and outdoor enjoyment. The spacious eat in kitchen features a cozy breakfast nook. Enjoy first floor laundry, making everyday living a breeze. Upstairs you will find two large bedrooms , one with oversized walk in closet. Step outside to a fully fenced in yard. Cool off this summer with your above
Key facts
- Breakfast nook
- Eat in kitchen
- First floor laundry
Tags
Property features AI
Exterior
- Utilities: Public water; Public sewer; Cable available
- Home design: Single-family residence; Two stories
- Construction: Vinyl siding
- Exterior features: Front porch; Fenced yard
Interior
- Kitchen: Eat-in kitchen
- Bathrooms: 1 full bathroom
- Heating & cooling: Natural gas heating with baseboard units; Window cooling units; Ceiling fans
- Interior features: Eat-in kitchen; Full unfinished basement
- Laundry & utility: Gas water heater
Neighborhood map
What this means for you Summary
Snapshot
- This is a 2-bed/1.0-bath single-family listed at $135k.
Deal economics
- At list price, monthly cash flow is $71 ($856/yr) — positive.
- The deal already cash-flows at list — no discount required.
- To meet the 1% rule (rent ≥ 1% of price), the offer needs to be $127k (5.8% below list).
- Recommended offer: $127k (5.8% below list) — sets the bar for 1% rule.
Location & tenants
- Location reads: area grade D — affects rentability + tenant quality, not the cash-flow math above.
- Wilkes-Barre Area SD (urban): math 19% / reading 32% proficiency, ranked #469 of 539 in PA (top 87%) — low school quality limits family demand, transient renter base, plan for 1-2y turnover; 61% free/reduced lunch — lower-income household profile, screen leases tightly.
- Zoned schools: Dodson El Sch (math 2% / reading 22%, grade F, #1,362 of 1,518 statewide, top 92%, 486 students, 100% FRL); G A R Ms (math 17% / reading 22%, grade F, #444 of 512 statewide, top 87%, 1,026 students, 100% FRL) — zoned schools average 100% FRL vs 61% district-wide (39 pts higher); higher-poverty schools than district average — tighter screening recommended.
- Market conditions: Rents rising fast (+6.8%/yr); 225 active listings in the ZIP; 40 comparable units currently listed for rent nearby; rentals at typical pace (median 23d on market — plan ~3-4 weeks tenant-placement turnaround); 45% of comp listings sitting > 30 days — soft ceiling on asking rent; 349 units permitted in Luzerne County in 2024 (16 in 5+ unit buildings).
Forward outlook
- Local home prices are declining (-3.0%/yr); year-one equity from $933 of loan paydown is wiped out by about $4k of value loss. Plan a longer hold.
- Luzerne County population projected at +4% by 2050 — modest demand growth; plan on rents tracking national, not racing it.
Negotiation context
- Only 1 days on market — expect competitive offers; lowballing is unlikely to land.
Risks & watch-outs
- Watch-outs: built in 1900 — expect roof / HVAC / electrical / plumbing capex.
Questions for the listing agent
- Built in 1900 — when were the roof, HVAC, electrical panel, plumbing, and water heater last replaced?
- Is there a deadline driving the sale (1031 exchange, divorce, estate, relocation)? That informs how much negotiation room exists.
- The area grade is low — what's the realistic commute time and amenity access for the typical tenant pool here? Any planned neighborhood developments (good or bad) we should know about?
- What's the average days-on-market for RENTAL listings here right now (not sales)? A rising rental-DOM trend means longer vacancies and softer asking-rent achievability than the comps imply.
- What's the recent tenant-quality profile in this submarket — average credit score on applications, eviction rate, late-payment / NSF rate, and stable-employment percentage? A property-management company in the area should have these aggregated.
- How much new for-sale + rental construction is in the pipeline within 1–3 miles? Heavy new supply typically softens prices + rents 12–24 months out; constrained supply supports both.
Investment metrics
- 1% rule
- 0.94% ✗
- Cap rate
- 6.93%
- Cash-on-cash
- 2.26%
- DSCR
- 1.10
- GRM
- 8.8
CMA / ARV
- ARV (on-the-fly)
- $121,952
- Comps found
- 12
Show comp detail 12 sales within ~0.75 mi
| Address | Dist | Beds/Ba | Sqft | Sold | Price | $/sf | Match |
|---|---|---|---|---|---|---|---|
| 22 Bruce Ln | 0.37mi | 3/1.0 (+1) | 1,173 (-1%) | 1mo | $125,000 | $107 | 75 |
| 127 Loomis St | 0.29mi | 2/2.0 | 1,245 (+5%) | 0mo | $124,000 | $100 | 74 |
| 131 Stanton St | 0.44mi | 3/1.0 (+1) | 1,200 (+1%) | 0mo | $110,500 | $92 | 72 |
| 299 Lehigh St | 0.38mi | 3/1.0 (+1) | 1,150 (-3%) | 3mo | $120,000 | $104 | 70 |
| 290 Hazle St | 0.19mi | 3/1.5 (+1) | 1,088 (-8%) | 0mo | $152,000 | $140 | 70 |
| 64 Prospect St | 0.42mi | 3/1.0 (+1) | 1,231 (+4%) | 1mo | $123,000 | $100 | 68 |
| 71 Prospect St | 0.41mi | 3/1.0 (+1) | 1,120 (-5%) | 0mo | $115,000 | $103 | 67 |
| 255 Lehigh St | 0.34mi | 3/1.5 (+1) | 1,100 (-7%) | 0mo | $170,000 | $155 | 65 |
| 230 Poplar St | 0.60mi | 3/1.0 (+1) | 1,200 (+1%) | 5mo | $90,000 | $75 | 61 |
| 368 S Meade St | 0.26mi | 3/1.5 (+1) | 1,341 (+13%) | 2mo | $165,000 | $123 | 57 |
| 17 Griffith Ln | 0.44mi | 2/1.0 | 1,024 (-14%) | 2mo | $82,500 | $81 | 55 |
| 287 Andover St | 0.64mi | 3/2.0 (+1) | 1,312 (+11%) | 2mo | $120,000 | $91 | 42 |
Match score weights: distance 35% · size 25% · config 20% · recency 20%. Top-matched comps best support the ARV.
Projected returns pro-forma
-3.0% appreciation · 6.84% rent growth · sell at horizon
- IRR
- -8.5%
- Equity multiple
- 0.68×
- Total profit
- $-12,214
- Equity at exit
- $20,129
- IRR
- 5.5%
- Equity multiple
- 1.47×
- Total profit
- $17,947
- Equity at exit
- $11,672
Cash invested: $37,800 (down + closing). Projections, not guarantees.
Landlord ↔ Tenant lean methodology
- Overall (STATE)
- 62 Landlord-Friendly
- State Pennsylvania
- 62 Landlord-Friendly · EVEN
- County
- — inherits STATE
- City
- — inherits STATE
ZIP-level market 18702
- Rents YoY
- 6.8%
- Active inventory
- 225
- Price-to-rent
- 8.8×
Monthly cashflow live
- Estimated rent
- $1,271 high interval (Pro) →
- Mortgage (P&I)
- −$708
- Tax est. 1.5%
- −$169 /mo · $2,025/yr
- Insurance
- −$56
- HOA
- −$0
- Vacancy / Maint / Mgmt
- −$267
- Net cashflow
- $71
Break-even live
Sensitivity live
| Price | -10% $165 | -5% $118 | +0% $71 | +5% $25 | +10% $-22 |
|---|---|---|---|---|---|
| Rent | -10% $-29 | -5% $21 | +0% $71 | +5% $122 | +10% $172 |
| Rate | -1.0pp $139 | -0.5pp $106 | base $71 | +0.5pp $36 | +1.0pp $1 |
UW: 25.0% down · 7.5% · 30yr · 1.5% tax · 5.0% vac · 8.0% maint · 8.0% mgmt
Financing live
Cash to close
- Down payment
- $33,750
- Closing costs
- $4,050
- Reserves months
- —
- Total cash needed
- —
Loan-product check · same deal, 3 products live
Conventional
25% down · 7.5% · 30yr
- Down + closing
- —
- Monthly P&I
- —
- Monthly cashflow
- —
- DSCR
- —
- Eligible?
- —
Personal DTI + credit; lowest rate.
DSCR
20% down · 8.5% · 30yr
- Down + closing
- —
- Monthly P&I
- —
- Monthly cashflow
- —
- DSCR
- —
- Eligible?
- —
No personal income docs; deal must DSCR.
Hard money
10% down · 12.0% · 12mo
- Down + closing
- —
- Monthly P&I
- —
- Monthly cashflow
- —
- DSCR
- —
- Eligible?
- —
Short-term bridge; refi at stabilization.
Rent comps 40 comps
| Address | Beds | Baths | Sqft | Rent | $/sqft | DOM | Units | Dist |
|---|---|---|---|---|---|---|---|---|
| 32 Murray St Unit 34 Wilkes-Barre, PA | 3.0 | 1.0 | 930 | $1,100 | $1.18 | 23d | 1 | 0.13mi |
| 62 Hutson St Unit 1 Wilkes-Barre, PA | 2.0 | 1.0 | 730 | $1,250 | $1.71 | 15d | 1 | 0.23mi |
| 62 Hutson St Wilkes Barre, PA | 2.0 | 1.0 | 1100 | $1,150 | $1.05 | 45d | 1 | 0.23mi |
| 407 McLean St Wilkes Barre, PA | 3.0 | 1.0 | 1482 | $1,400 | $0.94 | 15d | 1 | 0.47mi |
| 239 Poplar St Wilkes Barre, PA | 3.0 | 1.5 | 1100 | $1,350 | $1.23 | 45d | 1 | 0.59mi |
| 233 Gilligan St Wilkes Barre, PA | 3.0 | 1.0 | 1440 | $1,600 | $1.11 | 23d | 1 | 0.64mi |
| 132 Sambourne St Wilkes Barre, PA | 2.0 | 1.0 | 1000 | $1,250 | $1.25 | 23d | 1 | 0.65mi |
| 26 Bradford St Wilkes Barre, PA | 3.0 | 1.5 | 1056 | $1,400 | $1.33 | 15d | 1 | 0.71mi |
| 403 S Franklin St Wilkes Barre, PA | 2.0 | 1.0 | 900 | $1,050 | $1.17 | 23d | 1 | 0.73mi |
| 44 Eagle Ct Wilkes Barre, PA | 1.0–3.0 | 1.0–1.5 | 910 | $1,722 | $1.89 | 15d | 5 | 0.74mi |
| 75 Wood St Wilkes Barre, PA | 2.0 | 1.0 | 990 | $1,300 | $1.31 | 45d | 1 | 0.80mi |
| 366 S River St Apt 3 Wilkes-Barre, PA | 1.0 | 1.0 | 1000 | $975 | $0.97 | 23d | 1 | 0.82mi |
| 83 S Empire St Unit 1 Wilkes-Barre, PA | 1.0 | 1.0 | 900 | $850 | $0.94 | 23d | 1 | 0.85mi |
| 100 E Newport St Hanover Township, PA | 2.0 | 1.5 | 1344 | $1,250 | $0.93 | 45d | 1 | 0.85mi |
| 131 Academy St Wilkes Barre, PA | 3.0 | 1.0 | 1300 | $1,500 | $1.15 | 45d | 1 | 0.86mi |
| 100-102 Westminster St Wilkes-Barre, PA | 2.0 | 1.0 | 1200 | $1,150 | $0.96 | 23d | 1 | 0.89mi |
| 100-102 Westminster St Wilkes-Barre, PA | 2.0 | 1.0 | 1100 | $1,150 | $1.05 | 15d | 1 | 0.89mi |
| 780 Hazle St Unit Rear 2nd Fl Ashley, PA | 2.0 | 1.0 | 850 | $975 | $1.15 | 15d | 1 | 0.90mi |
| 155 W River St Wilkes Barre, PA | 3.0 | 2.0 | 1100 | $1,425 | $1.30 | 45d | 1 | 0.91mi |
| 150 S Franklin St Wilkes Barre, PA | 2.0 | 1.0 | 850 | $1,750 | $2.06 | 45d | 1 | 0.93mi |
| 34 Barney St Fl Right Wilkes-Barre, PA | 2.0 | 1.0 | 1000 | $1,195 | $1.20 | 45d | 1 | 0.95mi |
| 92 S Diamond St Wilkes-Barre, PA | 3.0 | 1.0 | 1150 | $1,400 | $1.22 | 45d | 1 | 0.97mi |
| 2 S Empire St Unit 2R Wilkes-Barre, PA | 2.0 | 1.0 | 850 | $1,250 | $1.47 | 23d | 1 | 1.00mi |
| 36 Logan St Wilkes-Barre, PA | 3.0 | 1.0 | 1200 | $1,125 | $0.94 | 45d | 1 | 1.01mi |
| 154 Hanover St Unit A Wilkes-Barre, PA | 1.0 | 1.0 | 1050 | $1,150 | $1.10 | 45d | 1 | 1.01mi |
| 156 Hanover St Wilkes Barre, PA | 3.0 | 1.0 | 850 | $1,300 | $1.53 | 15d | 1 | 1.01mi |
| 26 Stanley St Wilkes Barre, PA | 2.0 | 1.0 | 950 | $1,650 | $1.74 | 45d | 1 | 1.02mi |
| 67-69 Public Sq #1203 Wilkes Barre, PA | 2.0 | 1.0 | 875 | $1,825 | $2.09 | 45d | 1 | 1.04mi |
| 67-69 Public Sq Wilkes-Barre, PA | 2.0 | 1.0 | 910 | $1,875 | $2.06 | 45d | 1 | 1.06mi |
| 99 N Main St Ashley, PA | 3.0 | 1.0 | 700 | $1,095 | $1.56 | 45d | 1 | 1.08mi |
| 284 Barney St Wilkes Barre, PA | 3.0 | 1.0 | 1070 | $1,600 | $1.50 | 46d | 1 | 1.15mi |
| 159 New Mallery Pl Unit 2 Wilkes-Barre, PA | 2.0 | 1.0 | 1020 | $950 | $0.93 | 45d | 1 | 1.16mi |
| 38 W Market St Unit 3 Wilkes-Barre, PA | 2.0 | 1.0 | 1388 | $1,295 | $0.93 | 15d | 1 | 1.16mi |
| 224 New Mallery Pl Wilkes Barre, PA | 2.0 | 1.0 | 850 | $1,000 | $1.18 | 15d | 1 | 1.22mi |
| 216 Horton St Wilkes Barre, PA | 3.0 | 1.5 | 1475 | $1,575 | $1.07 | 45d | 1 | 1.23mi |
| 19 N River St Unit 403 Wilkes-Barre, PA | 2.0 | 1.0 | 723 | $1,600 | $2.21 | 15d | 1 | 1.23mi |
| 19 N River St Unit 308 Wilkes-Barre, PA | 2.0 | 1.5 | 910 | $1,600 | $1.76 | 15d | 1 | 1.23mi |
| 68 Circle Dr Hanover Township, PA | 3.0 | 1.5 | 950 | $1,800 | $1.89 | 15d | 1 | 1.23mi |
| 129 Carlisle St Wilkes Barre, PA | 2.0 | 1.0 | 1005 | $1,200 | $1.19 | 15d | 1 | 1.25mi |
| 166 Brook St Wilkes Barre, PA | 1.0 | 1.0 | 850 | $1,100 | $1.29 | 15d | 1 | 1.29mi |
Listing history 3 events
-
2026-06-18status $135,000 Pending 1 DOM
-
2026-06-16remarks 393-char remark
-
2026-06-16$135,000 Active 1 DOM
ⓘ Source: listings_history table (triggers on properties + properties_extension) + one-shot
backfill from property_details.listing_events for pre-trigger history.
Climate risk First Street
- Flood 1/10 Low FEMA zone X (unshaded) · 0% chance over 30 yrs
- Wildfire 4/10 Moderate
- Heat 4/10 Moderate 7 d/yr ≥90°F today · 16 d/yr by 30 yrs out
- Wind 3/10 Moderate 5% chance of damaging wind over 30 yrs
- Air quality 2/10 Low 1 unhealthy d/yr today · 2 by 30 yrs out
Nearby sold comps map
Loading sold comps map…
Walkable amenities ~0.75 mi
Loading nearby amenities…
Taxation est. · year 1
- Rental income
- $15,255
- − Mortgage interest
- −$7,562
- − Property taxes
- −$2,025
- − Insurance
- −$675
- − Repairs & maintenance
- −$1,220
- − Management
- −$1,220
- − Depreciation
- −$3,927
- Taxable loss
- −$1,375
- Est. tax savings @ 24.0%
- +$330
- After-tax cash flow
- $1,186/yr
For passive investors: Depreciation is non-cash, so a rental often shows a tax loss while cash-flowing — sheltering income. Rental losses are passive: they offset passive income freely, and up to $25,000/yr can offset ordinary (W-2) income if you actively participate and your MAGI is under $100k (phasing out to $0 by $150k); unused losses carry forward. On sale, claimed depreciation is recaptured at up to 25%, and gains may owe capital-gains tax (a 1031 exchange can defer both). Figures are a year-1 estimate at your 24.0% rate — not tax advice; consult a CPA.
Schools (NCES district)
- District
- Wilkes-Barre Area SD
- NCES district ID
- 4226300
- Math proficiency
- 19% ▼ -2.00%
- Reading proficiency
- 32% ▼ -9.00%
- Median HH income
- $37,420
- Composite
- 21.22/100
- National rank
- #8409
- State rank
- #469 of 539 in PA
Livability — Wilkes-Barre
No livability data for this city. (Only ~50 U.S. cities are tracked.)
Census & demographics
- Census place
- Wilkes-Barre, PA
- County
- Luzerne County · 118,885 people
- City population
- 73,981
- Metro
- Scranton--Wilkes-Barre, PA
- Population (ZIP)
- 41,970
- Household income
- $56,378
- Rent vs Own
- Severe rent burden
- 1632.0
Population outlook (Luzerne County) Hauer SSP2
- Today (2025)
- 319,505 people
- By 2030
- 319,943 · +0.1%
- By 2040
- 322,643 · +1.0%
- By 2050
- 330,817 · +3.5%
- By 2075
- 379,145 · +18.7%
- By 2100
- 431,908 · +35.2%
Race, ethnicity, and origin ACS 2023
- Neighborhood character
- Diverse neighborhood (Simpson 0.59)
- Race & ethnicity
- White 58% Hispanic / Latino 25% Black 12% Two or more races 11% Asian 2%
- Hispanic origin (detail)
- Mexican 6% Puerto Rican 6% Dominican 9%
- Common ancestry
- Romanian 14% Scotch-Irish 2% Iranian 1%
- Foreign-born
- 13% · Canada, Jamaica
- Languages at home
- 79% English-only · Spanish 17% Other Asian/Pacific 1% Other Indo-European 1%
Political lean MEDSL · Luzerne
- 2024 margin
- R (+19.2) · D 40.0% · R 59.2%
- 2008→2024 swing
- -27.6pp toward R · 2008: 8.4pp · 2024: -19.2pp
- All cycles
- 2024: R+19.2 2020: R+14.4 2016: R+19.6 2012: D+4.8 2008: D+8.4
Not yet ingested
- Civics
- —
Market trends
- HPI YoY
- ▼ -156.99%
- Current HPI
- 216.9373
- Rent YoY
- ▲ 6.84%
- Metro
- Scranton--Wilkes-Barre, PA
- State GDP YoY
- ▲ 1.68%
- F500 in state
- 34
Industry mix (Fortune 500 HQ in PA)
| Industry | F500 HQs | Revenue |
|---|---|---|
| Healthcare | 2 | $309B |
|
||
| Insurance | 2 | $27B |
|
||
| Telecommunications / Media | 1 | $124B |
|
||
| Industrial Distribution | 1 | $22B |
|
||
| Financial Services | 1 | $20B |
|
||
| Chemicals / Materials | 1 | $18B |
|
||
Price history
1 event — show timeline
- 2026-06-16 Listed $135,000 LCAR
Property tax history
+20.4%/yrLatest (2026): $9,043 · +0.1% YoY. Source: county tax records.
Cash-flow waterfall
monthlySold comps — $/sqft
last 12 mo · ≤1 miLoading sold comps…