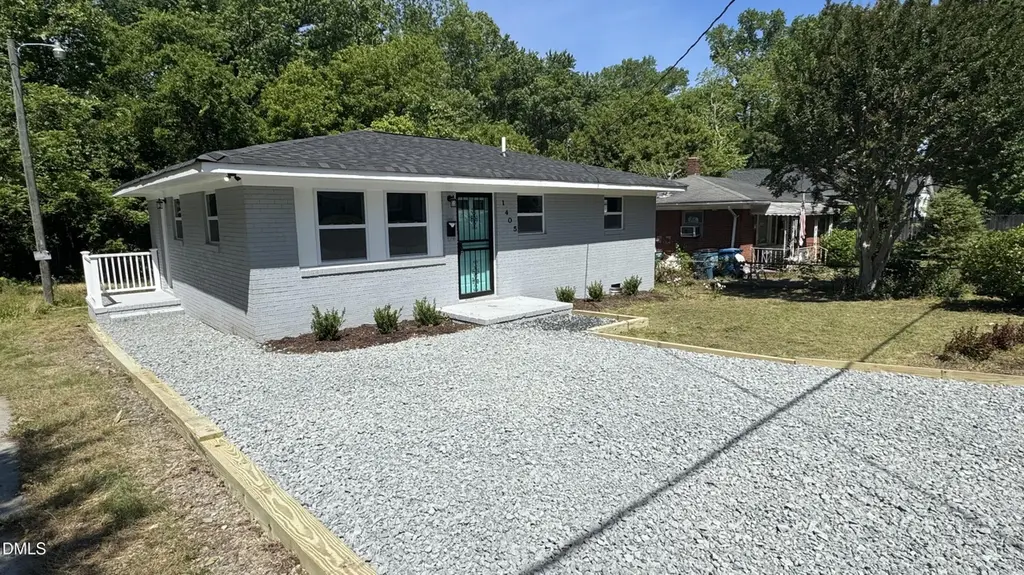
1405 N Hyde Park Ave · Durham, NC
Flood risk 6/10 · Moderate
- FEMA flood zone
- X (unshaded)
- Chance of flooding over 30 yrs
- 0.73%
- Est. flood insurance / yr
- $507 – $1,088
Fire risk 1/10 · Minimal
- Est. fire insurance / yr
- $906 – $1,684
Heat risk 6/10 · Moderate
- Hot days now (above 106°F)
- 7 days/yr
- Hot days in 30 yrs
- 16 days/yr
Wind risk 6/10 · Moderate
- Chance of severe wind over 30 yrs
- 27.0%
Air-quality risk 2/10 · Minimal
- Unhealthy air days now
- 1 days/yr
- Unhealthy air days in 30 yrs
- 1 days/yr
Risk factors via First Street. Map © Google.
Why this score? — see what drove the F grade
The composite is a weighted blend of 9 inputs, each scored 0–100. Each bar is that input's sub-score; the figure is the points it added to the 100-point composite (weight × sub-score).
- Cash flow +8.1/30.0
- ARV discount +8.0/15.0
- Livability +4.0/5.0
- Rent growth +3.3/5.0
- Schools +3.0/10.0
- Condition / age +2.5/5.0
- DSCR +2.2/10.0
- 1% rule +1.8/10.0
- Appreciation +0.0/10.0
$258,900
🖨 Deal sheet (PDF) 📄 Offer letter ✓ Due diligence
Listing remarks
Step into move-in ready charm with this fully renovated, 3 Bedroom 1 Bath all-brick ranch located in the heart of Durham's desirable Hyde Park area. Meticulously updated from top to bottom, this single-level home now offers three bedrooms and one pristine full bath, blending classic curb appeal with modern finishes and a thoughtful open flow. Highlights you'll love: All-brick exterior with new roof -- timeless, low-maintenance curb appeal Completely remodeled interior -- new flooring, fresh paint, modern trim, and upgraded lighting throughout Gourmet-style kitchen -- brand-new cabinetry, quartz countertops, stainless steel appliances, and a roomy workspace for cooking and entertaining L
Key facts
- Quartz countertops
- Brand new cabinetry
- All brick exterior
Tags
Property features AI
Finance
- Other: Property located in Durham County, postal code 27701
- HOA & community: No homeowners association
Exterior
- Utilities: Public water; Public sewer
- Home design: Site-built single-story home; One level
- Construction: Brick construction; Brick/mortar foundation; Architectural shingle roof; Built as site-built structure
- Exterior features: Lot approximately 0.14 acres; Publicly maintained road access
Interior
- Kitchen: Dishwasher; Electric range; Microwave
- Bedrooms: 3 bedrooms (all on the main level)
- Flooring: Ceramic tile; Laminate
- Bathrooms: 1 full bathroom
- Heating & cooling: Central heating; Forced air; Gas pack (natural gas); Central air conditioning (electric)
- Interior features: Dishwasher; Electric range; Microwave; Ceramic tile flooring; Laminate flooring; Crawl space basement
Neighborhood map
What this means for you Summary
Snapshot
- This is a 2-bed/1.0-bath single-family listed at $259k.
Deal economics
- At list price, monthly cash flow is $-250 ($-3k/yr) — negative.
- To cash-flow at today's rent, offer at most $215k (17.0% below list).
- To meet the 1% rule (rent ≥ 1% of price), the offer needs to be $175k (32.2% below list).
- Recommended offer: $175k (32.2% below list) — sets the bar for 1% rule.
- Cap rate 5.1% vs local median 3.0% in Durham — top-decile yield for the area; either an underpriced asset or a hidden risk that comps aren't pricing in. Stress-test before assuming the spread holds.
Location & tenants
- Location reads 81/100 on livability (#15 in NC, #1,411 nationally) — a professional / high-income tenant draw. Strengths: amenities A+, commute A+, housing A+; Watch: crime F.
- Durham Public Schools (urban): math 29% / reading 39% proficiency, ranked #132 of 178 in NC (top 74%) — families likely to look elsewhere, expect single-tenant / working-renter base with shorter leases.
- Zoned schools: Northern High (math 30% / reading 35%, grade F, #441 of 535 statewide, top 83%, 1,308 students, 64% FRL).
- Market conditions: Rents rising (+3.2%/yr); 197 active listings in the ZIP; 40 comparable units currently listed for rent nearby; rentals at typical pace (median 22d on market — plan ~3-4 weeks tenant-placement turnaround); 2,905 units permitted in Durham County in 2024 (955 in 5+ unit buildings).
- This rent runs 30% of the median local income ($70k/yr) — at the standard rent-burdened threshold; future hikes will face affordability resistance.
Forward outlook
- Local home prices are declining (-3.0%/yr); year-one equity from $2k of loan paydown is wiped out by about $8k of value loss. Plan a longer hold.
- Durham County population projected at +44% by 2050 — long-run rental-demand tailwind backs the buy-and-hold thesis.
Negotiation context
- It's been on market 39 days — a 3% lower offer ($251k) is reasonable based on typical stale-listing flexibility.
- 3 sale attempts with the ask held roughly flat each time — persistent listings suggest the price (not the market) is what's stuck; bring a comps-based counter.
- Current owner paid $120k; list at $259k implies a 116% gain — meaningful room to come down on a strong offer.
Risks & watch-outs
- Climate carrying-cost: major flood risk; major wind risk, 27% chance of damaging wind over 30y; extreme-heat days projected 7→16/yr by 2055 (HVAC capex compounding) — expect insurance premiums to compound above CPI over the hold.
Questions for the listing agent
- What do current leases actually rent for vs. the listed asking? Can we see a recent rent roll and the last 12 months of T-12 income?
- It's been on market 39 days. Have you received any prior offers? Is the seller open to a 32% concession, seller financing, or rate buy-down credit?
- Built in 1963 — when were the roof, HVAC, electrical panel, plumbing, and water heater last replaced?
- Is there a deadline driving the sale (1031 exchange, divorce, estate, relocation)? That informs how much negotiation room exists.
- Schools are D-rated, which usually means shorter tenancies and higher turnover. Who's the typical renter profile here, and what's been the actual vacancy rate?
- Crime grade is F in this area — have there been break-ins, vandalism, or insurance claims at this property in the last 3 years? What carrier currently insures it and at what premium?
- The area grade is low — what's the realistic commute time and amenity access for the typical tenant pool here? Any planned neighborhood developments (good or bad) we should know about?
- What's the average days-on-market for RENTAL listings here right now (not sales)? A rising rental-DOM trend means longer vacancies and softer asking-rent achievability than the comps imply.
- What's the recent tenant-quality profile in this submarket — average credit score on applications, eviction rate, late-payment / NSF rate, and stable-employment percentage? A property-management company in the area should have these aggregated.
- How much new for-sale + rental construction is in the pipeline within 1–3 miles? Heavy new supply typically softens prices + rents 12–24 months out; constrained supply supports both.
Investment metrics
- 1% rule
- 0.68% ✗
- Cap rate
- 5.14%
- Cash-on-cash
- -4.13%
- DSCR
- 0.82
- GRM
- 12.3
CMA / ARV
- ARV (on-the-fly)
- $262,080
- Comps found
- 12
Show comp detail 12 sales within ~0.75 mi
| Address | Dist | Beds/Ba | Sqft | Sold | Price | $/sf | Match |
|---|---|---|---|---|---|---|---|
| 1309 N Hyde Park Ave | 0.05mi | 3/1.0 (+1) | 875 (+4%) | 7mo | $175,000 | $200 | 80 |
| 919 Chester St | 0.30mi | 2/1.0 | 855 (+2%) | 9mo | $200,000 | $234 | 75 |
| 1522 London Cir | 0.40mi | 2/1.0 | 826 (-2%) | 6mo | $257,500 | $312 | 73 |
| 1402 Robinhood Rd | 0.33mi | 2/1.0 | 808 (-4%) | 11mo | $264,500 | $327 | 70 |
| 1613 Kilmer Ter | 0.45mi | 2/1.0 | 845 (+1%) | 10mo | $249,000 | $295 | 70 |
| 1513 Fairfax Rd | 0.41mi | 2/1.0 | 821 (-2%) | 11mo | $257,400 | $314 | 68 |
| 1804 N Alston Ave | 0.47mi | 2/1.0 | 843 (+0%) | 13mo | $332,000 | $394 | 67 |
| 1114 N Guthrie Ave | 0.48mi | 2/1.0 | 835 (-1%) | 17mo | $260,000 | $311 | 63 |
| 1611 Robinhood Rd | 0.46mi | 2/2.0 | 850 (+1%) | 12mo | $140,000 | $165 | 62 |
| 1107 N Hyde Park Ave | 0.22mi | 3/1.0 (+1) | 960 (+14%) | 6mo | $299,500 | $312 | 55 |
| 1712 Rosetta Dr | 0.53mi | 2/1.0 | 734 (-13%) | 11mo | $280,000 | $381 | 45 |
| 1207 Wall St | 0.75mi | 2/1.0 | 916 (+9%) | 12mo | $155,000 | $169 | 40 |
Match score weights: distance 35% · size 25% · config 20% · recency 20%. Top-matched comps best support the ARV.
Projected returns pro-forma
-3.0% appreciation · 3.25% rent growth · sell at horizon
- IRR
- -23.1%
- Equity multiple
- 0.21×
- Total profit
- $-57,473
- Equity at exit
- $38,603
- IRR
- -17.1%
- Equity multiple
- 0.05×
- Total profit
- $-68,963
- Equity at exit
- $22,385
Cash invested: $72,492 (down + closing). Projections, not guarantees.
Landlord ↔ Tenant lean methodology
- Overall (STATE)
- 85 Strongly Landlord-Friendly
- State North Carolina
- 85 Strongly Landlord-Friendly · R+3
- County
- — inherits STATE
- City
- — inherits STATE
ZIP-level market 27701
- Rents YoY
- 3.2%
- Active inventory
- 197
- Price-to-rent
- 12.3×
Monthly cashflow live
- Estimated rent
- $1,755 high interval (Pro) →
- Mortgage (P&I)
- −$1,358
- Tax from tax record
- −$170 /mo · $2,043/yr
- Insurance
- −$108
- HOA
- −$0
- Vacancy / Maint / Mgmt
- −$369
- Net cashflow
- $-250
Break-even live
Sensitivity live
| Price | -10% $-103 | -5% $-176 | +0% $-250 | +5% $-323 | +10% $-396 |
|---|---|---|---|---|---|
| Rent | -10% $-388 | -5% $-319 | +0% $-250 | +5% $-180 | +10% $-111 |
| Rate | -1.0pp $-119 | -0.5pp $-184 | base $-250 | +0.5pp $-317 | +1.0pp $-385 |
UW: 25.0% down · 7.5% · 30yr · 1.5% tax · 5.0% vac · 8.0% maint · 8.0% mgmt
Financing live
Cash to close
- Down payment
- $64,725
- Closing costs
- $7,767
- Reserves months
- —
- Total cash needed
- —
Loan-product check · same deal, 3 products live
Conventional
25% down · 7.5% · 30yr
- Down + closing
- —
- Monthly P&I
- —
- Monthly cashflow
- —
- DSCR
- —
- Eligible?
- —
Personal DTI + credit; lowest rate.
DSCR
20% down · 8.5% · 30yr
- Down + closing
- —
- Monthly P&I
- —
- Monthly cashflow
- —
- DSCR
- —
- Eligible?
- —
No personal income docs; deal must DSCR.
Hard money
10% down · 12.0% · 12mo
- Down + closing
- —
- Monthly P&I
- —
- Monthly cashflow
- —
- DSCR
- —
- Eligible?
- —
Short-term bridge; refi at stabilization.
Rent comps 40 comps
| Address | Beds | Baths | Sqft | Rent | $/sqft | DOM | Units | Dist |
|---|---|---|---|---|---|---|---|---|
| 1600 N Alston Ave Unit C Durham, NC | 2.0 | 1.0 | 800 | $1,150 | $1.44 | 15d | 1 | 0.26mi |
| 607 Dowd St Durham, NC | 2.0 | 1.0 | 720 | $1,550 | $2.15 | 24d | 1 | 0.35mi |
| 1516 London Cir Durham, NC | 3.0 | 1.0 | 1118 | $1,650 | $1.48 | 24d | 1 | 0.39mi |
| 1609 Evergreen St Durham, NC | 2.0 | 1.0 | 1051 | $1,695 | $1.61 | 22d | 1 | 0.44mi |
| 910 Fiske St Unit B Durham, NC | 2.0 | 1.0 | 750 | $1,025 | $1.37 | 24d | 1 | 0.57mi |
| 916 Fiske St Unit A Durham, NC | 2.0 | 1.0 | 800 | $1,050 | $1.31 | 24d | 1 | 0.57mi |
| 600 N Hyde Park Ave Unit A Durham, NC | 1.0 | 1.0 | 570 | $1,000 | $1.75 | 24d | 1 | 0.58mi |
| 506 Gurley St Unit A Durham, NC | 2.0 | 1.0 | 775 | $1,300 | $1.68 | 15d | 1 | 0.59mi |
| 721 Liberty St Unit C Durham, NC | 2.0 | 1.0 | 800 | $1,495 | $1.87 | 24d | 1 | 0.60mi |
| 905 Bunn Ter Durham, NC | 1.0 | 1.0 | 560 | $875 | $1.56 | 24d | 1 | 0.68mi |
| 208 Gray Ave Apt 4H Durham, NC | 2.0 | 1.0 | 800 | $1,250 | $1.56 | 24d | 1 | 0.72mi |
| 807 E Main St Durham, NC | 1.0 | 1.0 | 1000 | $1,695 | $1.70 | 24d | 2 | 0.78mi |
| 200 W Geer St Unit 200-C Durham, NC | 2.0 | 1.0 | 850 | $1,400 | $1.65 | 15d | 1 | 0.84mi |
| 1828 Liberty St Unit B Durham, NC | 2.0 | 1.0 | 1100 | $1,450 | $1.32 | 15d | 1 | 0.92mi |
| 500 E Main St Durham, NC | 3.0 | 1.0–2.0 | 1002 | $2,920 | $2.91 | 15d | 40 | 0.93mi |
| 1237 Naples Pl Durham, NC | 1.0–4.0 | 1.0–2.0 | 995 | $1,233 | $1.24 | 12d | 1 | 0.94mi |
| 311 W Corporation St Durham, NC | 2.0 | 1.0–2.0 | 691 | $3,505 | $5.07 | 22d | 5 | 0.96mi |
| 311 W Corporation St Unit 3-201 Durham, NC | 2.0 | 2.0 | 985 | $3,355 | $3.41 | 24d | 1 | 0.96mi |
| 321 W Corporation St Durham, NC | 2.0 | 2.0 | 977 | $2,530 | $2.59 | 15d | 1 | 0.97mi |
| 815 Madison St Durham, NC | 2.0 | 1.0–2.0 | 859 | $2,854 | $3.32 | 22d | 5 | 0.98mi |
| 318 W Corporation St Durham, NC | 3.0 | 1.0–2.0 | 900 | $2,934 | $3.26 | 15d | 55 | 1.00mi |
| 518 N Hardee St Durham, NC | 1.0–2.0 | 1.0–1.5 | 665 | $1,299 | $1.95 | 24d | 1 | 1.01mi |
| 201 Raynor St Durham, NC | 1.0 | 1.0 | 600 | $1,150 | $1.92 | 24d | 1 | 1.02mi |
| 103 Young Ave Durham, NC | 1.0 | 1.0 | 600 | $945 | $1.57 | 24d | 1 | 1.02mi |
| 308 W Trinity Ave Unit 19 Durham, NC | 1.0 | 1.0 | 595 | $1,100 | $1.85 | 15d | 1 | 1.06mi |
| 620 Foster St Durham, NC | 2.0 | 1.0–2.0 | 888 | $3,303 | $3.72 | 15d | 43 | 1.07mi |
| 620 Foster St Unit 817 Durham, NC | 1.0 | 1.0 | 578 | $1,903 | $3.29 | 22d | 1 | 1.08mi |
| 317 W Trinity Ave Unit J Durham, NC | 1.0 | 1.0 | 575 | $1,275 | $2.22 | 24d | 1 | 1.08mi |
| 317 W Trinity Ave Unit C Durham, NC | 1.0 | 1.0 | 575 | $1,275 | $2.22 | 22d | 1 | 1.08mi |
| 530 Foster St Durham, NC | 2.0 | 1.0–2.0 | 918 | $2,750 | $3.00 | 15d | 18 | 1.09mi |
| 464 E Pettigrew St Durham, NC | 2.0 | 2.0 | 1091 | $2,786 | $2.55 | 15d | 1 | 1.11mi |
| 545 Foster St Durham, NC | 2.0 | 1.0–2.0 | 910 | $2,722 | $2.99 | 15d | 2 | 1.12mi |
| 110 N Corcoran St Durham, NC | 1.0–2.0 | 1.0–2.0 | 1219 | $4,594 | $3.77 | 15d | 8 | 1.12mi |
| 510 E Pettigrew St Durham, NC | 3.0 | 1.0–2.0 | 996 | $2,510 | $2.52 | 15d | 29 | 1.15mi |
| 406 Green St Durham, NC | 2.0 | 1.0 | 912 | $1,990 | $2.18 | 24d | 1 | 1.16mi |
| 504 E Pettigrew St Durham, NC | 2.0 | 1.0–2.0 | 1025 | $2,219 | $2.16 | 15d | 35 | 1.16mi |
| 504 E Pettigrew St Durham, NC | 3.0 | 1.0–2.0 | 1092 | $2,255 | $2.07 | 22d | 30 | 1.16mi |
| 441 S Dillard St Durham, NC | 1.0–3.0 | 1.0–2.5 | 1153 | $2,454 | $2.13 | 15d | 21 | 1.17mi |
| 2408 Hart St Durham, NC | 3.0 | 1.0 | 960 | $1,445 | $1.51 | 24d | 1 | 1.20mi |
| 2011 Aiken Ave Durham, NC | 3.0 | 2.0 | 1120 | $1,595 | $1.42 | 24d | 1 | 1.23mi |
Listing history 25 events
-
2026-06-18days on market $258,900 Active 39 DOM
-
2026-06-17days on market $258,900 Active 38 DOM
-
2026-06-16days on market $258,900 Active 37 DOM
-
2026-06-15days on market $258,900 Active 36 DOM
-
2026-06-14pricedays on market $258,900 Active 34 DOM
-
2026-06-10days on market $259,900 Active 31 DOM
-
2026-06-09days on market $259,900 Active 30 DOM
-
2026-06-08days on market $259,900 Active 29 DOM
-
2026-06-07days on market $259,900 Active 28 DOM
-
2026-06-05days on market $259,900 Active 25 DOM
-
2026-06-03days on market $259,900 Active 24 DOM
-
2026-06-02days on market $259,900 Active 23 DOM
-
2026-06-01days on market $259,900 Active 22 DOM
-
2026-05-31days on market $259,900 Active 21 DOM
-
2026-05-30days on market $259,900 Active 20 DOM
-
2026-05-10$259,900 Active
-
2026-04-15historical
-
2026-03-05$259,900 Active
-
2026-01-22historical
-
2025-11-14price $249,900
-
2025-11-06price $259,900
-
2025-10-20price $269,900
-
2025-10-16price $274,900
-
2025-10-03$279,900 Active
-
2025-06-13soldstatus $120,000
ⓘ Source: listings_history table (triggers on properties + properties_extension) + one-shot
backfill from property_details.listing_events for pre-trigger history.
Tax reassessment forecast NC · Resets to sale price
- Current annual tax
- $2,043 · $170/mo
- Projected year-2 tax
- $2,123 · $177/mo
- Expected delta
- +$80/yr (+$7/mo · 3.9%)
ⓘ Screening estimate from a state-policy table — verify with the county assessor before closing.
Climate risk First Street
- Flood 6/10 Major FEMA zone X (unshaded) · 73% chance over 30 yrs
- Wildfire 1/10 Low
- Heat 6/10 Major 7 d/yr ≥106°F today · 16 d/yr by 30 yrs out
- Wind 6/10 Major 27% chance of damaging wind over 30 yrs
- Air quality 2/10 Low 1 unhealthy d/yr today · 1 by 30 yrs out
Nearby sold comps map
Loading sold comps map…
Walkable amenities ~0.75 mi
Loading nearby amenities…
Taxation est. · year 1
- Rental income
- $21,058
- − Mortgage interest
- −$14,502
- − Property taxes
- −$2,043
- − Insurance
- −$1,294
- − Repairs & maintenance
- −$1,685
- − Management
- −$1,685
- − Depreciation
- −$7,532
- Taxable loss
- −$7,683
- Est. tax savings @ 24.0%
- +$1,844
- After-tax cash flow
- $-1,151/yr
For passive investors: Depreciation is non-cash, so a rental often shows a tax loss while cash-flowing — sheltering income. Rental losses are passive: they offset passive income freely, and up to $25,000/yr can offset ordinary (W-2) income if you actively participate and your MAGI is under $100k (phasing out to $0 by $150k); unused losses carry forward. On sale, claimed depreciation is recaptured at up to 25%, and gains may owe capital-gains tax (a 1031 exchange can defer both). Figures are a year-1 estimate at your 24.0% rate — not tax advice; consult a CPA.
Schools (NCES district)
- District
- Durham Public Schools
- NCES district ID
- 3701260
- Math proficiency
- 29% ▼ -3.00%
- Reading proficiency
- 39% ▲ 2.00%
- Median HH income
- $52,143
- Composite
- 29.69/100
- National rank
- #6457
- State rank
- #132 of 178 in NC
Livability — Durham
- Score
- 81/100
- State rank
- #15
- US rank
- #1411
Category grades
Schools grade is shown separately in the Schools card above.
Census & demographics
- Census place
- Durham, NC
- County
- Durham County · 288,747 people
- City population
- 288,747
- Metro
- Durham-Chapel Hill, NC
- Population (ZIP)
- 24,793
- Household income
- $69,740
- Rent vs Own
- Severe rent burden
- 1402.0
Population outlook (Durham County) Hauer SSP2
- Today (2025)
- 368,962 people
- By 2030
- 402,686 · +9.1%
- By 2040
- 468,677 · +27.0%
- By 2050
- 531,727 · +44.1%
- By 2075
- 660,446 · +79.0%
- By 2100
- 739,971 · +100.6%
Race, ethnicity, and origin ACS 2023
- Neighborhood character
- Diverse neighborhood (Simpson 0.69)
- Race & ethnicity
- White 40% Black 32% Hispanic / Latino 19% Two or more races 9% Asian 3%
- Hispanic origin (detail)
- Mexican 9%
- Common ancestry
- Romanian 2% Italian 2% Slovak 2%
- Foreign-born
- 18% · Canada, Vietnam
- Languages at home
- 76% English-only · Spanish 18% Other Indo-European 2% German/W. Germanic 1%
Political lean MEDSL · Durham
- 2024 margin
- Solid D (+61.9) · D 80.2% · R 18.2% · Other 1.6%
- 2008→2024 swing
- +10.0pp toward D · 2008: 51.9pp · 2024: 61.9pp
- All cycles
- 2024: D+61.9 2020: D+62.4 2016: D+60.4 2012: D+52.7 2008: D+51.9
Not yet ingested
- Civics
- —
Market trends
- HPI YoY
- ▼ -272.19%
- Current HPI
- 347.5371
- Rent YoY
- ▲ 3.25%
- Metro
- Durham-Chapel Hill, NC
- State GDP YoY
- ▲ 3.28%
- F500 in state
- 26
Industry mix (Fortune 500 HQ in NC)
| Industry | F500 HQs | Revenue |
|---|---|---|
| Financial Services | 2 | $213B |
|
||
| Retail | 2 | $95B |
|
||
| Industrial Conglomerate | 1 | $38B |
|
||
| Metals / Steel | 1 | $35B |
|
||
| Utilities | 1 | $30B |
|
||
| Industrial Machinery | 1 | $19B |
|
||
Price history
+116.6% since first listed10 events — show timeline
- 2026-05-10 Listed $259,900 TMLS
- 2026-04-15 Listing Removed — TMLS
- 2026-03-05 Listed $259,900 TMLS
- 2026-01-22 Listing Removed — TMLS
- 2025-11-14 Price Changed $249,900 TMLS
- 2025-11-06 Price Changed $259,900 TMLS
- 2025-10-20 Price Changed $269,900 TMLS
- 2025-10-16 Price Changed $274,900 TMLS
- 2025-10-03 Listed $279,900 TMLS
- 2025-06-13 Sold (Public Records) $120,000 Public Records
Property tax history
+6.3%/yrLatest (2025): $2,043 · +370.9% YoY. Source: county tax records.
Cash-flow waterfall
monthlySold comps — $/sqft
last 12 mo · ≤1 miLoading sold comps…