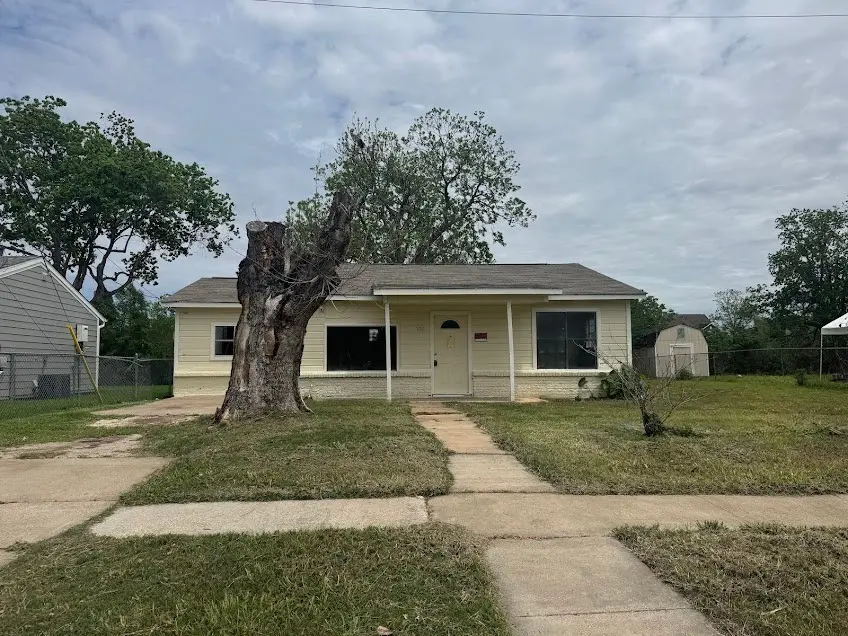
702 E Park St · Sugar Land, TX
Flood risk 3/10 · Minor
- FEMA flood zone
- X (unshaded)
- Chance of flooding over 30 yrs
- 0.2%
- Est. flood insurance / yr
- $507 – $1,088
Fire risk 1/10 · Minimal
- Est. fire insurance / yr
- $1,222 – $2,270
Heat risk 9/10 · Severe
- Hot days now (above 110°F)
- 7 days/yr
- Hot days in 30 yrs
- 21 days/yr
Wind risk 9/10 · Severe
- Chance of severe wind over 30 yrs
- 99.0%
Air-quality risk 2/10 · Minimal
- Unhealthy air days now
- 2 days/yr
- Unhealthy air days in 30 yrs
- 2 days/yr
Risk factors via First Street. Map © Google.
Why this score? — see what drove the D grade
The composite is a weighted blend of 9 inputs, each scored 0–100. Each bar is that input's sub-score; the figure is the points it added to the 100-point composite (weight × sub-score).
- Cash flow +14.1/30.0
- ARV discount +7.9/15.0
- Schools +4.5/10.0
- DSCR +4.3/10.0
- Livability +4.0/5.0
- 1% rule +3.8/10.0
- Rent growth +2.7/5.0
- Condition / age +2.5/5.0
- Appreciation +0.0/10.0
$229,999
🖨 Deal sheet 📄 Offer letter ✓ Due diligence
Listing remarks MLS
NEW LISTING on OYSTER CREEK! We just listed this great home that is located along the peaceful banks of Oyster Creek, this inviting home offers scenic WATERFRONT VIEWS! It features MANY RECENT IMPROVEMENTS including fresh interior paint, foundation repairs, and upgraded kitchen and bathrooms, making it move-in ready with room to make it your own. Nestled in the quiet MAYFIELD PARK neighborhood—surrounded by parks, trails, and lakes—you'll enjoy both nature and convenience. With easy access to Highway 90 and State Highway 6, everything you need is just minutes away. WE MAKE IT EASY TO OWN. This is a great opportunity! Don't wait, call us today to get more information on the owner's easy terms and smooth process that may be able to put the deed in your name and make this your dream home.
Key facts
- Waterfront views
- Upgraded kitchen
- Parks trails lakes
Tags
Neighborhood map
What this means for you Summary
Snapshot
- This is a 3-bed/2.0-bath single-family listed at $230k.
Deal economics
- At list price, monthly cash flow is $33 ($394/yr) — positive.
- The deal already cash-flows at list — no discount required.
- To meet the 1% rule (rent ≥ 1% of price), the offer needs to be $202k (12.3% below list).
- Recommended offer: $202k (12.3% below list) — sets the bar for 1% rule.
- Cap rate 6.5% vs local median 2.6% in Sugar Land — top-decile yield for the area; either an underpriced asset or a hidden risk that comps aren't pricing in. Stress-test before assuming the spread holds.
Location & tenants
- Location reads 80/100 on livability (#38 in TX, #1,758 nationally) — a professional / high-income tenant draw. Strengths: crime A+, employment A+, housing A+; Watch: cost of living D, commute F.
- Fort Bend ISD (suburban): math 44% / reading 53% proficiency, ranked #140 of 826 in TX (top 17%) — families likely to look elsewhere, expect single-tenant / working-renter base with shorter leases.
- Market conditions: Rents flat; 277 active listings in the ZIP; 12 comparable units currently listed for rent nearby; rentals leasing fast (median 10d on market — plan ~1-2 weeks tenant-placement turnaround); solid renter incomes; 12,093 units permitted in Fort Bend County in 2024 (815 in 5+ unit buildings).
Forward outlook
- Local home prices are declining (-3.0%/yr); year-one equity from $2k of loan paydown is wiped out by about $7k of value loss. Plan a longer hold.
- Fort Bend County population projected at +75% by 2050 — long-run rental-demand tailwind backs the buy-and-hold thesis.
Negotiation context
- It's been on market 104 days — a 9% lower offer ($209k) is reasonable based on typical stale-listing flexibility.
- 2 sale attempts with the ask held roughly flat each time — persistent listings suggest the price (not the market) is what's stuck; bring a comps-based counter.
Risks & watch-outs
- Climate carrying-cost: severe wind risk, 99% chance of damaging wind over 30y; extreme-heat days projected 7→21/yr by 2055 (HVAC capex compounding) — expect insurance premiums to compound above CPI over the hold.
Questions for the listing agent
- It's been on market 104 days. Have you received any prior offers? Is the seller open to a 12% concession, seller financing, or rate buy-down credit?
- Built in 1964 — when were the roof, HVAC, electrical panel, plumbing, and water heater last replaced?
- Why hasn't it sold? Are there any deal-killer items the seller is aware of (foundation, flood, title, zoning, code violations)?
- Is there a deadline driving the sale (1031 exchange, divorce, estate, relocation)? That informs how much negotiation room exists.
- Schools are A-rated — typically a magnet for longer-tenancy family renters. What's the average tenant stay here, and is there a school-zone premium baked into asking?
- The area grade is low — what's the realistic commute time and amenity access for the typical tenant pool here? Any planned neighborhood developments (good or bad) we should know about?
- What's the average days-on-market for RENTAL listings here right now (not sales)? A rising rental-DOM trend means longer vacancies and softer asking-rent achievability than the comps imply.
- What's the recent tenant-quality profile in this submarket — average credit score on applications, eviction rate, late-payment / NSF rate, and stable-employment percentage? A property-management company in the area should have these aggregated.
- How much new for-sale + rental construction is in the pipeline within 1–3 miles? Heavy new supply typically softens prices + rents 12–24 months out; constrained supply supports both.
Investment metrics
- 1% rule
- 0.88% ✗
- Cap rate
- 6.46%
- Cash-on-cash
- 0.61%
- DSCR
- 1.03
- GRM
- 9.5
CMA / ARV
- ARV (median comp)
- $232,171
- List price
- $229,999
- Delta
- -0.94%
- Verdict
- FAIR
- Comps
- 20 within 1.0 mi
Show comp detail 4 sales within ~0.75 mi
| Address | Dist | Beds/Ba | Sqft | Sold | Price | $/sf | Match |
|---|---|---|---|---|---|---|---|
| 135 Avenue F | 0.13mi | 3/2.0 | 1,272 (+6%) | 17mo | $205,000 | $161 | 70 |
| 607 Lakeview Dr | 0.66mi | 2/2.0 (-1) | 1,226 (+2%) | 5mo | $325,000 | $265 | 56 |
| 715 West Park St | 0.18mi | 2/1.0 (-1) | 1,135 (-5%) | 24mo | $240,000 | $211 | 54 |
| 223 Brooks St | 0.71mi | 2/1.5 (-1) | 1,230 (+2%) | 15mo | $499,900 | $406 | 43 |
Match score weights: distance 35% · size 25% · config 20% · recency 20%. Top-matched comps best support the ARV.
Projected returns pro-forma
-3.0% appreciation · 0.61% rent growth · sell at horizon
- IRR
- -18.0%
- Equity multiple
- 0.38×
- Total profit
- $-39,900
- Equity at exit
- $34,294
- IRR
- -15.5%
- Equity multiple
- 0.22×
- Total profit
- $-50,526
- Equity at exit
- $19,886
Cash invested: $64,400 (down + closing). Projections, not guarantees.
Landlord ↔ Tenant lean methodology
- Overall (STATE)
- 87 Strongly Landlord-Friendly
- State Texas
- 87 Strongly Landlord-Friendly · R+5
- County
- — inherits STATE
- City
- — inherits STATE
ZIP-level market 77498
- Home prices YoY
- -10.6%
- Rents YoY
- 0.6%
- Active inventory
- 277
- Price-to-rent
- 9.5×
Monthly cashflow live
- Estimated rent
- $2,017 high interval (Pro) →
- Mortgage (P&I)
- −$1,206
- Tax from tax record
- −$258 /mo · $3,100/yr
- Insurance
- −$96
- HOA
- −$0
- Vacancy / Maint / Mgmt
- −$423
- Net cashflow
- $33
Break-even live
UW: 25.0% down · 7.5% · 30yr · 1.5% tax · 5.0% vac · 8.0% maint · 8.0% mgmt
Financing live
Cash to close
- Down payment
- $57,500
- Closing costs
- $6,900
- Reserves months
- —
- Total cash needed
- —
Loan-product check · same deal, 3 products live
Conventional
25% down · 7.5% · 30yr
- Down + closing
- —
- Monthly P&I
- —
- Monthly cashflow
- —
- DSCR
- —
- Eligible?
- —
Personal DTI + credit; lowest rate.
DSCR
20% down · 8.5% · 30yr
- Down + closing
- —
- Monthly P&I
- —
- Monthly cashflow
- —
- DSCR
- —
- Eligible?
- —
No personal income docs; deal must DSCR.
Hard money
10% down · 12.0% · 12mo
- Down + closing
- —
- Monthly P&I
- —
- Monthly cashflow
- —
- DSCR
- —
- Eligible?
- —
Short-term bridge; refi at stabilization.
Rent comps 12 comps
| Address | Beds | Baths | Sqft | Rent | $/sqft | DOM | Units | Dist |
|---|---|---|---|---|---|---|---|---|
| 856 Imperial Blvd Sugar Land, TX | 2.0 | 2.0 | 1044 | $1,764 | $1.69 | 43d | 1 | 0.58mi |
| 850 Imperial Blvd Sugar Land, TX | 1.0–2.0 | 1.0–2.0 | 996 | $2,840 | $2.85 | 3d | 8 | 0.60mi |
| 2 Stadium Dr Sugar Land, TX | 1.0–2.0 | 1.0–2.0 | 938 | $2,362 | $2.52 | 2d | 17 | 0.64mi |
| 12106 Addicks-Howell Rd Sugar Land, TX | 2.0 | 2.0 | 1051 | $1,590 | $1.51 | 43d | 1 | 1.37mi |
| 12100 S Texas 6 Unit 12133 Sugar Land, TX | 3.0 | 2.0 | 1300 | $2,329 | $1.79 | 10d | 1 | 1.37mi |
| 12100 S Texas 6 Unit 12157 Sugar Land, TX | 2.0 | 2.0 | 903 | $1,349 | $1.49 | 10d | 1 | 1.37mi |
| 12100 S Texas 6 Unit 2538 Sugar Land, TX | 2.0 | 2.0 | 1286 | $1,652 | $1.28 | 43d | 1 | 1.37mi |
| 12100 S Texas 6 Unit 2188 Sugar Land, TX | 2.0 | 2.0 | 1298 | $1,556 | $1.20 | 43d | 1 | 1.37mi |
| 12100 S Texas 6 Unit 2162 Sugar Land, TX | 2.0 | 2.0 | 903 | $1,325 | $1.47 | 5d | 1 | 1.37mi |
| 12100 S Texas 6 #3165 Sugar Land, TX | 3.0 | 2.0 | 1300 | $2,297 | $1.77 | 2d | 1 | 1.37mi |
| 12100 S Texas 6 #2165 Sugar Land, TX | 2.0 | 2.0 | 903 | $1,317 | $1.46 | 2d | 1 | 1.37mi |
| 12100 S Texas 6 #2047 Sugar Land, TX | 2.0 | 2.0 | 903 | $1,360 | $1.51 | 11d | 1 | 1.37mi |
Listing history 16 events
-
2026-06-18days on market $229,999 Active 104 DOM
-
2026-06-17days on market $229,999 Active 103 DOM
-
2026-06-16days on market $229,999 Active 102 DOM
-
2026-06-15days on market $229,999 Active 101 DOM
-
2026-06-13days on market $229,999 Active 99 DOM
-
2026-06-09days on market $229,999 Active 95 DOM
-
2026-06-07days on market $229,999 Active 93 DOM
-
2026-06-04days on market $229,999 Active 90 DOM
-
2026-06-03days on market $229,999 Active 89 DOM
-
2026-06-02days on market $229,999 Active 88 DOM
-
2026-06-01days on market $229,999 Active 87 DOM
-
2026-05-31days on market $229,999 Active 86 DOM
-
2026-03-06historical
Show marketing remark (808 chars)
NEW LISTING on OYSTER CREEK! We just listed this great home that is located along the peaceful banks of Oyster Creek, this inviting home offers scenic WATERFRONT VIEWS! It features MANY RECENT IMPROVEMENTS including fresh interior paint, foundation repairs, and upgraded kitchen and bathrooms, making it move-in ready with room to make it your own. Nestled in the quiet MAYFIELD PARK neighborhood—surrounded by parks, trails, and lakes—you'll enjoy both nature and convenience. With easy access to Highway 90 and State Highway 6, everything you need is just minutes away. WE MAKE IT EASY TO OWN. This is a great opportunity! Don't wait, call us today to get more information on the owner's easy terms and smooth process that may be able to put the deed in your name and make this your dream home.
-
2026-03-06$229,999 Active 808-char remark
Show marketing remark (808 chars)
NEW LISTING on OYSTER CREEK! We just listed this great home that is located along the peaceful banks of Oyster Creek, this inviting home offers scenic WATERFRONT VIEWS! It features MANY RECENT IMPROVEMENTS including fresh interior paint, foundation repairs, and upgraded kitchen and bathrooms, making it move-in ready with room to make it your own. Nestled in the quiet MAYFIELD PARK neighborhood—surrounded by parks, trails, and lakes—you'll enjoy both nature and convenience. With easy access to Highway 90 and State Highway 6, everything you need is just minutes away. WE MAKE IT EASY TO OWN. This is a great opportunity! Don't wait, call us today to get more information on the owner's easy terms and smooth process that may be able to put the deed in your name and make this your dream home.
-
2026-02-17price $229,999
-
2025-10-20$234,999 Active
ⓘ Source: listings_history table (triggers on properties + properties_extension) + one-shot
backfill from property_details.listing_events for pre-trigger history.
Tax reassessment forecast TX · Resets to sale price
- Current annual tax
- $3,100 · $258/mo
- Projected year-2 tax
- $4,209 · $351/mo
- Expected delta
- +$1,109/yr (+$92/mo · 35.8%)
ⓘ Screening estimate from a state-policy table — verify with the county assessor before closing.
Climate risk First Street
- Flood 3/10 Moderate FEMA zone X (unshaded) · 20% chance over 30 yrs
- Wildfire 1/10 Low
- Heat 9/10 Extreme 7 d/yr ≥110°F today · 21 d/yr by 30 yrs out
- Wind 9/10 Extreme 99% chance of damaging wind over 30 yrs
- Air quality 2/10 Low 2 unhealthy d/yr today · 2 by 30 yrs out
Nearby sold comps map
Loading sold comps map…
Walkable amenities ~0.75 mi
Loading nearby amenities…
Taxation est. · year 1
- Rental income
- $24,200
- − Mortgage interest
- −$12,884
- − Property taxes
- −$3,100
- − Insurance
- −$1,150
- − Repairs & maintenance
- −$1,936
- − Management
- −$1,936
- − Depreciation
- −$6,691
- Taxable loss
- −$3,496
- Est. tax savings @ 24.0%
- +$839
- After-tax cash flow
- $1,234/yr
For passive investors: Depreciation is non-cash, so a rental often shows a tax loss while cash-flowing — sheltering income. Rental losses are passive: they offset passive income freely, and up to $25,000/yr can offset ordinary (W-2) income if you actively participate and your MAGI is under $100k (phasing out to $0 by $150k); unused losses carry forward. On sale, claimed depreciation is recaptured at up to 25%, and gains may owe capital-gains tax (a 1031 exchange can defer both). Figures are a year-1 estimate at your 24.0% rate — not tax advice; consult a CPA.
Schools (NCES district)
- District
- Fort Bend ISD
- NCES district ID
- 4819650
- Math proficiency
- 44% ▼ -15.00%
- Reading proficiency
- 53% ▼ -4.00%
- Median HH income
- $82,360
- Composite
- 44.61/100
- National rank
- #2779
- State rank
- #140 of 826 in TX
Livability — Sugar Land
- Score
- 80/100
- State rank
- #38
- US rank
- #1758
Category grades
Schools grade is shown separately in the Schools card above.
Census & demographics
- Census place
- Sugar Land, TX
- County
- Fort Bend County · 836,777 people
- City population
- 168,209
- Metro
- Houston-The Woodlands-Sugar Land, TX
- Population (ZIP)
- 52,806
- Household income
- $100,950
- Rent vs Own
- Severe rent burden
- 1252.0
Population outlook (Fort Bend County) Hauer SSP2
- Today (2025)
- 1,004,526 people
- By 2030
- 1,153,104 · +14.8%
- By 2040
- 1,453,718 · +44.7%
- By 2050
- 1,753,781 · +74.6%
- By 2075
- 2,455,772 · +144.5%
- By 2100
- 2,930,528 · +191.7%
Race, ethnicity, and origin ACS 2023
- Neighborhood character
- Highly diverse neighborhood (Simpson 0.76)
- Race & ethnicity
- Asian 28% White 27% Hispanic / Latino 22% Black 20% Two or more races 9%
- Hispanic origin (detail)
- Mexican 14%
- Common ancestry
- Italian 1% Ukrainian 1% Arab 1%
- Foreign-born
- 33% · Canada, Vietnam, China
- Languages at home
- 47% English-only · Spanish 18% Other Indo-European 10% Vietnamese 7%
Political lean MEDSL · Fort Bend
- 2024 margin
- Toss-up / Even · D 49.5% · R 47.9% · Other 2.6%
- 2008→2024 swing
- +4.0pp toward D · 2008: -2.4pp · 2024: 1.6pp
- All cycles
- 2024: D+1.6 2020: D+10.6 2016: D+6.6 2012: R+6.8 2008: R+2.4
Not yet ingested
- Civics
- —
Market trends
- HPI YoY
- ▼ -29.01%
- Current HPI
- 245.1437
- Rent YoY
- ▲ 0.61%
- Metro
- Houston-The Woodlands-Sugar Land, TX
- State GDP YoY
- ▲ 3.95%
- F500 in state
- 110
Industry mix (Fortune 500 HQ in TX)
| Industry | F500 HQs | Revenue |
|---|---|---|
| Energy | 16 | $1,198B |
|
||
| Technology | 5 | $198B |
|
||
| Engineering / Construction | 4 | $72B |
|
||
| Energy Services | 3 | $60B |
|
||
| Utilities | 3 | $41B |
|
||
| Healthcare | 2 | $330B |
|
||
Price history
-2.1% since first listed4 events — show timeline
- 2026-03-06 Listed $229,999 HARMLS
- 2026-03-06 Listing Removed — HARMLS
- 2026-02-17 Price Changed $229,999 HARMLS
- 2025-10-20 Listed $234,999 HARMLS
Property tax history
+5.9%/yrLatest (2025): $3,100 · -15.5% YoY. Source: county tax records.
Cash-flow waterfall
monthlySold comps — $/sqft
last 12 mo · ≤1 miLoading sold comps…