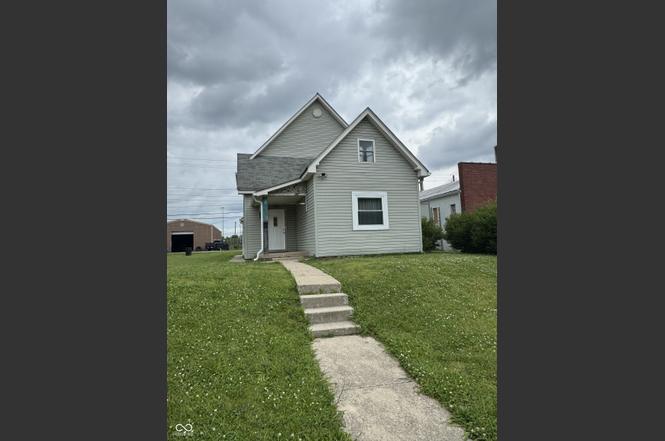
2116 E Brookside Ave · Indianapolis city (balance), IN
Flood risk 1/10 · Minimal
- FEMA flood zone
- X (unshaded)
- Chance of flooding over 30 yrs
- 0.0%
- Est. flood insurance / yr
- $473 – $860
Fire risk 1/10 · Minimal
- Est. fire insurance / yr
- $717 – $1,331
Heat risk 4/10 · Minor
- Hot days now (above 102°F)
- 7 days/yr
- Hot days in 30 yrs
- 19 days/yr
Wind risk 2/10 · Minimal
- Chance of severe wind over 30 yrs
- 0.0%
Air-quality risk 4/10 · Minor
- Unhealthy air days now
- 5 days/yr
- Unhealthy air days in 30 yrs
- 7 days/yr
Risk factors via First Street. Map © Google.
Why this score? — see what drove the C+ grade
The composite is a weighted blend of 9 inputs, each scored 0–100. Each bar is that input's sub-score; the figure is the points it added to the 100-point composite (weight × sub-score).
- Cash flow +24.0/30.0
- ARV discount +15.0/15.0
- DSCR +7.7/10.0
- 1% rule +5.4/10.0
- Rent growth +2.7/5.0
- Livability +2.5/5.0
- Condition / age +2.5/5.0
- Schools +1.4/10.0
- Appreciation +0.0/10.0
$147,000
🖨 Deal sheet 📄 Offer letter ✓ Due diligence
Listing remarks
This spacious 4-bedroom home features a desirable floor plan with the primary bedroom conveniently located on the main level and three additional bedrooms upstairs. The kitchen is equipped with stainless steel appliances, including a refrigerator, dishwasher, and gas stove, as well as a center island with a cooktop, making it perfect for cooking and entertaining. Additional features include a water softener and a convenient location with easy access to the interstate, providing a quick commute to shopping, dining, and other amenities.
Key facts
- Water softener
- Convenient location
- 5,227 sq ft lot
Tags
Property features AI
Exterior
- Security: Security system
- Utilities: Public water; Municipal sewer connection; Cable connected
- Home design: Single-family residence; One-and-one-half story
- Construction: Vinyl siding; Block foundation
- Exterior features: Less than 1/4 acre lot
Interior
- Kitchen: Electric cooktop; Dishwasher; Garbage disposal; Over-the-range microwave (microhood); Refrigerator
- Bedrooms: Four bedrooms total — one on the main level and three on the upper level
- Bathrooms: Two full bathrooms; Primary bathroom with garden tub and full shower stall
- Heating & cooling: Natural gas heating; Central air conditioning
- Interior features: Kitchen island; Basement
- Laundry & utility: Laundry connections on main level
Neighborhood map
What this means for you Summary
Snapshot
- This is a 2-bed/2.0-bath single-family listed at $147k.
Deal economics
- At list price, monthly cash flow is $288 ($3k/yr) — positive.
- The deal already cash-flows at list — no discount required.
- Meets the 1% rule at list price ($2k rent vs $147k).
- Cap rate 8.6% vs local median 4.4% in Indianapolis city (balance) — top-decile yield for the area; either an underpriced asset or a hidden risk that comps aren't pricing in. Stress-test before assuming the spread holds.
Location & tenants
- Location reads: area grade C — affects rentability + tenant quality, not the cash-flow math above.
- Indianapolis Public Schools (urban): math 14% / reading 20% proficiency, ranked #286 of 301 in IN (top 95%) — low school quality limits family demand, transient renter base, plan for 1-2y turnover; 77% free/reduced lunch — lower-income household profile, screen leases tightly.
- Zoned schools: Brookside School 54 (math 3% / reading 4%, grade F, #986 of 994 statewide, top 99%, 331 students, 78% FRL); Arsenal Technical High School (math 6% / reading 27%, grade F, #353 of 369 statewide, top 96%, 2,366 students, 74% FRL) — zoned schools at 76% FRL track the district average.
- Market conditions: Rents flat; 334 active listings in the ZIP; 40 comparable units currently listed for rent nearby; rentals at typical pace (median 24d on market — plan ~3-4 weeks tenant-placement turnaround); 45% of comp listings sitting > 30 days — soft ceiling on asking rent; lower-income renter base — watch delinquency; 1,906 units permitted in Marion County in 2024 (621 in 5+ unit buildings).
- At $1,534/mo this rent would consume 48% of the median local household income ($38k/yr) (locally 2340% of renters already pay >50% of income on rent) — very limited rent-growth headroom before tenants either downsize or default.
Forward outlook
- Local home prices are declining (-3.0%/yr); year-one equity from $1k of loan paydown is wiped out by about $4k of value loss. Plan a longer hold.
- Marion County population projected at +18% by 2050 — long-run rental-demand tailwind backs the buy-and-hold thesis.
Negotiation context
- Only 8 days on market — expect competitive offers; lowballing is unlikely to land.
- Current owner paid $50k; list at $147k implies a 194% gain — meaningful room to come down on a strong offer.
Risks & watch-outs
- Watch-outs: built in 1955 — expect roof / HVAC / electrical / plumbing capex.
Questions for the listing agent
- Built in 1955 — when were the roof, HVAC, electrical panel, plumbing, and water heater last replaced?
- Is there a deadline driving the sale (1031 exchange, divorce, estate, relocation)? That informs how much negotiation room exists.
- What's the average days-on-market for RENTAL listings here right now (not sales)? A rising rental-DOM trend means longer vacancies and softer asking-rent achievability than the comps imply.
- What's the recent tenant-quality profile in this submarket — average credit score on applications, eviction rate, late-payment / NSF rate, and stable-employment percentage? A property-management company in the area should have these aggregated.
- How much new for-sale + rental construction is in the pipeline within 1–3 miles? Heavy new supply typically softens prices + rents 12–24 months out; constrained supply supports both.
Investment metrics
- 1% rule
- 1.04% ✓
- Cap rate
- 8.65%
- Cash-on-cash
- 8.40%
- DSCR
- 1.37
- GRM
- 8.0
CMA / ARV
- ARV (on-the-fly)
- $222,180
- Comps found
- 12
Show comp detail 12 sales within ~0.75 mi
| Address | Dist | Beds/Ba | Sqft | Sold | Price | $/sf | Match |
|---|---|---|---|---|---|---|---|
| 2528 E 17th St | 0.31mi | 2/2.0 | 1,978 (+2%) | 1mo | $227,500 | $115 | 80 |
| 1952 Lawrence St | 0.39mi | 3/2.5 (+1) | 1,945 (+1%) | 7mo | $289,000 | $149 | 68 |
| 1629 Ingram St | 0.32mi | 3/2.5 (+1) | 1,788 (-8%) | 1mo | $245,000 | $137 | 65 |
| 2822 E 19th St | 0.54mi | 3/2.0 (+1) | 1,946 (+1%) | 6mo | $131,500 | $68 | 64 |
| 2423 E 13th St | 0.38mi | 3/1.0 (+1) | 1,848 (-4%) | 5mo | $220,000 | $119 | 62 |
| 1106 N Hamilton Ave | 0.40mi | 3/3.0 (+1) | 1,774 (-8%) | 1mo | $425,000 | $240 | 58 |
| 1938 N Dearborn St | 0.74mi | 2/1.5 | 2,026 (+5%) | 5mo | $77,000 | $38 | 51 |
| 2221 Langley Ave | 0.24mi | 3/1.0 (+1) | 1,672 (-14%) | 8mo | $85,000 | $51 | 51 |
| 1018 Jefferson Ave | 0.48mi | 3/2.0 (+1) | 2,162 (+12%) | 6mo | $150,000 | $69 | 48 |
| 1140 N Tacoma Ave | 0.45mi | 3/1.0 (+1) | 1,716 (-11%) | 7mo | $240,000 | $140 | 45 |
| 1835 N Rural St | 0.50mi | 3/2.0 (+1) | 2,178 (+13%) | 6mo | $165,000 | $76 | 45 |
| 931 Jefferson Ave | 0.59mi | 2/2.0 | 2,206 (+14%) | 6mo | $245,000 | $111 | 44 |
Match score weights: distance 35% · size 25% · config 20% · recency 20%. Top-matched comps best support the ARV.
Projected returns pro-forma
-3.0% appreciation · 0.81% rent growth · sell at horizon
- IRR
- -5.9%
- Equity multiple
- 0.79×
- Total profit
- $-8,803
- Equity at exit
- $21,918
- IRR
- 1.1%
- Equity multiple
- 1.07×
- Total profit
- $2,848
- Equity at exit
- $12,710
Cash invested: $41,160 (down + closing). Projections, not guarantees.
Landlord ↔ Tenant lean methodology
- Overall (STATE)
- 90 Strongly Landlord-Friendly
- State Indiana
- 90 Strongly Landlord-Friendly · R+11
- County
- — inherits STATE
- City
- — inherits STATE
ZIP-level market 46218
- Home prices YoY
- -17.1%
- Rents YoY
- 0.8%
- Active inventory
- 334
- Price-to-rent
- 8.0×
Monthly cashflow live
- Estimated rent
- $1,534 high interval (Pro) →
- Mortgage (P&I)
- −$771
- Tax from tax record
- −$91 /mo · $1,095/yr
- Insurance
- −$61
- HOA
- −$0
- Vacancy / Maint / Mgmt
- −$322
- Net cashflow
- $288
Break-even live
UW: 25.0% down · 7.5% · 30yr · 1.5% tax · 5.0% vac · 8.0% maint · 8.0% mgmt
Financing live
Cash to close
- Down payment
- $36,750
- Closing costs
- $4,410
- Reserves months
- —
- Total cash needed
- —
Loan-product check · same deal, 3 products live
Conventional
25% down · 7.5% · 30yr
- Down + closing
- —
- Monthly P&I
- —
- Monthly cashflow
- —
- DSCR
- —
- Eligible?
- —
Personal DTI + credit; lowest rate.
DSCR
20% down · 8.5% · 30yr
- Down + closing
- —
- Monthly P&I
- —
- Monthly cashflow
- —
- DSCR
- —
- Eligible?
- —
No personal income docs; deal must DSCR.
Hard money
10% down · 12.0% · 12mo
- Down + closing
- —
- Monthly P&I
- —
- Monthly cashflow
- —
- DSCR
- —
- Eligible?
- —
Short-term bridge; refi at stabilization.
Rent comps 40 comps
| Address | Beds | Baths | Sqft | Rent | $/sqft | DOM | Units | Dist |
|---|---|---|---|---|---|---|---|---|
| 2330 E 16th St Indianapolis, IN | 3.0 | 1.5 | 1378 | $1,450 | $1.05 | 4d | 1 | 0.18mi |
| 2418 E 16th St Indianapolis, IN | 2.0 | 1.5 | 1863 | $2,125 | $1.14 | 23d | 1 | 0.23mi |
| 1717 Ingram St Unit 1717 Indianapolis, IN | 3.0 | 2.0 | 1250 | $1,500 | $1.20 | 43d | 1 | 0.26mi |
| 1719 Ingram St Unit 1719 Indianapolis, IN | 3.0 | 2.0 | 1250 | $1,500 | $1.20 | 43d | 1 | 0.26mi |
| 1722 Ingram St Unit A Indianapolis, IN | 3.0 | 2.0 | 1250 | $1,550 | $1.24 | 7d | 1 | 0.28mi |
| 1722 Ingram St Indianapolis, IN | 3.0 | 2.0 | 1250 | $1,550 | $1.24 | 3d | 1 | 0.28mi |
| 1706 Ingram St Indianapolis, IN | 3.0 | 2.0 | 2592 | $2,000 | $0.77 | 7d | 1 | 0.30mi |
| 2536 E 17th St Indianapolis, IN | 2.0 | 2.0 | 2086 | $1,450 | $0.70 | 4d | 1 | 0.34mi |
| 1550 N Rural St Indianapolis, IN | 3.0 | 1.0 | 1388 | $1,600 | $1.15 | 43d | 1 | 0.44mi |
| 1623 N Rural St Indianapolis, IN | 2.0 | 1.0 | 1452 | $875 | $0.60 | 43d | 1 | 0.46mi |
| 1730 Alloy Dr Indianapolis, IN | 2.0 | 2.5 | 1350 | $2,400 | $1.78 | 23d | 1 | 0.57mi |
| 940 Jefferson Ave Unit 1 Indianapolis, IN | 3.0 | 1.5 | 1500 | $1,400 | $0.93 | 21d | 1 | 0.58mi |
| 929 N Beville Ave Indianapolis, IN | 3.0 | 1.0 | 1328 | $1,395 | $1.05 | 23d | 1 | 0.61mi |
| 945 Woodruff Place Middle Dr Unit 4 Indianapolis, IN | 2.0 | 1.5 | 1532 | $1,595 | $1.04 | 43d | 1 | 0.61mi |
| 960 Eastern Ave Indianapolis, IN | 3.0 | 1.5 | 1616 | $1,500 | $0.93 | 23d | 1 | 0.66mi |
| 960 Eastern Ave Indianapolis, IN | 3.0 | 1.5 | 1616 | $1,500 | $0.93 | 43d | 1 | 0.66mi |
| 826 N Beville Ave Indianapolis, IN | 3.0 | 1.0 | 1472 | $1,295 | $0.88 | 1d | 1 | 0.71mi |
| 826 N Beville Ave Indianapolis, IN | 3.0 | 1.0 | 1472 | $1,295 | $0.88 | 4d | 1 | 0.71mi |
| 1214 N Oakland Ave Indianapolis, IN | 3.0 | 2.0 | 1464 | $1,350 | $0.92 | 13d | 1 | 0.74mi |
| 1216 N Oakland Ave Indianapolis, IN | 3.0 | 2.0 | 1464 | $1,550 | $1.06 | 13d | 1 | 0.74mi |
| 2203 Sheldon St Unit B Indianapolis, IN | 3.0 | 2.0 | 1350 | $1,500 | $1.11 | 44d | 1 | 0.75mi |
| 1927 N Dearborn St Indianapolis, IN | 3.0 | 1.0 | 2182 | $1,495 | $0.69 | 43d | 1 | 0.77mi |
| 1314 E 10th St Indianapolis, IN | 2.0 | 2.0 | 1701 | $1,650 | $0.97 | 44d | 1 | 0.78mi |
| 656 N Beville Ave Indianapolis, IN | 3.0 | 2.5 | 2121 | $3,500 | $1.65 | 23d | 1 | 0.78mi |
| 635 Jefferson Ave Indianapolis, IN | 3.0 | 1.5 | 1744 | $1,700 | $0.97 | 43d | 1 | 0.80mi |
| 852 N Rural St Indianapolis, IN | 2.0 | 1.5 | 1528 | $1,300 | $0.85 | 23d | 1 | 0.80mi |
| 851 N Rural St Indianapolis, IN | 3.0 | 2.5 | 1300 | $1,700 | $1.31 | 23d | 1 | 0.82mi |
| 849 N Rural St Unit 849 Indianapolis, IN | 3.0 | 2.5 | 1300 | $2,000 | $1.54 | 43d | 1 | 0.82mi |
| 1313 E 22nd St Indianapolis, IN | 2.0 | 2.5 | 1325 | $2,750 | $2.08 | 17d | 1 | 0.85mi |
| 619 N Rural St Indianapolis, IN | 3.0 | 2.0 | 1300 | $1,600 | $1.23 | 23d | 1 | 0.96mi |
| 818 N Oakland Ave Unit 46201 Indianapolis, IN | 3.0 | 1.5 | 1332 | $1,550 | $1.16 | 43d | 1 | 0.97mi |
| 1018 N Tuxedo St Unit 1016 Indianapolis, IN | 3.0 | 1.5 | 1250 | $1,099 | $0.88 | 43d | 1 | 1.00mi |
| 1323 N Olney St Indianapolis, IN | 2.0 | 1.0 | 1288 | $945 | $0.73 | 43d | 1 | 1.00mi |
| 2340 Columbia Ave Unit 2340-B Indianapolis, IN | 3.0 | 2.0 | 1350 | $1,650 | $1.22 | 43d | 1 | 1.03mi |
| 1519 N Gale St Indianapolis, IN | 2.0 | 1.5 | 1552 | $1,295 | $0.83 | 43d | 1 | 1.03mi |
| 909 N Lasalle St Indianapolis, IN | 3.0 | 2.0 | 1717 | $1,600 | $0.93 | 44d | 1 | 1.05mi |
| 2221 Bellefontaine St Indianapolis, IN | 3.0 | 2.5 | 1712 | $2,349 | $1.37 | 23d | 1 | 1.08mi |
| 416 N Hamilton Ave Unit 416-A Indianapolis, IN | 3.0 | 2.0 | 1350 | $1,500 | $1.11 | 43d | 1 | 1.09mi |
| 515 N Oxford St Indianapolis, IN | 2.0 | 1.5 | 1728 | $1,050 | $0.61 | 2d | 1 | 1.10mi |
| 2822 E Michigan St Indianapolis, IN | 3.0 | 2.0 | 1918 | $1,999 | $1.04 | 21d | 1 | 1.10mi |
Listing history 7 events
-
2026-06-18days on market $147,000 Active 8 DOM
-
2026-06-17days on market $147,000 Active 7 DOM
-
2026-06-16days on market $147,000 Active 6 DOM
-
2026-06-15days on market $147,000 Active 5 DOM
-
2026-06-13pricedays on market $147,000 Active 3 DOM
-
2026-06-13remarks 540-char remark
-
2026-06-13$155,000 Active 2 DOM
ⓘ Source: listings_history table (triggers on properties + properties_extension) + one-shot
backfill from property_details.listing_events for pre-trigger history.
Tax reassessment forecast IN · Partial reset (capped growth)
- Current annual tax
- $1,095 · $91/mo
- Projected year-2 tax
- $1,172 · $98/mo
- Expected delta
- +$77/yr (+$6/mo · 7.1%)
ⓘ Screening estimate from a state-policy table — verify with the county assessor before closing.
Climate risk First Street
- Flood 1/10 Low FEMA zone X (unshaded) · 0% chance over 30 yrs
- Wildfire 1/10 Low
- Heat 4/10 Moderate 7 d/yr ≥102°F today · 19 d/yr by 30 yrs out
- Wind 2/10 Low 0% chance of damaging wind over 30 yrs
- Air quality 4/10 Moderate 5 unhealthy d/yr today · 7 by 30 yrs out
Nearby sold comps map
Loading sold comps map…
Walkable amenities ~0.75 mi
Loading nearby amenities…
Taxation est. · year 1
- Rental income
- $18,404
- − Mortgage interest
- −$8,234
- − Property taxes
- −$1,095
- − Insurance
- −$735
- − Repairs & maintenance
- −$1,472
- − Management
- −$1,472
- − Depreciation
- −$4,276
- Taxable income
- $1,119
- Est. tax owed @ 24.0%
- −$269
- After-tax cash flow
- $3,190/yr
For passive investors: Depreciation is non-cash, so a rental often shows a tax loss while cash-flowing — sheltering income. Rental losses are passive: they offset passive income freely, and up to $25,000/yr can offset ordinary (W-2) income if you actively participate and your MAGI is under $100k (phasing out to $0 by $150k); unused losses carry forward. On sale, claimed depreciation is recaptured at up to 25%, and gains may owe capital-gains tax (a 1031 exchange can defer both). Figures are a year-1 estimate at your 24.0% rate — not tax advice; consult a CPA.
Schools (NCES district)
- District
- Indianapolis Public Schools
- NCES district ID
- 1804770
- Math proficiency
- 14% ▼ -7.00%
- Reading proficiency
- 20% ▼ -3.00%
- Median HH income
- $32,034
- Composite
- 13.69/100
- National rank
- #9499
- State rank
- #286 of 301 in IN
Livability — Indianapolis city (balance)
No livability data for this city. (Only ~50 U.S. cities are tracked.)
Census & demographics
- Census place
- Indianapolis city (balance), IN
- County
- Marion County · 998,460 people
- City population
- 881,119
- Metro
- Indianapolis-Carmel-Anderson, IN
- Population (ZIP)
- 29,360
- Household income
- $38,063
- Rent vs Own
- Severe rent burden
- 2340.0
Population outlook (Marion County) Hauer SSP2
- Today (2025)
- 1,025,572 people
- By 2030
- 1,065,727 · +3.9%
- By 2040
- 1,141,577 · +11.3%
- By 2050
- 1,208,920 · +17.9%
- By 2075
- 1,367,288 · +33.3%
- By 2100
- 1,438,201 · +40.2%
Race, ethnicity, and origin ACS 2023
- Neighborhood character
- Predominantly Black (68%)
- Race & ethnicity
- Black 68% White 18% Hispanic / Latino 9% Two or more races 6%
- Hispanic origin (detail)
- Mexican 6%
- Common ancestry
- Romanian 1%
- Foreign-born
- 5% · Canada, Philippines
- Languages at home
- 92% English-only · Spanish 7%
Political lean MEDSL · Marion
- 2024 margin
- Strong D (+27.7) · D 63.0% · R 35.3% · Other 1.7%
- 2008→2024 swing
- -0.7pp no change · 2008: 28.4pp · 2024: 27.7pp
- All cycles
- 2024: D+27.7 2020: D+29.1 2016: D+22.8 2012: D+22.2 2008: D+28.4
Not yet ingested
- Civics
- —
Market trends
- HPI YoY
- ▼ -81.57%
- Current HPI
- 395.7071
- Rent YoY
- ▲ 0.81%
- Metro
- Indianapolis-Carmel-Anderson, IN
- State GDP YoY
- ▲ 2.90%
- F500 in state
- 18
Industry mix (Fortune 500 HQ in IN)
| Industry | F500 HQs | Revenue |
|---|---|---|
| Industrial Machinery | 2 | $37B |
|
||
| Healthcare | 1 | $177B |
|
||
| Pharmaceuticals | 1 | $45B |
|
||
| Metals / Steel | 1 | $18B |
|
||
| Agriculture | 1 | $17B |
|
||
| Packaging | 1 | $12B |
|
||
Price history
+209.5% since first listed3 events — show timeline
- 2026-06-08 Listed $155,000 MIBOR as Distributed by MLS Grid
- 2001-01-26 Sold (Public Records) $50,074 Public Records
- 2001-01-26 Sold (Public Records) $50,074 Public Records
Property tax history
+13.8%/yrLatest (2025): $1,095 · +15.6% YoY. Source: county tax records.
Cash-flow waterfall
monthlySold comps — $/sqft
last 12 mo · ≤1 miLoading sold comps…