 Duplex
None · Crawfordsville, IN
Flood risk 1/10 · Minimal
- FEMA flood zone
- X (unshaded)
- Chance of flooding over 30 yrs
- 0.0%
- Est. flood insurance / yr
- $507 – $1,088
Fire risk 1/10 · Minimal
- Est. fire insurance / yr
- $717 – $1,331
Heat risk 3/10 · Minor
- Hot days now (above 101°F)
- 7 days/yr
- Hot days in 30 yrs
- 18 days/yr
Wind risk 2/10 · Minimal
- Chance of severe wind over 30 yrs
- 0.0%
Air-quality risk 2/10 · Minimal
- Unhealthy air days now
- 1 days/yr
- Unhealthy air days in 30 yrs
- 2 days/yr
Risk factors via First Street. Map © Google.
Why this score? — see what drove the B- grade
The composite is a weighted blend of 9 inputs, each scored 0–100. Each bar is that input's sub-score; the figure is the points it added to the 100-point composite (weight × sub-score).
- Cash flow +28.5/30.0
- DSCR +10.0/10.0
- 1% rule +8.2/10.0
- ARV discount +7.5/15.0
- Livability +3.6/5.0
- Rent growth +3.3/5.0
- Schools +2.5/10.0
- Condition / age +2.5/5.0
- Appreciation +0.0/10.0
$199,900
🖨 Deal sheet 📄 Offer letter ✓ Due diligence
Multi-family units
County records classify this as Multi-Family (2-4 Unit). Listing-text estimate: 2 units. confirmed
Listing remarks MLS
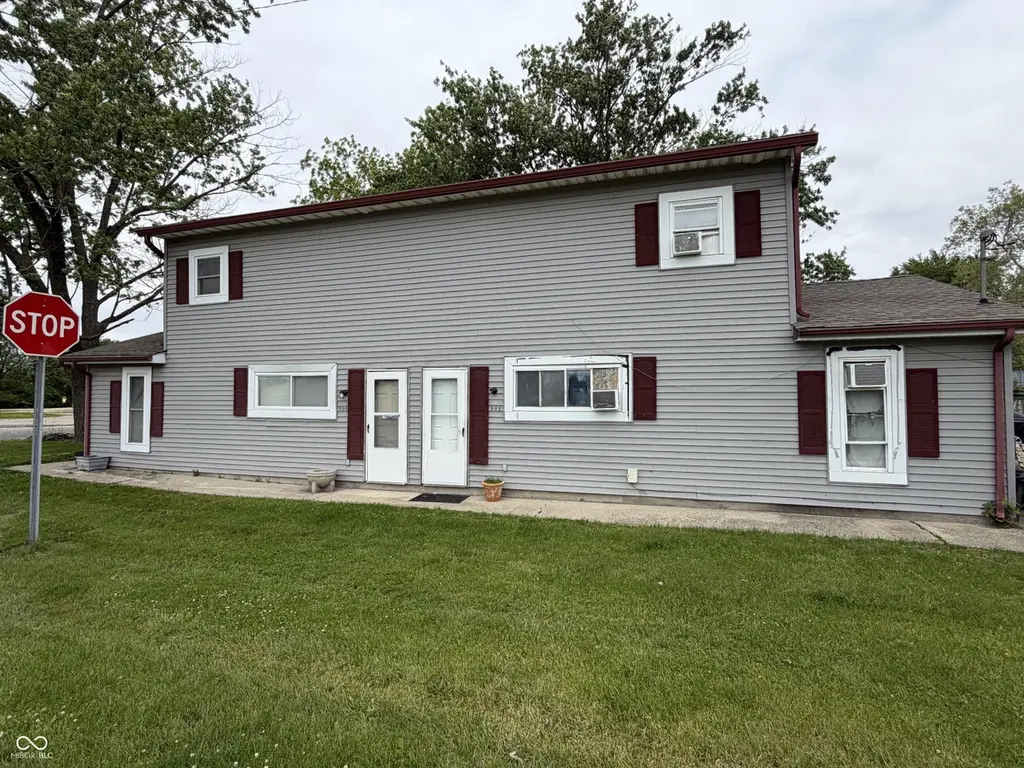
Investors looking for good return need to check out this 2 unit built in 1996. Each unit 3BDRM, 2BA, Gas F/A Heat and Central AC.
Key facts
- 7,797 sq ft lot
- Built 1996
- Listed 23 days
Property features AI
Finance
- Financial info: Two units total; Unit rents reported as $1,350 per month and $850 per month; Gross income and expenses reported as 0 in provided data
Exterior
- Utilities: One unit lists utilities as central air, electric, gas, and forced heat; No solid waste information indicated
- Home design: Duplex (residential income); Each unit spans 2 levels
- Construction: No conversion indicated
- Exterior features: Street access with street cuts; Current use as an apartment building with fewer than 20 units; Lot approximately 0.18 acres
Interior
- Kitchen: Kitchen present in each unit
- Bedrooms: Each unit is a 3-bedroom layout
- Heating & cooling: Forced heat (unit utilities indicate forced air); Central air listed under utilities for one unit
- Interior features: Two-unit residential income property
- Laundry & utility: Heating utilities include forced air
Neighborhood map
What this means for you Summary
Snapshot
- This is a 2 × 3-bed/2-bath units multifamily listed at $200k.
Deal economics
- At list price, monthly cash flow is $651 ($8k/yr) — positive. Per door: $326/mo.
- The deal already cash-flows at list — no discount required.
- Meets the 1% rule at list price ($3k rent vs $200k).
- Recommended offer: $197k (1.5% below list) — sets the bar for market timing.
- Cap rate 10.2% vs local median 3.5% in Crawfordsville — top-decile yield for the area; either an underpriced asset or a hidden risk that comps aren't pricing in. Stress-test before assuming the spread holds.
Location & tenants
- Location reads 72/100 on livability (#118 in IN) — a middle-class / working-renter tenant base. Strengths: cost of living A+, housing A+, crime A; Watch: commute D+, amenities F, employment D-.
- Crawfordsville Community Schools (town): math 27% / reading 32% proficiency, ranked #247 of 301 in IN (top 82%) — low school quality limits family demand, transient renter base, plan for 1-2y turnover.
- Zoned schools: Crawfordsville Sr High School (math 32% / reading 62%, grade D-, #143 of 369 statewide, top 44%, 692 students, 58% FRL) — zoned schools at 58% FRL track the district average.
- Zoned-school proficiency averages 47% at this address vs 30% district-wide (+18 pts) — the actual schools serving this property are materially stronger than the Crawfordsville Community Schools average implies; a family-tenant draw the district grade alone would hide.
- Market conditions: Rents rising (+3.3%/yr); 203 active listings in the ZIP; 52 units permitted in Montgomery County in 2024 (0 in 5+ unit buildings).
- At $2,630/mo this rent would consume 46% of the median local household income ($68k/yr) (locally 464% of renters already pay >50% of income on rent) — very limited rent-growth headroom before tenants either downsize or default.
Forward outlook
- Local home prices are declining (-3.0%/yr); year-one equity from $1k of loan paydown is wiped out by about $6k of value loss. Plan a longer hold.
- Montgomery County population projected to shrink 9% by 2050 — rents likely to lag national; underwrite the cash flow, not the appreciation.
- At projected returns (-3.0% appreciation + 3.3% rent growth), your $56k cash investment doubles in ~9 years — after that, you're playing with house money.
Negotiation context
- It's been on market 24 days — a 2% lower offer ($197k) is reasonable based on typical stale-listing flexibility.
- 3 sale attempts since 14y ago with the ask held roughly flat each time — persistent listings suggest the price (not the market) is what's stuck; bring a comps-based counter.
- Current owner paid $72k; list at $200k implies a 180% gain — meaningful room to come down on a strong offer.
Questions for the listing agent
- Can we see the unit-by-unit rent roll, current vacancy, and any below-market leases? What's the average tenancy length?
- What capital expenditures (roof, boiler, parking lot, exteriors) have been made in the last 5 years, and what's planned in the next 2?
- Is there a deadline driving the sale (1031 exchange, divorce, estate, relocation)? That informs how much negotiation room exists.
- Schools are D-rated, which usually means shorter tenancies and higher turnover. Who's the typical renter profile here, and what's been the actual vacancy rate?
- What's the average days-on-market for RENTAL listings here right now (not sales)? A rising rental-DOM trend means longer vacancies and softer asking-rent achievability than the comps imply.
- What's the recent tenant-quality profile in this submarket — average credit score on applications, eviction rate, late-payment / NSF rate, and stable-employment percentage? A property-management company in the area should have these aggregated.
- How much new apartment / multifamily construction is in the pipeline within 1–3 miles? Heavy new supply (>2% of stock underway) typically softens rents 12–24 months out; light construction supports rent growth.
Investment metrics
- 1% rule
- 1.32% ✓
- Cap rate
- 10.20%
- Cash-on-cash
- 13.96%
- DSCR
- 1.62
- GRM
- 6.3
CMA / ARV
No comps found within radius.
Projected returns pro-forma
-3.0% appreciation · 3.28% rent growth · sell at horizon
- IRR
- 4.6%
- Equity multiple
- 1.18×
- Total profit
- $9,893
- Equity at exit
- $29,806
- IRR
- 14.3%
- Equity multiple
- 2.17×
- Total profit
- $65,360
- Equity at exit
- $17,284
Cash invested: $55,972 (down + closing). Projections, not guarantees.
Landlord ↔ Tenant lean methodology
- Overall (STATE)
- 90 Strongly Landlord-Friendly
- State Indiana
- 90 Strongly Landlord-Friendly · R+11
- County
- — inherits STATE
- City
- — inherits STATE
ZIP-level market 47933
- Home prices YoY
- -27.1%
- Rents YoY
- 3.3%
- Active inventory
- 203
- Price-to-rent
- 12.7×
Monthly cashflow live
- Estimated rent
- $2,630 medium interval (Pro) →
- Mortgage (P&I)
- −$1,048
- Tax from tax record
- −$295 /mo · $3,539/yr
- Insurance
- −$83
- HOA
- −$0
- Vacancy / Maint / Mgmt
- −$552
- Net cashflow
- $651
Break-even live
2-unit breakdown (identical units grouped — click to expand)
| Units | Beds | Baths | Est. rent |
|---|---|---|---|
| 2× units | 3 | 2 | $2,630 |
| #1 | 3 | 2 | $1,315 |
| #2 | 3 | 2 | $1,315 |
| Total (2 units) | $2,630 | ||
UW: 25.0% down · 7.5% · 30yr · 1.5% tax · 5.0% vac · 8.0% maint · 8.0% mgmt
Financing live
Cash to close
- Down payment
- $49,975
- Closing costs
- $5,997
- Reserves months
- —
- Total cash needed
- —
Loan-product check · same deal, 3 products live
Conventional
25% down · 7.5% · 30yr
- Down + closing
- —
- Monthly P&I
- —
- Monthly cashflow
- —
- DSCR
- —
- Eligible?
- —
Personal DTI + credit; lowest rate.
DSCR
20% down · 8.5% · 30yr
- Down + closing
- —
- Monthly P&I
- —
- Monthly cashflow
- —
- DSCR
- —
- Eligible?
- —
No personal income docs; deal must DSCR.
Hard money
10% down · 12.0% · 12mo
- Down + closing
- —
- Monthly P&I
- —
- Monthly cashflow
- —
- DSCR
- —
- Eligible?
- —
Short-term bridge; refi at stabilization.
Listing history 18 events
-
2026-06-17days on market $199,900 Active 24 DOM
-
2026-06-16days on market $199,900 Active 23 DOM
-
2026-06-15days on market $199,900 Active 22 DOM
-
2026-06-14days on market $199,900 Active 20 DOM
-
2026-06-12days on market $199,900 Active 19 DOM
-
2026-06-09days on market $199,900 Active 16 DOM
-
2026-06-08days on market $199,900 Active 15 DOM
-
2026-06-07days on market $199,900 Active 14 DOM
-
2026-06-02days on market $199,900 Active 9 DOM
-
2026-06-01days on market $199,900 Active 8 DOM
-
2026-05-31days on market $199,900 Active 7 DOM
-
2026-05-30days on market $199,900 Active 6 DOM
-
2026-05-23$199,900 Active
-
2013-10-04historical 129-char remark
Show marketing remark (129 chars)
Investors looking for good return need to check out this 2 unit built in 1996. Each unit 3BDRM, 2BA, Gas F/A Heat and Central AC.
-
2013-10-04soldstatus $71,500 129-char remark
Show marketing remark (129 chars)
Investors looking for good return need to check out this 2 unit built in 1996. Each unit 3BDRM, 2BA, Gas F/A Heat and Central AC.
-
2013-05-29$79,900 129-char remark
Show marketing remark (129 chars)
Investors looking for good return need to check out this 2 unit built in 1996. Each unit 3BDRM, 2BA, Gas F/A Heat and Central AC.
-
2013-01-27historical
-
2012-09-21$89,900
ⓘ Source: listings_history table (triggers on properties + properties_extension) + one-shot
backfill from property_details.listing_events for pre-trigger history.
Tax reassessment forecast IN · Partial reset (capped growth)
- Current annual tax
- $3,539 · $295/mo
- Projected year-2 tax
- $3,539 · $295/mo
- Expected delta
- $0/yr ($0/mo · 0.0%)
ⓘ Screening estimate from a state-policy table — verify with the county assessor before closing.
Climate risk First Street
- Flood 1/10 Low FEMA zone X (unshaded) · 0% chance over 30 yrs
- Wildfire 1/10 Low
- Heat 3/10 Moderate 7 d/yr ≥101°F today · 18 d/yr by 30 yrs out
- Wind 2/10 Low 0% chance of damaging wind over 30 yrs
- Air quality 2/10 Low 1 unhealthy d/yr today · 2 by 30 yrs out
Nearby sold comps map
Loading sold comps map…
Walkable amenities ~0.75 mi
Loading nearby amenities…
Taxation est. · year 1
- Rental income
- $31,560
- − Mortgage interest
- −$11,198
- − Property taxes
- −$3,539
- − Insurance
- −$1,000
- − Repairs & maintenance
- −$2,525
- − Management
- −$2,525
- − Depreciation
- −$5,815
- Taxable income
- $4,959
- Est. tax owed @ 24.0%
- −$1,190
- After-tax cash flow
- $6,624/yr
For passive investors: Depreciation is non-cash, so a rental often shows a tax loss while cash-flowing — sheltering income. Rental losses are passive: they offset passive income freely, and up to $25,000/yr can offset ordinary (W-2) income if you actively participate and your MAGI is under $100k (phasing out to $0 by $150k); unused losses carry forward. On sale, claimed depreciation is recaptured at up to 25%, and gains may owe capital-gains tax (a 1031 exchange can defer both). Figures are a year-1 estimate at your 24.0% rate — not tax advice; consult a CPA.
Schools (NCES district)
- District
- Crawfordsville Community Schools
- NCES district ID
- 1802460
- Math proficiency
- 27% ▼ -8.00%
- Reading proficiency
- 32% ▼ -6.00%
- Median HH income
- $39,087
- Composite
- 24.73/100
- National rank
- #7606
- State rank
- #247 of 301 in IN
Livability — Crawfordsville
- Score
- 72/100
- State rank
- #118
- US rank
- #6376
Category grades
Schools grade is shown separately in the Schools card above.
Census & demographics
- Census place
- Crawfordsville, IN
- County
- Montgomery County · 28,357 people
- City population
- 28,357
- Metro
- Crawfordsville, IN
- Population (ZIP)
- 28,357
- Household income
- $68,130
- Rent vs Own
- Severe rent burden
- 464.0
Population outlook (Montgomery County) Hauer SSP2
- Today (2025)
- 37,893 people
- By 2030
- 37,539 · -0.9%
- By 2040
- 36,536 · -3.6%
- By 2050
- 34,454 · -9.1%
- By 2075
- 28,852 · -23.9%
- By 2100
- 21,145 · -44.2%
Race, ethnicity, and origin ACS 2023
- Neighborhood character
- Predominantly White (88%)
- Race & ethnicity
- White 88% Hispanic / Latino 7% Two or more races 7%
- Hispanic origin (detail)
- Mexican 5% Puerto Rican 2%
- Common ancestry
- Slovak 2% Lithuanian 2% Romanian 2%
- Foreign-born
- 4% · Canada
- Languages at home
- 93% English-only · Spanish 6%
Political lean MEDSL · Montgomery
- 2024 margin
- Solid R (+48.2) · D 24.9% · R 73.2% · Other 1.9%
- 2008→2024 swing
- -28.3pp toward R · 2008: -19.9pp · 2024: -48.2pp
- All cycles
- 2024: R+48.2 2020: R+49.1 2016: R+50.9 2012: R+38.5 2008: R+19.9
Not yet ingested
- Civics
- —
Market trends
- HPI YoY
- ▼ -78.91%
- Current HPI
- 211.6864
- Rent YoY
- ▲ 3.28%
- Metro
- Crawfordsville, IN
- State GDP YoY
- ▲ 2.90%
- F500 in state
- 18
Industry mix (Fortune 500 HQ in IN)
| Industry | F500 HQs | Revenue |
|---|---|---|
| Industrial Machinery | 2 | $37B |
|
||
| Healthcare | 1 | $177B |
|
||
| Pharmaceuticals | 1 | $45B |
|
||
| Metals / Steel | 1 | $18B |
|
||
| Agriculture | 1 | $17B |
|
||
| Packaging | 1 | $12B |
|
||
Price history
+122.4% since first listed6 events — show timeline
- 2026-05-23 Listed $199,900 MIBOR as Distributed by MLS Grid
- 2013-10-04 Listing Removed — MIBOR as Distributed by MLS Grid
- 2013-10-04 Sold (MLS) $71,500 MIBOR as Distributed by MLS Grid
- 2013-05-29 Listed $79,900 MIBOR as Distributed by MLS Grid
- 2013-01-27 Listing Removed — MIBOR as Distributed by MLS Grid
- 2012-09-21 Listed $89,900 MIBOR as Distributed by MLS Grid
Property tax history
+7.0%/yrLatest (2025): $3,539 · -36.6% YoY. Source: county tax records.
Cash-flow waterfall
monthlySold comps — $/sqft
last 12 mo · ≤1 miLoading sold comps…