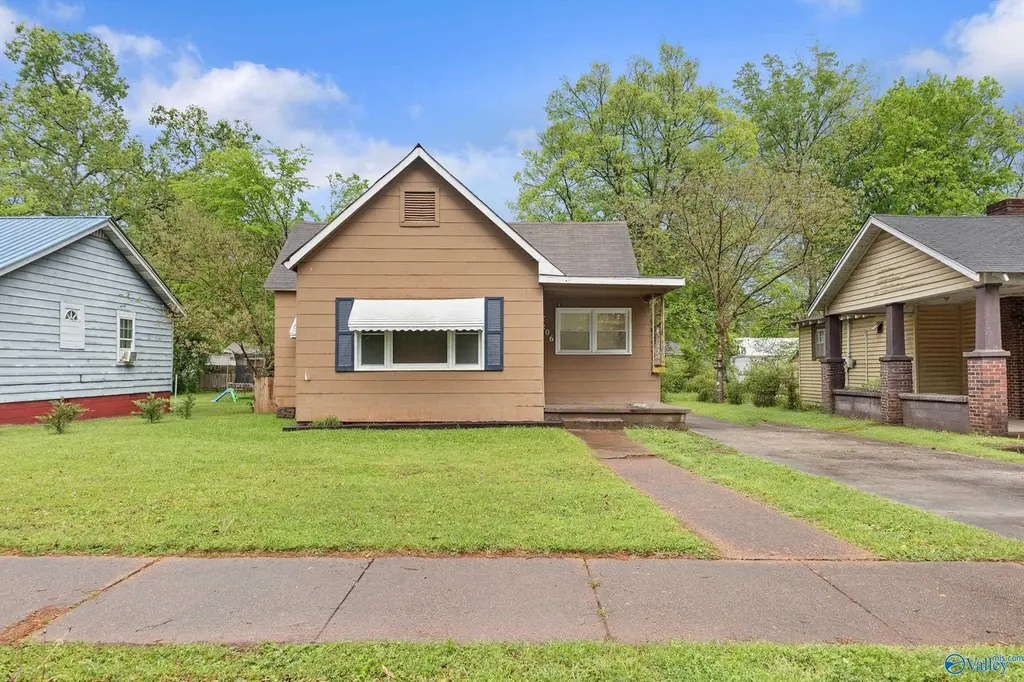
206 Memorial Dr NW · Decatur, AL
Flood risk 6/10 · Moderate
- FEMA flood zone
- X (unshaded)
- Chance of flooding over 30 yrs
- 0.66%
- Est. flood insurance / yr
- $507 – $1,088
Fire risk 1/10 · Minimal
- Est. fire insurance / yr
- $916 – $1,700
Heat risk 6/10 · Moderate
- Hot days now (above 106°F)
- 7 days/yr
- Hot days in 30 yrs
- 19 days/yr
Wind risk 5/10 · Moderate
- Chance of severe wind over 30 yrs
- 23.0%
Air-quality risk 2/10 · Minimal
- Unhealthy air days now
- 1 days/yr
- Unhealthy air days in 30 yrs
- 1 days/yr
Risk factors via First Street. Map © Google.
Why this score? — see what drove the C grade
The composite is a weighted blend of 9 inputs, each scored 0–100. Each bar is that input's sub-score; the figure is the points it added to the 100-point composite (weight × sub-score).
- Cash flow +21.1/30.0
- ARV discount +11.4/15.0
- DSCR +6.7/10.0
- 1% rule +4.3/10.0
- Rent growth +3.7/5.0
- Livability +3.6/5.0
- Schools +2.6/10.0
- Condition / age +2.5/5.0
- Appreciation +0.0/10.0
$120,000
🖨 Deal sheet (PDF) 📄 Offer letter ✓ Due diligence
Listing remarks MLS
Investors and first time home buyers listen up! Welcome to 206 Memorial DR NW in Decatur! This classic home offers a manageable sized home and lot with everything needed for an easily upgraded first home or rental/investment property. Centrally located to Beltline and downtown!
Key facts
- Near dining
- Near shopping
- Large backyard
Tags
Property features AI
Finance
- Other: Subdivision: Metes And Bounds
- HOA & community: No homeowners association
Exterior
- Parking: Concrete driveway
- Utilities: Public water; Public sewer; Electric service (implied)
- Home design: Single-family residence; One story; Built in 1944; Living area of 952 square feet; Vinyl siding
- Construction: Vinyl siding construction; Built in 1944
- Exterior features: Public water; Public sewer; Lot of about 0.19 acres
Interior
- Bathrooms: 1 full bathroom
- Heating & cooling: Wall furnace heating; Multiple window air conditioning units (2+)
- Interior features: 7 total rooms; Crawl space basement
Neighborhood map
What this means for you Summary
Snapshot
- This is a 3-bed/1.0-bath single-family listed at $120k.
Deal economics
- At list price, monthly cash flow is $171 ($2k/yr) — positive.
- The deal already cash-flows at list — no discount required.
- To meet the 1% rule (rent ≥ 1% of price), the offer needs to be $112k (7.0% below list).
- Recommended offer: $112k (7.0% below list) — sets the bar for 1% rule.
- Cap rate 8.0% vs local median 4.0% in Decatur — top-decile yield for the area; either an underpriced asset or a hidden risk that comps aren't pricing in. Stress-test before assuming the spread holds.
Location & tenants
- Location reads 72/100 on livability (#28 in AL) — a middle-class / working-renter tenant base. Strengths: cost of living A+, housing A+, health & safety A+; Watch: employment D+, crime F, amenities F.
- Decatur City (urban): math 22% / reading 40% proficiency, ranked #66 of 129 in AL (top 51%) — families likely to look elsewhere, expect single-tenant / working-renter base with shorter leases.
- Zoned schools: Eastwood Elementary School (math 42% / reading 62%, grade C-, #102 of 627 statewide, top 17%, 252 students, 39% FRL); Decatur Middle School (math 17% / reading 36%, grade F, #150 of 257 statewide, top 60%, 815 students, 77% FRL); Decatur High School (math 27% / reading 27%, grade F, #90 of 305 statewide, top 35%, 1,040 students, 67% FRL) — zoned schools at 61% FRL track the district average.
- Market conditions: Rents rising fast (+4.7%/yr); 225 active listings in the ZIP; 11 comparable units currently listed for rent nearby; rentals lingering (median 45d on market — plan ~5-8 weeks vacancy on turnover, expect pricing pressure); 64% of comp listings sitting > 30 days — soft ceiling on asking rent; 231 units permitted in Morgan County in 2024 (0 in 5+ unit buildings).
Forward outlook
- Local home prices are declining (-3.0%/yr); year-one equity from $830 of loan paydown is wiped out by about $4k of value loss. Plan a longer hold.
- Morgan County population projected at -11% by 2050 — secular population decline; favor cash flow + early exit over multi-decade hold.
Negotiation context
- Only 12 days on market — expect competitive offers; lowballing is unlikely to land.
- 4 sale attempts since 5y ago with the ask held roughly flat each time — persistent listings suggest the price (not the market) is what's stuck; bring a comps-based counter.
- Current owner paid $75k; list at $120k implies a 60% gain — meaningful room to come down on a strong offer.
Risks & watch-outs
- Watch-outs: built in 1944 — expect roof / HVAC / electrical / plumbing capex.
- Climate carrying-cost: major flood risk; moderate wind risk, 23% chance of damaging wind over 30y; extreme-heat days projected 7→19/yr by 2055 (HVAC capex compounding) — expect insurance premiums to compound above CPI over the hold.
Questions for the listing agent
- Built in 1944 — when were the roof, HVAC, electrical panel, plumbing, and water heater last replaced?
- Is there a deadline driving the sale (1031 exchange, divorce, estate, relocation)? That informs how much negotiation room exists.
- Crime grade is F in this area — have there been break-ins, vandalism, or insurance claims at this property in the last 3 years? What carrier currently insures it and at what premium?
- What's the average days-on-market for RENTAL listings here right now (not sales)? A rising rental-DOM trend means longer vacancies and softer asking-rent achievability than the comps imply.
- What's the recent tenant-quality profile in this submarket — average credit score on applications, eviction rate, late-payment / NSF rate, and stable-employment percentage? A property-management company in the area should have these aggregated.
- How much new for-sale + rental construction is in the pipeline within 1–3 miles? Heavy new supply typically softens prices + rents 12–24 months out; constrained supply supports both.
Investment metrics
- 1% rule
- 0.93% ✗
- Cap rate
- 8.00%
- Cash-on-cash
- 6.10%
- DSCR
- 1.27
- GRM
- 9.0
CMA / ARV
- ARV (on-the-fly)
- $131,376
- Comps found
- 12
Show comp detail 12 sales within ~0.75 mi
| Address | Dist | Beds/Ba | Sqft | Sold | Price | $/sf | Match |
|---|---|---|---|---|---|---|---|
| 220 8th Ave NW | 0.10mi | 3/1.0 | 973 (+2%) | 3mo | $128,000 | $132 | 89 |
| 409 10th Ave SW | 0.33mi | 3/1.0 | 906 (-5%) | 1mo | $107,500 | $119 | 76 |
| 301 8th Ave NW | 0.11mi | 2/1.0 (-1) | 857 (-10%) | 5mo | $124,900 | $146 | 69 |
| 403 NW 14th Ave | 0.46mi | 3/1.0 | 1,000 (+5%) | 9mo | $138,000 | $138 | 62 |
| 217 8th Ave SW | 0.23mi | 2/1.0 (-1) | 1,082 (+14%) | 0mo | $59,900 | $55 | 61 |
| 223 12th Ave SW | 0.36mi | 2/2.0 (-1) | 1,004 (+6%) | 7mo | $163,500 | $163 | 59 |
| 304 Memorial Dr | 0.11mi | 2/1.0 (-1) | 821 (-14%) | 14mo | $111,200 | $135 | 55 |
| 112 6th Ave NW | 0.22mi | 2/1.0 (-1) | 858 (-10%) | 16mo | $103,900 | $121 | 55 |
| 216 8th Ave NW | 0.09mi | 2/1.0 (-1) | 832 (-13%) | 22mo | $123,000 | $148 | 52 |
| 401 5th Ave SW | 0.38mi | 2/1.0 (-1) | 1,022 (+7%) | 21mo | $142,800 | $140 | 47 |
| 523 12th Ave NW | 0.49mi | 2/1.0 (-1) | 1,064 (+12%) | 8mo | $150,100 | $141 | 46 |
| 608 7th Ave SW | 0.45mi | 2/1.0 (-1) | 1,088 (+14%) | 11mo | $94,000 | $86 | 41 |
Match score weights: distance 35% · size 25% · config 20% · recency 20%. Top-matched comps best support the ARV.
Projected returns pro-forma
-3.0% appreciation · 4.67% rent growth · sell at horizon
- IRR
- -5.3%
- Equity multiple
- 0.80×
- Total profit
- $-6,723
- Equity at exit
- $17,892
- IRR
- 6.0%
- Equity multiple
- 1.48×
- Total profit
- $16,010
- Equity at exit
- $10,375
Cash invested: $33,600 (down + closing). Projections, not guarantees.
Landlord ↔ Tenant lean methodology
- Overall (STATE)
- 90 Strongly Landlord-Friendly
- State Alabama
- 90 Strongly Landlord-Friendly · R+15
- County
- — inherits STATE
- City
- — inherits STATE
ZIP-level market 35601
- Home prices YoY
- -26.5%
- Rents YoY
- 4.7%
- Active inventory
- 225
- Price-to-rent
- 9.0×
Monthly cashflow live
- Estimated rent
- $1,116 high interval (Pro) →
- Mortgage (P&I)
- −$629
- Tax from tax record
- −$31 /mo · $378/yr
- Insurance
- −$50
- HOA
- −$0
- Vacancy / Maint / Mgmt
- −$234
- Net cashflow
- $171
Break-even live
Sensitivity live
| Price | -10% $239 | -5% $205 | +0% $171 | +5% $137 | +10% $103 |
|---|---|---|---|---|---|
| Rent | -10% $83 | -5% $127 | +0% $171 | +5% $215 | +10% $259 |
| Rate | -1.0pp $231 | -0.5pp $201 | base $171 | +0.5pp $140 | +1.0pp $108 |
UW: 25.0% down · 7.5% · 30yr · 1.5% tax · 5.0% vac · 8.0% maint · 8.0% mgmt
Financing live
Cash to close
- Down payment
- $30,000
- Closing costs
- $3,600
- Reserves months
- —
- Total cash needed
- —
Loan-product check · same deal, 3 products live
Conventional
25% down · 7.5% · 30yr
- Down + closing
- —
- Monthly P&I
- —
- Monthly cashflow
- —
- DSCR
- —
- Eligible?
- —
Personal DTI + credit; lowest rate.
DSCR
20% down · 8.5% · 30yr
- Down + closing
- —
- Monthly P&I
- —
- Monthly cashflow
- —
- DSCR
- —
- Eligible?
- —
No personal income docs; deal must DSCR.
Hard money
10% down · 12.0% · 12mo
- Down + closing
- —
- Monthly P&I
- —
- Monthly cashflow
- —
- DSCR
- —
- Eligible?
- —
Short-term bridge; refi at stabilization.
Rent comps 11 comps
| Address | Beds | Baths | Sqft | Rent | $/sqft | DOM | Units | Dist |
|---|---|---|---|---|---|---|---|---|
| 220 8th Ave NW Decatur, AL | 3.0 | 1.0 | 973 | $1,125 | $1.16 | 44d | 1 | 0.12mi |
| 516 Ferry St NE Decatur, AL | 2.0 | 1.0 | 900 | $1,150 | $1.28 | 24d | 1 | 0.97mi |
| 1050 Harborview Dr NE Decatur, AL | 1.0–2.0 | 1.0–2.0 | 790 | $1,305 | $1.65 | 15d | 7 | 1.09mi |
| 213 Wilson St NE Unit 4 Decatur, AL | 2.0 | 1.0 | 975 | $700 | $0.72 | 24d | 1 | 1.12mi |
| 213 Wilson St NE Unit 2 Decatur, AL | 2.0 | 1.0 | 975 | $875 | $0.90 | 24d | 1 | 1.12mi |
| 227 8th St SW Unit 19 Decatur, AL | 2.0 | 1.0 | 850 | $825 | $0.97 | 44d | 1 | 1.27mi |
| 1208 2nd Ave SW Unit 1208 28 Decatur, AL | 2.0 | 1.0 | 850 | $825 | $0.97 | 44d | 1 | 1.29mi |
| 818 Grant St SE Decatur, AL | 2.0 | 1.0 | 910 | $1,300 | $1.43 | 44d | 1 | 1.29mi |
| 1220 2nd Ave SW Unit 2nd 7 Decatur, AL | 2.0 | 1.0 | 850 | $825 | $0.97 | 44d | 1 | 1.33mi |
| 1018 Grant St SE Unit 1018-4 Decatur, AL | 2.0 | 1.0 | 890 | $775 | $0.87 | 44d | 1 | 1.44mi |
| 1018 Grant St SE Unit 1026-4 Decatur, AL | 2.0 | 1.0 | 890 | $800 | $0.90 | 44d | 1 | 1.44mi |
Listing history 10 events
-
2026-06-21days on market $120,000 Active 12 DOM
-
2026-06-19days on market $120,000 Active 10 DOM
-
2026-06-18days on market $120,000 Active 9 DOM
-
2026-06-17days on market $120,000 Active 8 DOM
-
2026-06-16days on market $120,000 Active 7 DOM
-
2026-06-15days on market $120,000 Active 6 DOM
-
2026-06-14days on market $120,000 Active 4 DOM
-
2026-06-13days on market $120,000 Active 3 DOM
-
2026-06-10remarks 170-char remark
-
2026-06-10$120,000 Active 1 DOM
ⓘ Source: listings_history table (triggers on properties + properties_extension) + one-shot
backfill from property_details.listing_events for pre-trigger history.
Tax reassessment forecast AL · Resets to sale price
- Current annual tax
- $378 · $31/mo
- Projected year-2 tax
- $492 · $41/mo
- Expected delta
- +$114/yr (+$10/mo · 30.2%)
ⓘ Screening estimate from a state-policy table — verify with the county assessor before closing.
Climate risk First Street
- Flood 6/10 Major FEMA zone X (unshaded) · 66% chance over 30 yrs
- Wildfire 1/10 Low
- Heat 6/10 Major 7 d/yr ≥106°F today · 19 d/yr by 30 yrs out
- Wind 5/10 Major 23% chance of damaging wind over 30 yrs
- Air quality 2/10 Low 1 unhealthy d/yr today · 1 by 30 yrs out
Nearby sold comps map
Loading sold comps map…
Walkable amenities ~0.75 mi
Loading nearby amenities…
Taxation est. · year 1
- Rental income
- $13,389
- − Mortgage interest
- −$6,722
- − Property taxes
- −$378
- − Insurance
- −$600
- − Repairs & maintenance
- −$1,071
- − Management
- −$1,071
- − Depreciation
- −$3,491
- Taxable income
- $57
- Est. tax owed @ 24.0%
- −$14
- After-tax cash flow
- $2,035/yr
For passive investors: Depreciation is non-cash, so a rental often shows a tax loss while cash-flowing — sheltering income. Rental losses are passive: they offset passive income freely, and up to $25,000/yr can offset ordinary (W-2) income if you actively participate and your MAGI is under $100k (phasing out to $0 by $150k); unused losses carry forward. On sale, claimed depreciation is recaptured at up to 25%, and gains may owe capital-gains tax (a 1031 exchange can defer both). Figures are a year-1 estimate at your 24.0% rate — not tax advice; consult a CPA.
Schools (NCES district)
- District
- Decatur City
- NCES district ID
- 0101170
- Math proficiency
- 22% ▼ -27.00%
- Reading proficiency
- 40% ▼ -1.00%
- Median HH income
- $42,170
- Composite
- 26.21/100
- National rank
- #7261
- State rank
- #66 of 129 in AL
Livability — Decatur
- Score
- 72/100
- State rank
- #28
- US rank
- #5989
Category grades
Schools grade is shown separately in the Schools card above.
Census & demographics
- Census place
- Decatur, AL
- County
- Morgan County · 67,628 people
- City population
- 67,628
- Metro
- Decatur, AL
- Population (ZIP)
- 35,449
- Household income
- $51,429
- Rent vs Own
- Severe rent burden
- 1386.0
Population outlook (Morgan County) Hauer SSP2
- Today (2025)
- 118,775 people
- By 2030
- 116,979 · -1.5%
- By 2040
- 111,800 · -5.9%
- By 2050
- 105,181 · -11.4%
- By 2075
- 87,736 · -26.1%
- By 2100
- 67,624 · -43.1%
Race, ethnicity, and origin ACS 2023
- Neighborhood character
- Diverse neighborhood (Simpson 0.66)
- Race & ethnicity
- White 47% Hispanic / Latino 24% Black 24% Two or more races 10% Native American 2%
- Hispanic origin (detail)
- Mexican 15% Puerto Rican 2%
- Common ancestry
- Slovak 1% Italian 1% Lithuanian 1%
- Foreign-born
- 10% · Canada
- Languages at home
- 81% English-only · Spanish 18%
Political lean MEDSL · Morgan
- 2024 margin
- Solid R (+52.6) · D 23.2% · R 75.8%
- 2008→2024 swing
- -8.8pp toward R · 2008: -43.8pp · 2024: -52.6pp
- All cycles
- 2024: R+52.6 2020: R+49.2 2016: R+52.4 2012: R+44.5 2008: R+43.8
Not yet ingested
- Civics
- —
Market trends
- HPI YoY
- ▼ -89.26%
- Current HPI
- 247.8437
- Rent YoY
- ▲ 4.67%
- Metro
- Decatur, AL
- State GDP YoY
- ▲ 2.94%
- F500 in state
- 4
Industry mix (Fortune 500 HQ in AL)
| Industry | F500 HQs | Revenue |
|---|---|---|
| Financial Services | 1 | $8B |
|
||
| Healthcare | 1 | $5B |
|
||
Price history
+29.7% since first listed11 events — show timeline
- 2026-06-09 Listed $120,000 VMLS
- 2025-04-22 Rental Removed $1,000 VMLS
- 2025-04-15 Listed for Rent $1,000 VMLS
- 2021-12-20 Sold (Public Records) $75,000 Public Records
- 2021-12-19 Sold (MLS) $75,000 Greater Alabama MLS
- 2021-12-17 Sold (MLS) $75,000 SAARMLS
- 2021-12-07 Delisted — Greater Alabama MLS
- 2021-10-26 Price Changed $85,000 Greater Alabama MLS
- 2021-10-26 Price Changed $89,000 Greater Alabama MLS
- 2021-10-06 Listed $85,000 SAARMLS
- 2021-10-05 Listed $92,500 Greater Alabama MLS
Property tax history
+6.5%/yrLatest (2025): $378 · +0.0% YoY. Source: county tax records.
Cash-flow waterfall
monthlySold comps — $/sqft
last 12 mo · ≤1 miLoading sold comps…