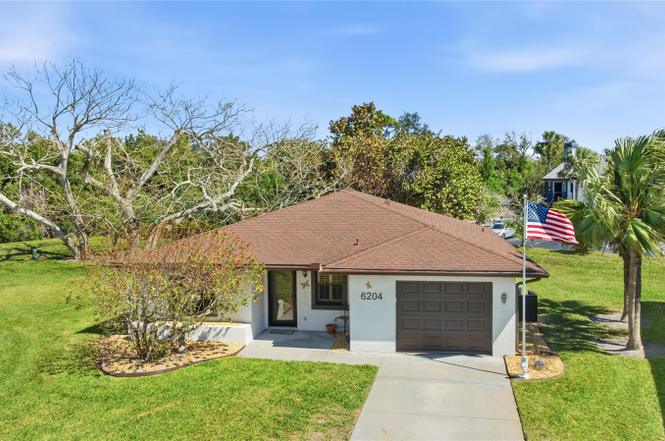
6204 Heritage Ln · Bradenton, FL
Flood risk 1/10 · Minimal
- FEMA flood zone
- X (unshaded)
- Chance of flooding over 30 yrs
- 0.0%
- Est. flood insurance / yr
- $507 – $1,088
Fire risk 1/10 · Minimal
- Est. fire insurance / yr
- $947 – $1,759
Heat risk 10/10 · Severe
- Hot days now (above 106°F)
- 7 days/yr
- Hot days in 30 yrs
- 30 days/yr
Wind risk 10/10 · Severe
- Chance of severe wind over 30 yrs
- 99.0%
Air-quality risk 3/10 · Minor
- Unhealthy air days now
- 2 days/yr
- Unhealthy air days in 30 yrs
- 2 days/yr
Risk factors via First Street. Map © Google.
Why this score? — see what drove the D grade
The composite is a weighted blend of 9 inputs, each scored 0–100. Each bar is that input's sub-score; the figure is the points it added to the 100-point composite (weight × sub-score).
- Cash flow +12.9/30.0
- ARV discount +7.5/15.0
- Schools +4.4/10.0
- Livability +4.0/5.0
- 1% rule +3.9/10.0
- DSCR +3.9/10.0
- Condition / age +2.5/5.0
- Rent growth +2.4/5.0
- Appreciation +0.0/10.0
$269,900
🖨 Deal sheet 📄 Offer letter ✓ Due diligence
Listing remarks MLS
Home set in cul-de-sac, roof replace in 2006. A/C replaced in 2008. Dishwasher replaced in 2008. Has a 20X24 enclosed lanai with A/C. BONUS IS YOU OWN YOUR LOT.
Key facts
- Wood laminate floors
- 0.23 acre lot
- Garage
Tags
Property features AI
Finance
- Other: Association name: Julie Conway; Total monthly HOA $293; total annual fees $3,516
- Financial info: Lease restrictions apply
- HOA & community: Has HOA (monthly fee $293); HOA includes cable TV, grounds maintenance, management, recreational facilities; Recreation facilities and shuffleboard court; Pool; Association approval required; Buyer approval required; Deed restrictions; No truck/RV/motorcycle parking; Pets allowed (cats and dogs, max 25 lb); Senior community
Exterior
- Parking: Attached garage with garage door opener; 1-car garage
- Security: Smoke detector(s)
- Utilities: Public water; Public sewer; Electricity connected; Sprinkler well; Underground utilities
- Home design: Single family residence; Residential property; One story; Faces west; Homestead exempt
- Construction: Block and stucco construction; Shingle roof; Slab foundation; Built with public records as source
- Exterior features: Covered, enclosed patio/porch; Sidewalk; Cul-de-sac lot; City limits; Paved; Mature landscaping; Asphalt road; Public maintained road
Interior
- Kitchen: Dishwasher; Range; Refrigerator; Eat-in kitchen
- Bedrooms: 2 bedrooms
- Flooring: Ceramic tile; Laminate; Wood; Recycled/composite flooring; Other
- Bathrooms: 2 full bathrooms
- Heating & cooling: Central heating; Central air conditioning
- Interior features: Ceiling fans; Eat-in kitchen; Living room/dining room combo; Split bedroom floorplan; Walk-in closet(s); Window treatments; Blinds
- Laundry & utility: Washer; Dryer; Laundry inside
Neighborhood map
What this means for you Summary
Snapshot
- This is a 2-bed/2.0-bath condo listed at $270k.
Deal economics
- At list price, monthly cash flow is $-20 ($-240/yr) — negative.
- To cash-flow at today's rent, offer at most $266k (1.3% below list).
- To meet the 1% rule (rent ≥ 1% of price), the offer needs to be $240k (10.9% below list).
- Recommended offer: $240k (10.9% below list) — sets the bar for 1% rule.
- Cap rate 6.2% vs local median 3.6% in Bradenton — top-decile yield for the area; either an underpriced asset or a hidden risk that comps aren't pricing in. Stress-test before assuming the spread holds.
Location & tenants
- Location reads 81/100 on livability (#101 in FL, #1,528 nationally) — a professional / high-income tenant draw. Strengths: commute A+, cost of living A+, housing A+; Watch: employment D+, crime D, amenities F.
- Manatee (suburban): math 54% / reading 50% proficiency, ranked #26 of 73 in FL (top 36%) — acceptable for families but not a draw, mixed tenant base, ~2y average lease.
- Zoned schools: Sea Breeze Elementary School (math 48% / reading 43%, grade D-, #1,247 of 2,144 statewide, top 59%, 499 students, 74% FRL); Bayshore High School (math 17% / reading 26%, grade F, #546 of 667 statewide, top 82%, 1,435 students, 65% FRL) — zoned schools average 70% FRL vs 51% district-wide (19 pts higher); higher-poverty schools than district average — tighter screening recommended.
- Zoned-school proficiency averages 34% at this address vs 52% district-wide (-18 pts) — the specific schools serving this property underperform the Manatee average; the district grade overstates school quality for this exact location.
- Market conditions: Rents soft (-0.3%/yr); 510 active listings in the ZIP; 40 comparable units currently listed for rent nearby; rentals at typical pace (median 20d on market — plan ~3-4 weeks tenant-placement turnaround); solid renter incomes; 7,472 units permitted in Manatee County in 2024 (1,782 in 5+ unit buildings).
- This rent runs 35% of the median local income ($82k/yr) — at the standard rent-burdened threshold; future hikes will face affordability resistance.
Forward outlook
- Local home prices are declining (-3.0%/yr); year-one equity from $2k of loan paydown is wiped out by about $8k of value loss. Plan a longer hold.
- Manatee County population projected at +43% by 2050 — long-run rental-demand tailwind backs the buy-and-hold thesis.
Negotiation context
- It's been on market 104 days — a 9% lower offer ($246k) is reasonable based on typical stale-listing flexibility.
- 2 sale attempts since 17y ago; this cycle's ask has dropped $25k (8%) from the opening price — seller is motivated, your offer sets the floor, not the list.
- Current owner paid $123k; list at $270k implies a 119% gain — meaningful room to come down on a strong offer.
Risks & watch-outs
- Climate carrying-cost: severe wind risk, 99% chance of damaging wind over 30y; extreme-heat days projected 7→30/yr by 2055 (HVAC capex compounding) — expect insurance premiums to compound above CPI over the hold.
Questions for the listing agent
- What do current leases actually rent for vs. the listed asking? Can we see a recent rent roll and the last 12 months of T-12 income?
- It's been on market 104 days. Have you received any prior offers? Is the seller open to a 11% concession, seller financing, or rate buy-down credit?
- What does the HOA fee cover, when was the last increase, and are there any pending special assessments or reserve-fund shortfalls?
- Any open or pending special assessments — roof, HVAC, plumbing, elevator, façade? What's the per-unit balance and payoff schedule, and is the seller paying it off at close or rolling it to the buyer?
- Why hasn't it sold? Are there any deal-killer items the seller is aware of (foundation, flood, title, zoning, code violations)?
- Is there a deadline driving the sale (1031 exchange, divorce, estate, relocation)? That informs how much negotiation room exists.
- Crime grade is D in this area — have there been break-ins, vandalism, or insurance claims at this property in the last 3 years? What carrier currently insures it and at what premium?
- The area grade is low — what's the realistic commute time and amenity access for the typical tenant pool here? Any planned neighborhood developments (good or bad) we should know about?
- What's the average days-on-market for RENTAL listings here right now (not sales)? A rising rental-DOM trend means longer vacancies and softer asking-rent achievability than the comps imply.
- What's the recent tenant-quality profile in this submarket — average credit score on applications, eviction rate, late-payment / NSF rate, and stable-employment percentage? A property-management company in the area should have these aggregated.
- How much new apartment / multifamily construction is in the pipeline within 1–3 miles? Heavy new supply (>2% of stock underway) typically softens rents 12–24 months out; light construction supports rent growth.
Investment metrics
- 1% rule
- 0.89% ✗
- Cap rate
- 6.20%
- Cash-on-cash
- -0.32%
- DSCR
- 0.99
- GRM
- 9.4
CMA / ARV
No comps found within radius.
Projected returns pro-forma
-3.0% appreciation · 0.0% rent growth · sell at horizon
- IRR
- -20.3%
- Equity multiple
- 0.31×
- Total profit
- $-51,988
- Equity at exit
- $40,243
- IRR
- -22.3%
- Equity multiple
- 0.02×
- Total profit
- $-73,862
- Equity at exit
- $23,336
Cash invested: $75,572 (down + closing). Projections, not guarantees.
Landlord ↔ Tenant lean methodology
- Overall (STATE)
- 87 Strongly Landlord-Friendly
- State Florida
- 87 Strongly Landlord-Friendly · R+3
- County
- — inherits STATE
- City
- — inherits STATE
ZIP-level market 34209
- Rents YoY
- -0.3%
- Active inventory
- 510
- Price-to-rent
- 9.4×
Monthly cashflow live
- Estimated rent
- $2,404 high interval (Pro) →
- Mortgage (P&I)
- −$1,415
- Tax from tax record
- −$99 /mo · $1,185/yr
- Insurance
- −$112
- HOA
- −$293
- Vacancy / Maint / Mgmt
- −$505
- Net cashflow
- $-20
Break-even live
UW: 25.0% down · 7.5% · 30yr · 1.5% tax · 5.0% vac · 8.0% maint · 8.0% mgmt
Financing live
Cash to close
- Down payment
- $67,475
- Closing costs
- $8,097
- Reserves months
- —
- Total cash needed
- —
Loan-product check · same deal, 3 products live
Conventional
25% down · 7.5% · 30yr
- Down + closing
- —
- Monthly P&I
- —
- Monthly cashflow
- —
- DSCR
- —
- Eligible?
- —
Personal DTI + credit; lowest rate.
DSCR
20% down · 8.5% · 30yr
- Down + closing
- —
- Monthly P&I
- —
- Monthly cashflow
- —
- DSCR
- —
- Eligible?
- —
No personal income docs; deal must DSCR.
Hard money
10% down · 12.0% · 12mo
- Down + closing
- —
- Monthly P&I
- —
- Monthly cashflow
- —
- DSCR
- —
- Eligible?
- —
Short-term bridge; refi at stabilization.
Rent comps 40 comps
| Address | Beds | Baths | Sqft | Rent | $/sqft | DOM | Units | Dist |
|---|---|---|---|---|---|---|---|---|
| 5933 28th Ave W Bradenton, FL | 1.0–2.0 | 1.0–2.0 | 945 | $2,013 | $2.13 | 1d | 6 | 0.08mi |
| 2926 63rd St W Bradenton, FL | 2.0 | 2.0 | 946 | $2,100 | $2.22 | 3d | 1 | 0.23mi |
| 6304 Pointe West Blvd Unit A309 Bradenton, FL | 2.0 | 2.0 | 1042 | $1,795 | $1.72 | 10d | 1 | 0.25mi |
| 5909 30th Ave W Bradenton, FL | 1.0–2.0 | 1.0–2.0 | 788 | $1,670 | $2.12 | 1d | 6 | 0.28mi |
| 6415 21st Ave W Bradenton, FL | 1.0–2.0 | 1.0–2.0 | 1150 | $1,896 | $1.65 | 3d | 5 | 0.29mi |
| 2914 64th St W Bradenton, FL | 2.0 | 2.0 | 1135 | $2,025 | $1.78 | 23d | 1 | 0.31mi |
| 6709 35th Ave W Unit 1346494P Bradenton, FL | 3.0 | 2.0 | 1227 | $4,527 | $3.69 | 15d | 1 | 0.52mi |
| 6908 Arbor Oaks Cir Bradenton, FL | 3.0 | 2.0 | 1600 | $3,200 | $2.00 | 3d | 1 | 0.55mi |
| 5907 36th Ave Cir W #5907 Bradenton, FL | 2.0 | 2.0 | 937 | $2,800 | $2.99 | 23d | 1 | 0.62mi |
| 6914 20th Ave W Bradenton, FL | 2.0 | 2.0 | 1383 | $2,795 | $2.02 | 15d | 1 | 0.64mi |
| 2724 72nd St W Unit 2010 Bradenton, FL | 2.0 | 2.0 | 942 | $1,950 | $2.07 | 2d | 1 | 0.69mi |
| 6602 38th Avenue Cir W Bradenton, FL | 3.0 | 2.0 | 1800 | $2,800 | $1.56 | 23d | 1 | 0.71mi |
| 5004 22nd Ave W Bradenton, FL | 3.0 | 2.0 | 1577 | $2,500 | $1.59 | 3d | 1 | 0.75mi |
| 3401 50th St W Bradenton, FL | 3.0 | 2.0 | 1418 | $2,699 | $1.90 | 23d | 1 | 0.81mi |
| 2727 75th St W Bradenton, FL | 1.0–2.0 | 1.5 | 835 | $1,700 | $2.04 | 3d | 4 | 0.82mi |
| 4904 19th Ave W Bradenton, FL | 3.0 | 2.0 | 1762 | $4,000 | $2.27 | 14d | 1 | 0.88mi |
| 4112 66th Street Cir W Bradenton, FL | 2.0 | 2.0 | 1100 | $1,960 | $1.78 | 19d | 1 | 0.88mi |
| 1225 56th St W Bradenton, FL | 2.0 | 2.0 | 1222 | $1,800 | $1.47 | 2d | 1 | 0.89mi |
| 7207 15th Avenue Dr W Bradenton, FL | 3.0 | 2.0 | 1719 | $3,495 | $2.03 | 23d | 1 | 0.90mi |
| 7242 Hamilton Rd Bradenton, FL | 3.0 | 2.5 | 1520 | $2,800 | $1.84 | 2d | 1 | 0.90mi |
| 4122 Overture Cir #533 Bradenton, FL | 3.0 | 2.0 | 1381 | $2,900 | $2.10 | 23d | 1 | 0.90mi |
| 7202 Hamilton Rd Unit 7202 Bradenton, FL | 3.0 | 2.0 | 1277 | $2,250 | $1.76 | 15d | 1 | 0.93mi |
| 4112 Cape Vista Dr Bradenton, FL | 3.0 | 2.0 | 1450 | $3,495 | $2.41 | 23d | 1 | 0.93mi |
| 4005 Overture Cir Unit 4005 Bradenton, FL | 3.0 | 2.0 | 1381 | $2,700 | $1.96 | 23d | 1 | 0.94mi |
| 6108 10th Ave W Bradenton, FL | 3.0 | 2.0 | 1534 | $7,000 | $4.56 | 23d | 1 | 0.95mi |
| 4241 Overture Cir Unit 447 Bradenton, FL | 3.0 | 2.5 | 1627 | $3,000 | $1.84 | 23d | 1 | 0.96mi |
| 4037 Overture Cir Unit 4037 Bradenton, FL | 3.0 | 2.0 | 1381 | $2,195 | $1.59 | 23d | 1 | 0.98mi |
| 5111 13th Avenue Dr W Bradenton, FL | 3.0 | 2.0 | 1778 | $3,700 | $2.08 | 23d | 1 | 0.98mi |
| 4161 66th Street Cir W Bradenton, FL | 2.0 | 2.0 | 1044 | $1,800 | $1.72 | 15d | 1 | 1.00mi |
| 4209 66th Street Cir W Bradenton, FL | 2.0 | 2.0 | 1044 | $2,900 | $2.78 | 23d | 1 | 1.00mi |
| 4063 Overture Cir Bradenton, FL | 3.0 | 2.0 | 1277 | $2,400 | $1.88 | 23d | 1 | 1.00mi |
| 7610 34th Ave W Unit 203 Bradenton, FL | 3.0 | 2.5 | 1857 | $3,000 | $1.62 | 23d | 1 | 1.03mi |
| 4196 Overture Cir Unit 4196 Bradenton, FL | 3.0 | 2.0 | 1277 | $2,300 | $1.80 | 3d | 1 | 1.03mi |
| 7610 34th Ave W #102 Bradenton, FL | 2.0 | 2.0 | 1657 | $2,600 | $1.57 | 23d | 1 | 1.03mi |
| 4110 Ironwood Cir #104 Bradenton, FL | 2.0 | 2.0 | 1152 | $1,800 | $1.56 | 23d | 1 | 1.03mi |
| 4040 Ironwood Cir Unit 406F Bradenton, FL | 2.0 | 2.0 | 1008 | $1,675 | $1.66 | 15d | 1 | 1.04mi |
| 4040 Ironwood Cir Unit 404F Bradenton, FL | 2.0 | 2.0 | 1008 | $1,750 | $1.74 | 11d | 1 | 1.04mi |
| 7710 34th Ave W #202 Bradenton, FL | 2.0 | 2.0 | 1650 | $3,000 | $1.82 | 23d | 1 | 1.04mi |
| 7710 34th Ave W #303 Bradenton, FL | 3.0 | 2.5 | 1854 | $3,500 | $1.89 | 15d | 1 | 1.04mi |
| 6618 7th Ave Cir W #1404 Bradenton, FL | 2.0 | 2.0 | 1440 | $3,400 | $2.36 | 23d | 1 | 1.09mi |
HOA detail condo
- Monthly dues
- $293 · $3,516/yr
- Assessments
- None detected in remarks — confirm with the listing agent.
Listing history 23 events
-
2026-06-18days on market $269,900 Active 104 DOM
-
2026-06-17days on market $269,900 Active 103 DOM
-
2026-06-16days on market $269,900 Active 102 DOM
-
2026-06-15days on market $269,900 Active 101 DOM
-
2026-06-13days on market $269,900 Active 99 DOM
-
2026-06-13days on market $269,900 Active 98 DOM
-
2026-06-10days on market $269,900 Active 96 DOM
-
2026-06-09days on market $269,900 Active 95 DOM
-
2026-06-08days on market $269,900 Active 94 DOM
-
2026-06-08days on market $269,900 Active 93 DOM
-
2026-06-03days on market $269,900 Active 89 DOM
-
2026-06-02days on market $269,900 Active 88 DOM
-
2026-06-01days on market $269,900 Active 87 DOM
-
2026-05-31days on market $269,900 Active 86 DOM
-
2026-05-04price $269,900
-
2026-04-14price $284,900
-
2026-03-06$294,900 Active
-
2009-11-03soldstatus $123,000
-
2009-10-30soldstatus $123,000 163-char remark
Show marketing remark (163 chars)
Home set in cul-de-sac, roof replace in 2006. A/C replaced in 2008. Dishwasher replaced in 2008. Has a 20X24 enclosed lanai with A/C. BONUS IS YOU OWN YOUR LOT.
-
2009-01-26$138,000 163-char remark
Show marketing remark (163 chars)
Home set in cul-de-sac, roof replace in 2006. A/C replaced in 2008. Dishwasher replaced in 2008. Has a 20X24 enclosed lanai with A/C. BONUS IS YOU OWN YOUR LOT.
-
2003-12-08soldstatus $130,000
-
1997-10-15soldstatus $85,900
-
1990-05-07soldstatus $71,700
ⓘ Source: listings_history table (triggers on properties + properties_extension) + one-shot
backfill from property_details.listing_events for pre-trigger history.
Tax reassessment forecast FL · Resets to sale price
- Current annual tax
- $1,185 · $99/mo
- Projected year-2 tax
- $2,240 · $187/mo
- Expected delta
- +$1,056/yr (+$88/mo · 89.1%)
ⓘ Screening estimate from a state-policy table — verify with the county assessor before closing.
Climate risk First Street
- Flood 1/10 Low FEMA zone X (unshaded) · 0% chance over 30 yrs
- Wildfire 1/10 Low
- Heat 10/10 Extreme 7 d/yr ≥106°F today · 30 d/yr by 30 yrs out
- Wind 10/10 Extreme 99% chance of damaging wind over 30 yrs
- Air quality 3/10 Moderate 2 unhealthy d/yr today · 2 by 30 yrs out
Nearby sold comps map
Loading sold comps map…
Walkable amenities ~0.75 mi
Loading nearby amenities…
Taxation est. · year 1
- Rental income
- $28,854
- − Mortgage interest
- −$15,119
- − Property taxes
- −$1,185
- − Insurance
- −$1,350
- − Repairs & maintenance
- −$2,308
- − Management
- −$2,308
- − HOA
- −$3,516
- − Depreciation
- −$7,852
- Taxable loss
- −$4,783
- Est. tax savings @ 24.0%
- +$1,148
- After-tax cash flow
- $908/yr
For passive investors: Depreciation is non-cash, so a rental often shows a tax loss while cash-flowing — sheltering income. Rental losses are passive: they offset passive income freely, and up to $25,000/yr can offset ordinary (W-2) income if you actively participate and your MAGI is under $100k (phasing out to $0 by $150k); unused losses carry forward. On sale, claimed depreciation is recaptured at up to 25%, and gains may owe capital-gains tax (a 1031 exchange can defer both). Figures are a year-1 estimate at your 24.0% rate — not tax advice; consult a CPA.
Schools (NCES district)
- District
- Manatee
- NCES district ID
- 1201230
- Math proficiency
- 54% ▼ -6.00%
- Reading proficiency
- 50% ▼ -2.00%
- Median HH income
- $49,607
- Composite
- 44.43/100
- National rank
- #2806
- State rank
- #26 of 73 in FL
Livability — Bradenton
- Score
- 81/100
- State rank
- #101
- US rank
- #1528
Category grades
Schools grade is shown separately in the Schools card above.
Census & demographics
- Census place
- Bradenton, FL
- County
- Manatee County · 416,364 people
- City population
- 227,091
- Metro
- North Port-Sarasota-Bradenton, FL
- Population (ZIP)
- 33,224
- Household income
- $81,728
- Rent vs Own
- Severe rent burden
- 1126.0
Population outlook (Manatee County) Hauer SSP2
- Today (2025)
- 447,342 people
- By 2030
- 488,911 · +9.3%
- By 2040
- 567,934 · +27.0%
- By 2050
- 637,995 · +42.6%
- By 2075
- 781,970 · +74.8%
- By 2100
- 848,272 · +89.6%
Race, ethnicity, and origin ACS 2023
- Neighborhood character
- Predominantly White (84%)
- Race & ethnicity
- White 84% Hispanic / Latino 11% Two or more races 6% Black 2% Asian 1%
- Hispanic origin (detail)
- Puerto Rican 4% Cuban 3%
- Common ancestry
- Romanian 3% Slovak 3% Lithuanian 3%
- Foreign-born
- 9% · Canada, Jamaica, China
- Languages at home
- 90% English-only · Spanish 6% Russian/Polish/Slavic 1% Other Indo-European 1%
Political lean MEDSL · Manatee
- 2024 margin
- Strong R (+23.5) · D 37.9% · R 61.4%
- 2008→2024 swing
- -16.5pp toward R · 2008: -7.0pp · 2024: -23.5pp
- All cycles
- 2024: R+23.5 2020: R+16.1 2016: R+17.1 2012: R+12.5 2008: R+7.0
Not yet ingested
- Civics
- —
Market trends
- HPI YoY
- ▼ -360.34%
- Current HPI
- 320.0061
- Rent YoY
- ▼ -0.30%
- Metro
- North Port-Sarasota-Bradenton, FL
- State GDP YoY
- ▲ 3.28%
- F500 in state
- 36
Industry mix (Fortune 500 HQ in FL)
| Industry | F500 HQs | Revenue |
|---|---|---|
| Industrial Technology | 2 | $29B |
|
||
| Insurance | 2 | $17B |
|
||
| Retail | 1 | $60B |
|
||
| Technology Distribution | 1 | $58B |
|
||
| Homebuilding | 1 | $35B |
|
||
| Technology Manufacturing | 1 | $35B |
|
||
Price history
+276.4% since first listed9 events — show timeline
- 2026-05-04 Price Changed $269,900 Stellar MLS as Distributed by MLS Grid
- 2026-04-14 Price Changed $284,900 Stellar MLS as Distributed by MLS Grid
- 2026-03-06 Listed $294,900 Stellar MLS as Distributed by MLS Grid
- 2009-11-03 Sold (Public Records) $123,000 Public Records
- 2009-10-30 Sold (MLS) $123,000 Stellar MLS as Distributed by MLS Grid
- 2009-01-26 Listed $138,000 Stellar MLS as Distributed by MLS Grid
- 2003-12-08 Sold (Public Records) $130,000 Public Records
- 1997-10-15 Sold (Public Records) $85,900 Public Records
- 1990-05-07 Sold (Public Records) $71,700 Public Records
Property tax history
+2.3%/yrLatest (2025): $1,185 · +3.8% YoY. Source: county tax records.
Cash-flow waterfall
monthlySold comps — $/sqft
last 12 mo · ≤1 miLoading sold comps…