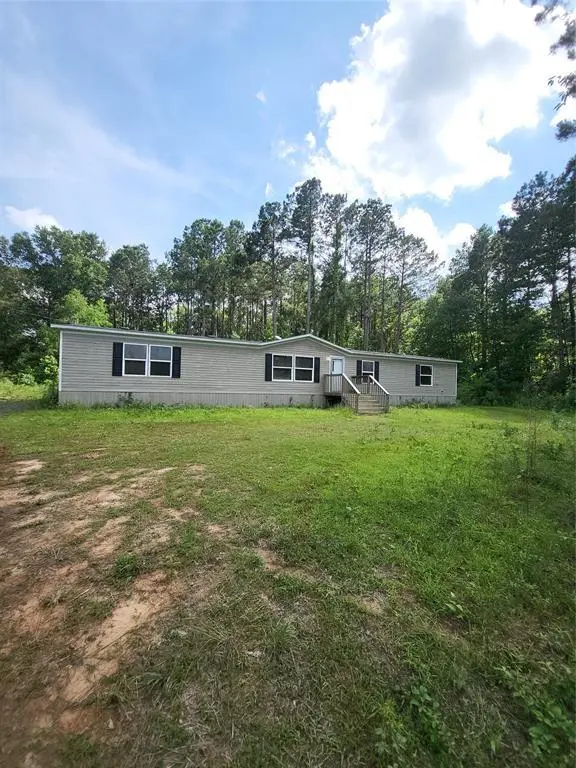
9571 Paula St · Keachi, LA
Flood risk 1/10 · Minimal
- FEMA flood zone
- X (unshaded)
- Chance of flooding over 30 yrs
- 0.0%
- Est. flood insurance / yr
- $507 – $1,088
Fire risk 5/10 · Moderate
- Est. fire insurance / yr
- $1,269 – $2,357
Heat risk 6/10 · Moderate
- Hot days now (above 111°F)
- 7 days/yr
- Hot days in 30 yrs
- 22 days/yr
Wind risk 6/10 · Moderate
- Chance of severe wind over 30 yrs
- 68.0%
Air-quality risk 1/10 · Minimal
- Unhealthy air days now
- 0 days/yr
- Unhealthy air days in 30 yrs
- 0 days/yr
Risk factors via First Street. Map © Google.
Why this score? — see what drove the D+ grade
The composite is a weighted blend of 9 inputs, each scored 0–100. Each bar is that input's sub-score; the figure is the points it added to the 100-point composite (weight × sub-score).
- Cash flow +19.9/30.0
- ARV discount +7.5/15.0
- DSCR +6.3/10.0
- 1% rule +4.4/10.0
- Livability +2.9/5.0
- Rent growth +2.5/5.0
- Condition / age +2.5/5.0
- Schools +2.2/10.0
- Appreciation +0.0/10.0
$155,000
🖨 Deal sheet 📄 Offer letter ✓ Due diligence
Listing remarks
This home COULD be a real diamond in the rough JEWEL. SERIOUS need for a quick sale. Just a very few spaces on the inside need a little touch up where the puppy was a puppy and one room needs carpet replaced. Other than that, wonderful 5 bedroom, 3 full bath open concept home. Huge utility room and lots of space here. This is 3 separate lots, side by side for a total of 4.11 acres. PLEASE MAKE SURE YOU PUT ALL THREE PARCELS ON YOUR OFFER. Seriously, just a little bit of touch ups and you have a gem. Home is not even 5 years old. We are just waiting on the weather. to finish sprucing up the outside. AGENTS, please read private remarks. Very Important. Also, please give us grace in the pics!
Key facts
- 3 separate lots
- 4.11 acres
- Open concept home
Tags
Property features AI
Finance
- Other: Will not subdivide; Restrictions: None
- Financial info: Treat as clear loan type; No second mortgage
- HOA & community: No association
Exterior
- Parking: Additional parking
- Utilities: Aerobic septic; Co-op electric; Co-op water; Cable available
- Home design: Manufactured home (residential); One story; Property attached; Located on multiple parcels; Subdivision: Pecan Farms
- Construction: Built in 2021; Siding construction; Asphalt shingle roof
- Exterior features: Deck; Brush and partially wooded vegetation; Acreage lot
Interior
- Kitchen: Electric oven; Electric range
- Bedrooms: 5 bedrooms (primary bedroom on main level)
- Flooring: Carpet; Laminate
- Bathrooms: 3 full bathrooms
- Heating & cooling: Central heating; Central air conditioning
- Interior features: Open floorplan; Cable TV available; High-speed internet available; Walk-in closet(s); One living area; One dining area; Two total rooms (listed)
- Laundry & utility: Utility room; Electric water heater
Neighborhood map
What this means for you Summary
Snapshot
- This is a 3-bed/3.0-bath manufactured listed at $155k.
Deal economics
- At list price, monthly cash flow is $186 ($2k/yr) — positive.
- The deal already cash-flows at list — no discount required.
- To meet the 1% rule (rent ≥ 1% of price), the offer needs to be $145k (6.5% below list).
- Recommended offer: $145k (6.5% below list) — sets the bar for 1% rule.
Location & tenants
- Location reads 57/100 on livability (#317 in LA) — a working-class tenant base; expect higher turnover. Strengths: cost of living A+, housing A+; Watch: employment C-, schools F, crime F.
- Caddo Parish (urban): math 21% / reading 32% proficiency, ranked #53 of 98 in LA (top 54%) — low school quality limits family demand, transient renter base, plan for 1-2y turnover; 64% free/reduced lunch — lower-income household profile, screen leases tightly.
- Market conditions: 59 active listings in the ZIP; 1 comparable units currently listed for rent nearby; 221 units permitted in Caddo Parish in 2024 (0 in 5+ unit buildings).
Forward outlook
- Local home prices are declining (-3.0%/yr); year-one equity from $1k of loan paydown is wiped out by about $5k of value loss. Plan a longer hold.
- Caddo County population projected at -15% by 2050 — secular population decline; favor cash flow + early exit over multi-decade hold.
Negotiation context
- It's been on market 21 days — a 2% lower offer ($153k) is reasonable based on typical stale-listing flexibility.
Risks & watch-outs
- Climate carrying-cost: major wind risk, 68% chance of damaging wind over 30y; moderate wildfire risk; extreme-heat days projected 7→22/yr by 2055 (HVAC capex compounding) — expect insurance premiums to compound above CPI over the hold.
Questions for the listing agent
- Is there a deadline driving the sale (1031 exchange, divorce, estate, relocation)? That informs how much negotiation room exists.
- Schools are F-rated, which usually means shorter tenancies and higher turnover. Who's the typical renter profile here, and what's been the actual vacancy rate?
- Crime grade is F in this area — have there been break-ins, vandalism, or insurance claims at this property in the last 3 years? What carrier currently insures it and at what premium?
- The area grade is low — what's the realistic commute time and amenity access for the typical tenant pool here? Any planned neighborhood developments (good or bad) we should know about?
- What's the average days-on-market for RENTAL listings here right now (not sales)? A rising rental-DOM trend means longer vacancies and softer asking-rent achievability than the comps imply.
- What's the recent tenant-quality profile in this submarket — average credit score on applications, eviction rate, late-payment / NSF rate, and stable-employment percentage? A property-management company in the area should have these aggregated.
- How much new for-sale + rental construction is in the pipeline within 1–3 miles? Heavy new supply typically softens prices + rents 12–24 months out; constrained supply supports both.
Investment metrics
- 1% rule
- 0.94% ✗
- Cap rate
- 7.73%
- Cash-on-cash
- 5.15%
- DSCR
- 1.23
- GRM
- 8.9
CMA / ARV
- ARV (on-the-fly)
- $78,736
- Comps found
- 1
Show comp detail 1 sale within ~0.75 mi
| Address | Dist | Beds/Ba | Sqft | Sold | Price | $/sf | Match |
|---|---|---|---|---|---|---|---|
| 9932 Lareta St | 0.73mi | 4/2.0 (+1) | 1,960 (-8%) | 13mo | $72,900 | $37 | 33 |
Match score weights: distance 35% · size 25% · config 20% · recency 20%. Top-matched comps best support the ARV.
Projected returns pro-forma
-3.0% appreciation · 3.0% rent growth · sell at horizon
- IRR
- -8.3%
- Equity multiple
- 0.69×
- Total profit
- $-13,300
- Equity at exit
- $23,111
- IRR
- 1.1%
- Equity multiple
- 1.08×
- Total profit
- $3,503
- Equity at exit
- $13,402
Cash invested: $43,400 (down + closing). Projections, not guarantees.
Landlord ↔ Tenant lean methodology
- Overall (STATE)
- 90 Strongly Landlord-Friendly
- State Louisiana
- 90 Strongly Landlord-Friendly · R+12
- County
- — inherits STATE
- City
- — inherits STATE
ZIP-level market 71047
- Home prices YoY
- -27.5%
- Active inventory
- 59
- Price-to-rent
- 8.9×
Monthly cashflow live
- Estimated rent
- $1,450 medium interval (Pro) →
- Mortgage (P&I)
- −$813
- Tax from tax record
- −$82 /mo · $982/yr
- Insurance
- −$65
- HOA
- −$0
- Vacancy / Maint / Mgmt
- −$304
- Net cashflow
- $186
Break-even live
UW: 25.0% down · 7.5% · 30yr · 1.5% tax · 5.0% vac · 8.0% maint · 8.0% mgmt
Financing live
Cash to close
- Down payment
- $38,750
- Closing costs
- $4,650
- Reserves months
- —
- Total cash needed
- —
Loan-product check · same deal, 3 products live
Conventional
25% down · 7.5% · 30yr
- Down + closing
- —
- Monthly P&I
- —
- Monthly cashflow
- —
- DSCR
- —
- Eligible?
- —
Personal DTI + credit; lowest rate.
DSCR
20% down · 8.5% · 30yr
- Down + closing
- —
- Monthly P&I
- —
- Monthly cashflow
- —
- DSCR
- —
- Eligible?
- —
No personal income docs; deal must DSCR.
Hard money
10% down · 12.0% · 12mo
- Down + closing
- —
- Monthly P&I
- —
- Monthly cashflow
- —
- DSCR
- —
- Eligible?
- —
Short-term bridge; refi at stabilization.
Rent comps 1 comps
| Address | Beds | Baths | Sqft | Rent | $/sqft | DOM | Units | Dist |
|---|---|---|---|---|---|---|---|---|
| 9932 Lareta St Keithville, LA | 4.0 | 2.0 | 1960 | $1,450 | $0.74 | 20d | 1 | 0.75mi |
Listing history 17 events
-
2026-06-18days on market $155,000 Active 21 DOM
-
2026-06-17days on market $155,000 Active 20 DOM
-
2026-06-16days on market $155,000 Active 19 DOM
-
2026-06-15days on market $155,000 Active 18 DOM
-
2026-06-14days on market $155,000 Active 16 DOM
-
2026-06-13days on market $155,000 Active 15 DOM
-
2026-06-10days on market $155,000 Active 13 DOM
-
2026-06-09days on market $155,000 Active 12 DOM
-
2026-06-08days on market $155,000 Active 11 DOM
-
2026-06-07days on market $155,000 Active 10 DOM
-
2026-06-05days on market $155,000 Active 7 DOM
-
2026-06-03days on market $155,000 Active 6 DOM
-
2026-06-02days on market $155,000 Active 5 DOM
-
2026-06-01days on market $155,000 Active 4 DOM
-
2026-05-31days on market $155,000 Active 3 DOM
-
2026-05-30days on market $155,000 Active 2 DOM
-
2026-05-26$155,000 Active
ⓘ Source: listings_history table (triggers on properties + properties_extension) + one-shot
backfill from property_details.listing_events for pre-trigger history.
Tax reassessment forecast LA · Resets to sale price
- Current annual tax
- $982 · $82/mo
- Projected year-2 tax
- $982 · $82/mo
- Expected delta
- $0/yr ($0/mo · 0.0%)
ⓘ Screening estimate from a state-policy table — verify with the county assessor before closing.
Climate risk First Street
- Flood 1/10 Low FEMA zone X (unshaded) · 0% chance over 30 yrs
- Wildfire 5/10 Major
- Heat 6/10 Major 7 d/yr ≥111°F today · 22 d/yr by 30 yrs out
- Wind 6/10 Major 68% chance of damaging wind over 30 yrs
- Air quality 1/10 Low 0 unhealthy d/yr today · 0 by 30 yrs out
Nearby sold comps map
Loading sold comps map…
Walkable amenities ~0.75 mi
Loading nearby amenities…
Taxation est. · year 1
- Rental income
- $17,400
- − Mortgage interest
- −$8,682
- − Property taxes
- −$982
- − Insurance
- −$775
- − Repairs & maintenance
- −$1,392
- − Management
- −$1,392
- − Depreciation
- −$4,509
- Taxable loss
- −$332
- Est. tax savings @ 24.0%
- +$80
- After-tax cash flow
- $2,315/yr
For passive investors: Depreciation is non-cash, so a rental often shows a tax loss while cash-flowing — sheltering income. Rental losses are passive: they offset passive income freely, and up to $25,000/yr can offset ordinary (W-2) income if you actively participate and your MAGI is under $100k (phasing out to $0 by $150k); unused losses carry forward. On sale, claimed depreciation is recaptured at up to 25%, and gains may owe capital-gains tax (a 1031 exchange can defer both). Figures are a year-1 estimate at your 24.0% rate — not tax advice; consult a CPA.
Schools (NCES district)
- District
- Caddo Parish
- NCES district ID
- 2200300
- Math proficiency
- 21% ▼ -33.00%
- Reading proficiency
- 32% ▼ -30.00%
- Median HH income
- $39,227
- Composite
- 22.23/100
- National rank
- #8148
- State rank
- #53 of 98 in LA
Livability — Keachi
- Score
- 57/100
- State rank
- #317
- US rank
- #21617
Category grades
Schools grade is shown separately in the Schools card above.
Census & demographics
- City population
- 164,123
- Population (ZIP)
- 10,874
Population outlook (Caddo County) Hauer SSP2
- Today (2025)
- 243,190 people
- By 2030
- 237,231 · -2.5%
- By 2040
- 222,502 · -8.5%
- By 2050
- 206,516 · -15.1%
- By 2075
- 165,706 · -31.9%
- By 2100
- 122,262 · -49.7%
Race, ethnicity, and origin ACS 2023
- Neighborhood character
- Predominantly White (77%)
- Race & ethnicity
- White 77% Black 17% Two or more races 3% Hispanic / Latino 2% Native American 1%
- Common ancestry
- Lithuanian 4% Slovak 2% Romanian 1%
- Foreign-born
- 1% · Canada
- Languages at home
- 98% English-only · Spanish 1% French/Haitian/Cajun 1%
Political lean MEDSL · Caddo
- 2024 margin
- Toss-up / Even · D 51.6% · R 47.0% · Other 1.4%
- 2008→2024 swing
- +1.6pp toward D · 2008: 3.0pp · 2024: 4.6pp
- All cycles
- 2024: D+4.6 2020: D+6.8 2016: D+4.2 2012: D+4.9 2008: D+3.0
Not yet ingested
- Civics
- —
Market trends
- HPI YoY
- ▼ -59.82%
- Current HPI
- 158.0139
- Rent YoY
- —
- Metro
- —
- State GDP YoY
- ▲ 3.29%
- F500 in state
- 10
Industry mix (Fortune 500 HQ in LA)
| Industry | F500 HQs | Revenue |
|---|---|---|
| Telecommunications | 2 | $23B |
|
||
| Utilities | 1 | $12B |
|
||
| Wholesale / Distribution | 1 | $5B |
|
||
| Advertising | 1 | $2B |
|
||
Price history
1 event — show timeline
- 2026-05-26 Listed $155,000 NTREIS
Property tax history
+15.2%/yrLatest (2025): $982 · +0.2% YoY. Source: county tax records.
Cash-flow waterfall
monthlySold comps — $/sqft
last 12 mo · ≤1 miLoading sold comps…