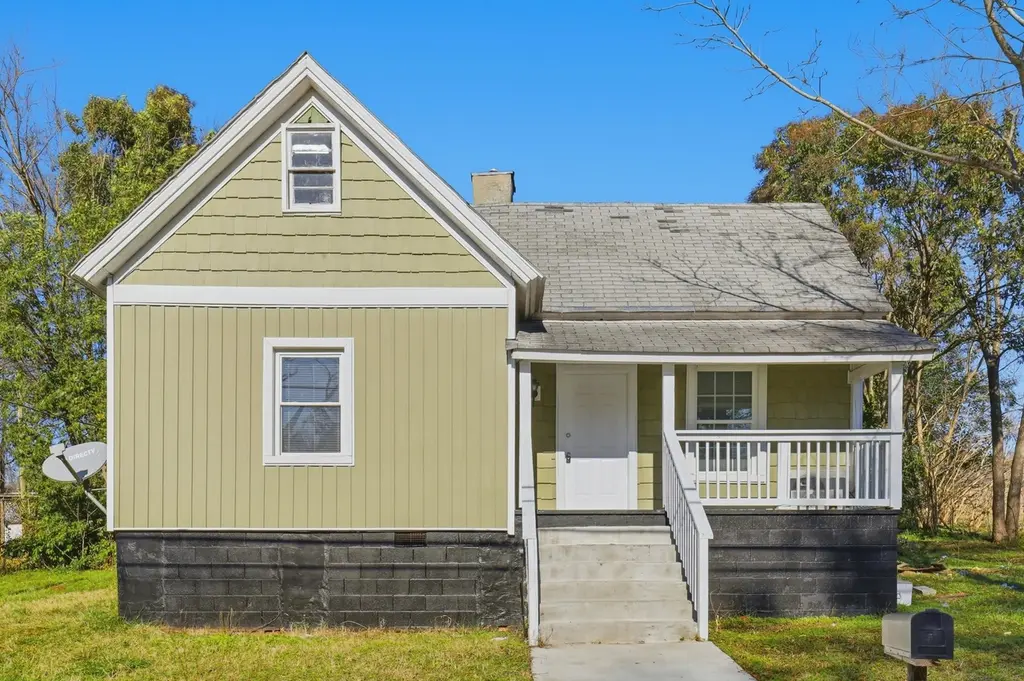
109 Farmer Street St · Anderson, SC
Flood risk 1/10 · Minimal
- FEMA flood zone
- X (unshaded)
- Chance of flooding over 30 yrs
- 0.0%
- Est. flood insurance / yr
- $507 – $1,088
Fire risk 4/10 · Minor
- Est. fire insurance / yr
- $783 – $1,453
Heat risk 6/10 · Moderate
- Hot days now (above 106°F)
- 7 days/yr
- Hot days in 30 yrs
- 17 days/yr
Wind risk 2/10 · Minimal
- Chance of severe wind over 30 yrs
- 4.0%
Air-quality risk 4/10 · Minor
- Unhealthy air days now
- 3 days/yr
- Unhealthy air days in 30 yrs
- 5 days/yr
Risk factors via First Street. Map © Google.
Why this score? — see what drove the D grade
The composite is a weighted blend of 9 inputs, each scored 0–100. Each bar is that input's sub-score; the figure is the points it added to the 100-point composite (weight × sub-score).
- Cash flow +14.2/30.0
- ARV discount +7.5/15.0
- DSCR +4.3/10.0
- Rent growth +4.1/5.0
- Schools +3.9/10.0
- Livability +3.4/5.0
- 1% rule +2.7/10.0
- Condition / age +2.5/5.0
- Appreciation +0.0/10.0
$184,900
🖨 Deal sheet (PDF) 📄 Offer letter ✓ Due diligence
Listing remarks
Motivated seller! Charming 2-Bedroom, 2-Bathroom Bungalow with flex space! Step into this beautifully updated bungalow designed for modern, convenient living. Featuring a unique floorplan, this home offers two spacious bedrooms and two full bathrooms, perfect for comfort and functionality. The heart of the home boasts stylish updates throughout, creating a warm and inviting atmosphere. Upstairs, you’ll find a large unfinished flex space—ideal for storage, a future home office, or a creative space to make your own. Outside, enjoy a cozy yard and the charm of a quiet neighborhood. Located just minutes from restaurants, shopping, and parks, this home combines peaceful living with
Key facts
- Cozy yard
- Quiet neighborhood
- Unique floorplan
Tags
Property features AI
Exterior
- Utilities: Public water; Public sewer
- Home design: Single family residence; One level
- Construction: Composition roof
- Exterior features: Porch; Level lot
Interior
- Kitchen: Microwave; Free-standing range; Electric water heater
- Flooring: Laminate
- Bathrooms: 2 full bathrooms
- Heating & cooling: Electric heating; Ductless heating; Electric cooling
- Interior features: Laminate counters; Open floorplan; Fireplace (1)
- Laundry & utility: Washer hookup on main level; Electric dryer hookup
Neighborhood map
What this means for you Summary
Snapshot
- This is a 2-bed/2.0-bath other listed at $185k.
Deal economics
- At list price, monthly cash flow is $30 ($363/yr) — positive.
- The deal already cash-flows at list — no discount required.
- To meet the 1% rule (rent ≥ 1% of price), the offer needs to be $143k (22.7% below list).
- Recommended offer: $143k (22.7% below list) — sets the bar for 1% rule.
- Cap rate 6.5% vs local median 3.2% in Anderson — top-decile yield for the area; either an underpriced asset or a hidden risk that comps aren't pricing in. Stress-test before assuming the spread holds.
Location & tenants
- Location reads 67/100 on livability (#98 in SC) — a middle-class / working-renter tenant base. Strengths: cost of living A+, health & safety A+, housing B+; Watch: amenities C-, crime F, commute F.
- Anderson 05 (suburban): math 44% / reading 49% proficiency, ranked #20 of 80 in SC (top 25%) — families likely to look elsewhere, expect single-tenant / working-renter base with shorter leases.
- Zoned schools: Calhoun Academy of The Arts (math 41% / reading 37%, grade F, #301 of 597 statewide, top 51%, 473 students, 100% FRL); Glenview Middle (math 38% / reading 45%, grade F, #68 of 229 statewide, top 31%, 733 students, 69% FRL); T. L. Hanna High (math 63% / reading 91%, grade A-, #28 of 196 statewide, top 16%, 1,910 students, 53% FRL) — zoned schools average 74% FRL vs 52% district-wide (22 pts higher); higher-poverty schools than district average — tighter screening recommended.
- Market conditions: Rents rising fast (+6.5%/yr); 685 active listings in the ZIP; 9 comparable units currently listed for rent nearby; rentals at typical pace (median 17d on market — plan ~3-4 weeks tenant-placement turnaround); 1,255 units permitted in Anderson County in 2024 (0 in 5+ unit buildings).
Forward outlook
- Local home prices are declining (-3.0%/yr); year-one equity from $1k of loan paydown is wiped out by about $6k of value loss. Plan a longer hold.
- Anderson County population projected at +14% by 2050 — modest demand growth; plan on rents tracking national, not racing it.
Negotiation context
- It's been on market 65 days — a 6% lower offer ($174k) is reasonable based on typical stale-listing flexibility.
- 5 sale attempts since 15y ago; this cycle's ask has dropped $30k (14%) from the opening price — seller is motivated, your offer sets the floor, not the list.
- Current owner paid $8k; list at $185k implies a 2211% gain — meaningful room to come down on a strong offer.
Risks & watch-outs
- Climate carrying-cost: extreme-heat days projected 7→17/yr by 2055 (HVAC capex compounding) — expect insurance premiums to compound above CPI over the hold.
Questions for the listing agent
- It's been on market 65 days. Have you received any prior offers? Is the seller open to a 23% concession, seller financing, or rate buy-down credit?
- Built in 1960 — when were the roof, HVAC, electrical panel, plumbing, and water heater last replaced?
- Why hasn't it sold? Are there any deal-killer items the seller is aware of (foundation, flood, title, zoning, code violations)?
- Is there a deadline driving the sale (1031 exchange, divorce, estate, relocation)? That informs how much negotiation room exists.
- Schools are D-rated, which usually means shorter tenancies and higher turnover. Who's the typical renter profile here, and what's been the actual vacancy rate?
- Crime grade is F in this area — have there been break-ins, vandalism, or insurance claims at this property in the last 3 years? What carrier currently insures it and at what premium?
- The area grade is low — what's the realistic commute time and amenity access for the typical tenant pool here? Any planned neighborhood developments (good or bad) we should know about?
- What's the average days-on-market for RENTAL listings here right now (not sales)? A rising rental-DOM trend means longer vacancies and softer asking-rent achievability than the comps imply.
- What's the recent tenant-quality profile in this submarket — average credit score on applications, eviction rate, late-payment / NSF rate, and stable-employment percentage? A property-management company in the area should have these aggregated.
- How much new for-sale + rental construction is in the pipeline within 1–3 miles? Heavy new supply typically softens prices + rents 12–24 months out; constrained supply supports both.
Investment metrics
- 1% rule
- 0.77% ✗
- Cap rate
- 6.49%
- Cash-on-cash
- 0.70%
- DSCR
- 1.03
- GRM
- 10.8
CMA / ARV
No comps found within radius.
Projected returns pro-forma
-3.0% appreciation · 6.55% rent growth · sell at horizon
- IRR
- -11.8%
- Equity multiple
- 0.56×
- Total profit
- $-22,831
- Equity at exit
- $27,569
- IRR
- 1.3%
- Equity multiple
- 1.11×
- Total profit
- $5,600
- Equity at exit
- $15,987
Cash invested: $51,772 (down + closing). Projections, not guarantees.
Landlord ↔ Tenant lean methodology
- Overall (STATE)
- 90 Strongly Landlord-Friendly
- State South Carolina
- 90 Strongly Landlord-Friendly · R+6
- County
- — inherits STATE
- City
- — inherits STATE
ZIP-level market 29621
- Rents YoY
- 6.5%
- Active inventory
- 685
- Price-to-rent
- 10.8×
Monthly cashflow live
- Estimated rent
- $1,430 high interval (Pro) →
- Mortgage (P&I)
- −$970
- Tax from tax record
- −$53 /mo · $635/yr
- Insurance
- −$77
- HOA
- −$0
- Vacancy / Maint / Mgmt
- −$300
- Net cashflow
- $30
Break-even live
Sensitivity live
| Price | -10% $135 | -5% $83 | +0% $30 | +5% $-22 | +10% $-74 |
|---|---|---|---|---|---|
| Rent | -10% $-83 | -5% $-26 | +0% $30 | +5% $87 | +10% $143 |
| Rate | -1.0pp $123 | -0.5pp $77 | base $30 | +0.5pp $-18 | +1.0pp $-66 |
UW: 25.0% down · 7.5% · 30yr · 1.5% tax · 5.0% vac · 8.0% maint · 8.0% mgmt
Financing live
Cash to close
- Down payment
- $46,225
- Closing costs
- $5,547
- Reserves months
- —
- Total cash needed
- —
Loan-product check · same deal, 3 products live
Conventional
25% down · 7.5% · 30yr
- Down + closing
- —
- Monthly P&I
- —
- Monthly cashflow
- —
- DSCR
- —
- Eligible?
- —
Personal DTI + credit; lowest rate.
DSCR
20% down · 8.5% · 30yr
- Down + closing
- —
- Monthly P&I
- —
- Monthly cashflow
- —
- DSCR
- —
- Eligible?
- —
No personal income docs; deal must DSCR.
Hard money
10% down · 12.0% · 12mo
- Down + closing
- —
- Monthly P&I
- —
- Monthly cashflow
- —
- DSCR
- —
- Eligible?
- —
Short-term bridge; refi at stabilization.
Rent comps 9 comps
| Address | Beds | Baths | Sqft | Rent | $/sqft | DOM | Units | Dist |
|---|---|---|---|---|---|---|---|---|
| 902 Pickens St Anderson, SC | 2.0 | 1.0 | 1185 | $1,195 | $1.01 | 25d | 1 | 0.25mi |
| 509 N Fant St Anderson, SC | 3.0 | 1.5 | 1500 | $1,450 | $0.97 | 23d | 1 | 0.98mi |
| 305 Cedar Rdg Anderson, SC | 3.0 | 2.5 | 1603 | $1,745 | $1.09 | 4d | 1 | 1.10mi |
| 611 Bonham Ct Unit A Anderson, SC | 2.0 | 1.0 | 963 | $1,150 | $1.19 | 25d | 1 | 1.11mi |
| 201 S Murray Ave Anderson, SC | 1.0–2.0 | 1.0–2.0 | 1010 | $2,200 | $2.18 | 4d | 1 | 1.13mi |
| 119 Woodland Dr Unit B Anderson, SC | 2.0 | 1.5 | 1100 | $895 | $0.81 | 25d | 1 | 1.19mi |
| 209 Polaris St Anderson, SC | 3.0 | 2.0 | 1500 | $1,500 | $1.00 | 12d | 1 | 1.20mi |
| 226 Islay WAY Anderson, SC | 3.0 | 2.5 | 1411 | $1,695 | $1.20 | 4d | 1 | 1.20mi |
| 1416 Hilltop Dr Anderson, SC | 3.0 | 2.0 | 1554 | $2,050 | $1.32 | 16d | 1 | 1.25mi |
Listing history 27 events
-
2026-06-21days on market $184,900 Active 65 DOM
-
2026-06-18days on market $184,900 Active 62 DOM
-
2026-06-17days on market $184,900 Active 61 DOM
-
2026-06-16days on market $184,900 Active 60 DOM
-
2026-06-15days on market $184,900 Active 59 DOM
-
2026-06-13days on market $184,900 Active 57 DOM
-
2026-06-10days on market $184,900 Active 54 DOM
-
2026-06-09days on market $184,900 Active 53 DOM
-
2026-06-08days on market $184,900 Active 52 DOM
-
2026-06-07days on market $184,900 Active 51 DOM
-
2026-06-05days on market $184,900 Active 48 DOM
-
2026-06-03days on market $184,900 Active 47 DOM
-
2026-06-03days on market $184,900 Active 46 DOM
-
2026-06-01days on market $184,900 Active 45 DOM
-
2026-05-31days on market $184,900 Active 44 DOM
-
2026-05-04price $184,900
-
2026-04-17$215,000 Active
-
2026-03-10price $215,000
-
2026-01-19price $219,000
-
2025-12-23$225,000 Active
-
2015-07-13soldstatus $8,000 SOLD-INNER OFFICE
-
2015-06-17status UNDER CONTRACT
-
2015-03-28$11,000 ACTIVE
-
2015-01-16historical
-
2014-01-15$12,000
-
2011-06-28soldstatus $8,000
-
2011-04-05$9,900
ⓘ Source: listings_history table (triggers on properties + properties_extension) + one-shot
backfill from property_details.listing_events for pre-trigger history.
Tax reassessment forecast SC · Resets to sale price
- Current annual tax
- $635 · $53/mo
- Projected year-2 tax
- $1,054 · $88/mo
- Expected delta
- +$419/yr (+$35/mo · 66.1%)
ⓘ Screening estimate from a state-policy table — verify with the county assessor before closing.
Climate risk First Street
- Flood 1/10 Low FEMA zone X (unshaded) · 0% chance over 30 yrs
- Wildfire 4/10 Moderate
- Heat 6/10 Major 7 d/yr ≥106°F today · 17 d/yr by 30 yrs out
- Wind 2/10 Low 4% chance of damaging wind over 30 yrs
- Air quality 4/10 Moderate 3 unhealthy d/yr today · 5 by 30 yrs out
Nearby sold comps map
Loading sold comps map…
Walkable amenities ~0.75 mi
Loading nearby amenities…
Taxation est. · year 1
- Rental income
- $17,162
- − Mortgage interest
- −$10,357
- − Property taxes
- −$635
- − Insurance
- −$924
- − Repairs & maintenance
- −$1,373
- − Management
- −$1,373
- − Depreciation
- −$5,379
- Taxable loss
- −$2,879
- Est. tax savings @ 24.0%
- +$691
- After-tax cash flow
- $1,054/yr
For passive investors: Depreciation is non-cash, so a rental often shows a tax loss while cash-flowing — sheltering income. Rental losses are passive: they offset passive income freely, and up to $25,000/yr can offset ordinary (W-2) income if you actively participate and your MAGI is under $100k (phasing out to $0 by $150k); unused losses carry forward. On sale, claimed depreciation is recaptured at up to 25%, and gains may owe capital-gains tax (a 1031 exchange can defer both). Figures are a year-1 estimate at your 24.0% rate — not tax advice; consult a CPA.
Schools (NCES district)
- District
- Anderson 05
- NCES district ID
- 4500900
- Math proficiency
- 44% ▼ -4.00%
- Reading proficiency
- 49% ▲ 2.00%
- Median HH income
- $39,718
- Composite
- 38.89/100
- National rank
- #4098
- State rank
- #20 of 80 in SC
Livability — Anderson
- Score
- 67/100
- State rank
- #98
- US rank
- #10772
Category grades
Schools grade is shown separately in the Schools card above.
Census & demographics
- Census place
- Anderson, SC
- County
- Anderson County · 99,076 people
- City population
- 87,992
- Metro
- Greenville-Anderson, SC
- Population (ZIP)
- 46,482
- Household income
- $74,256
- Rent vs Own
- Severe rent burden
- 1268.0
Population outlook (Anderson County) Hauer SSP2
- Today (2025)
- 210,546 people
- By 2030
- 217,791 · +3.4%
- By 2040
- 230,643 · +9.5%
- By 2050
- 240,220 · +14.1%
- By 2075
- 259,518 · +23.3%
- By 2100
- 258,696 · +22.9%
Race, ethnicity, and origin ACS 2023
- Neighborhood character
- Predominantly White (74%)
- Race & ethnicity
- White 74% Black 15% Two or more races 6% Hispanic / Latino 4% Asian 2%
- Common ancestry
- Serbian 3% Slovak 3% Romanian 3%
- Foreign-born
- 5% · Canada, China
- Languages at home
- 93% English-only · Spanish 3% Russian/Polish/Slavic 1% Other Indo-European 1%
Political lean MEDSL · Anderson
- 2024 margin
- Solid R (+47.4) · D 25.7% · R 73.1% · Other 1.2%
- 2008→2024 swing
- -14.1pp toward R · 2008: -33.3pp · 2024: -47.4pp
- All cycles
- 2024: R+47.4 2020: R+42.0 2016: R+43.7 2012: R+36.4 2008: R+33.3
Not yet ingested
- Civics
- —
Market trends
- HPI YoY
- ▼ -173.39%
- Current HPI
- 233.3422
- Rent YoY
- ▲ 6.55%
- Metro
- Greenville-Anderson, SC
- State GDP YoY
- ▲ 4.51%
- F500 in state
- 2
Industry mix (Fortune 500 HQ in SC)
| Industry | F500 HQs | Revenue |
|---|---|---|
| Packaging | 1 | $7B |
|
||
Price history
+1767.7% since first listed12 events — show timeline
- 2026-05-04 Price Changed $184,900 SPMLS
- 2026-04-17 Listed $215,000 SPMLS
- 2026-03-10 Price Changed $215,000 SPMLS
- 2026-01-19 Price Changed $219,000 SPMLS
- 2025-12-23 Listed $225,000 SPMLS
- 2015-07-13 Sold (MLS) $8,000 WUMLS
- 2015-06-17 Pending — WUMLS
- 2015-03-28 Listed $11,000 WUMLS
- 2015-01-16 Listing Removed — WUMLS
- 2014-01-15 Listed $12,000 WUMLS
- 2011-06-28 Sold (MLS) $8,000 WUMLS
- 2011-04-05 Listed $9,900 WUMLS
Property tax history
-3.1%/yrLatest (2025): $635 · +7.0% YoY. Source: county tax records.
Cash-flow waterfall
monthlySold comps — $/sqft
last 12 mo · ≤1 miLoading sold comps…