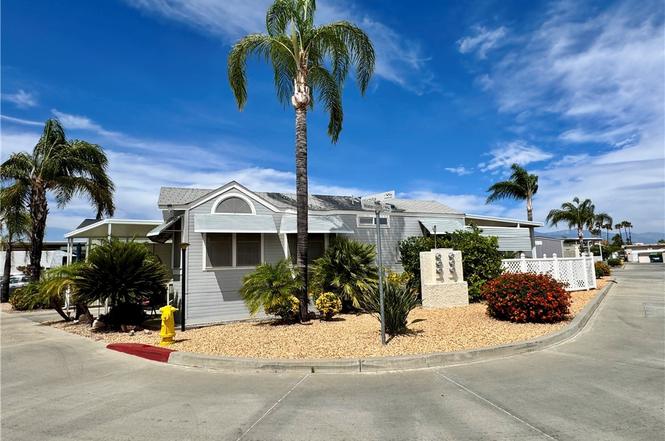
1295 S Cawston #443 · Hemet, CA
Flood risk 5/10 · Moderate
- FEMA flood zone
- X (shaded)
- Chance of flooding over 30 yrs
- 0.57%
- Est. flood insurance / yr
- $507 – $1,088
Fire risk 6/10 · Moderate
- Est. fire insurance / yr
- $659 – $1,223
Heat risk 7/10 · Major
- Hot days now (above 104°F)
- 6 days/yr
- Hot days in 30 yrs
- 17 days/yr
Wind risk 1/10 · Minimal
- Chance of severe wind over 30 yrs
- —
Air-quality risk 6/10 · Moderate
- Unhealthy air days now
- 9 days/yr
- Unhealthy air days in 30 yrs
- 11 days/yr
Risk factors via First Street. Map © Google.
Why this score? — see what drove the B grade
The composite is a weighted blend of 9 inputs, each scored 0–100. Each bar is that input's sub-score; the figure is the points it added to the 100-point composite (weight × sub-score).
- Cash flow +28.2/30.0
- ARV discount +15.0/15.0
- 1% rule +10.0/10.0
- DSCR +10.0/10.0
- Rent growth +3.4/5.0
- Livability +2.6/5.0
- Schools +2.5/10.0
- Condition / age +2.5/5.0
- Appreciation +0.0/10.0
$95,900
🖨 Deal sheet 📄 Offer letter ✓ Due diligence
Listing remarks
Welcome to Mountain Shadows Community! This approximately 480 sq. ft. furnished single-wide home offers a fantastic opportunity for a seasonal getaway, retirement retreat, or investment property. Featuring 1 bedroom and 1 bathroom, this cozy residence is move-in ready and designed for easy, low-maintenance living. Located in the heart of Hemet, Mountain Shadows offers an array of amenities including a pool, gym, tennis courts, and more. Enjoy convenient access to nearby shopping, dining, fishing, and outdoor recreation, all while being just a short drive to both Temecula Wine Country and Palm Springs. Whether you're looking for an affordable full-time residence, vacation home, or income-pro
Key facts
- Move-in ready
- Outdoor recreation
- Tennis courts
Tags
Property features AI
Finance
- Other: Estimated living area; Property is a single unit in the development; Parcel number 460033065
- HOA & community: Part of Mountain Shadows association; Monthly HOA fee of $292; Association amenities include pool and spa; Senior community; Community features: biking, street lighting
Exterior
- Parking: 2 garage spaces; 2 total parking spaces
- Utilities: Public/District water; Sewer or septic status unknown
- Home design: Planned development; Single-story; No shared/common walls
- Construction: Year built per assessor; No certified 433-A
- Exterior features: Manufactured house; Association pool; Association spa; Has a view; Lot density approximately 16–20 units per acre
Interior
- Bedrooms: 1 bedroom on the main level
- Bathrooms: 1 full bathroom
- Heating & cooling: Wall/window cooling
- Interior features: One-level home; All bedrooms on the main level; Entry on level 1; Has cooling (wall/window units)
- Laundry & utility: Laundry available; Outside location; Stackable washer/dryer (see remarks)
Neighborhood map
What this means for you Summary
Snapshot
- This is a 1-bed/1.0-bath manufactured listed at $96k.
Deal economics
- At list price, monthly cash flow is $304 ($4k/yr) — positive.
- The deal already cash-flows at list — no discount required.
- Meets the 1% rule at list price ($1k rent vs $96k).
- Cap rate 10.1% vs local median 4.9% in Hemet — top-decile yield for the area; either an underpriced asset or a hidden risk that comps aren't pricing in. Stress-test before assuming the spread holds.
Location & tenants
- Location reads 51/100 on livability (#1,056 in CA) — a working-class tenant base; expect higher turnover. Strengths: housing A+; Watch: crime D+, schools F, amenities F.
- Hemet Unified (suburban): math 19% / reading 41% proficiency, ranked #360 of 517 in CA (top 70%) — families likely to look elsewhere, expect single-tenant / working-renter base with shorter leases; 66% free/reduced lunch — lower-income household profile, screen leases tightly.
- Market conditions: Rents rising (+3.7%/yr); 290 active listings in the ZIP; 9,195 units permitted in Riverside County in 2024 (1,512 in 5+ unit buildings).
Forward outlook
- Local home prices are declining (-3.0%/yr); year-one equity from $663 of loan paydown is wiped out by about $3k of value loss. Plan a longer hold.
- Riverside County population projected at +22% by 2050 — long-run rental-demand tailwind backs the buy-and-hold thesis.
- At projected returns (-3.0% appreciation + 3.7% rent growth), your $27k cash investment doubles in ~8 years — after that, you're playing with house money.
Negotiation context
- Only 9 days on market — expect competitive offers; lowballing is unlikely to land.
- Current owner paid $20k; list at $96k implies a 380% gain — meaningful room to come down on a strong offer.
Risks & watch-outs
- Climate carrying-cost: moderate flood risk; major wildfire risk; extreme-heat days projected 6→17/yr by 2055 (HVAC capex compounding) — expect insurance premiums to compound above CPI over the hold.
Questions for the listing agent
- What does the HOA fee cover, when was the last increase, and are there any pending special assessments or reserve-fund shortfalls?
- Is there a deadline driving the sale (1031 exchange, divorce, estate, relocation)? That informs how much negotiation room exists.
- Schools are F-rated, which usually means shorter tenancies and higher turnover. Who's the typical renter profile here, and what's been the actual vacancy rate?
- Crime grade is D in this area — have there been break-ins, vandalism, or insurance claims at this property in the last 3 years? What carrier currently insures it and at what premium?
- What's the average days-on-market for RENTAL listings here right now (not sales)? A rising rental-DOM trend means longer vacancies and softer asking-rent achievability than the comps imply.
- What's the recent tenant-quality profile in this submarket — average credit score on applications, eviction rate, late-payment / NSF rate, and stable-employment percentage? A property-management company in the area should have these aggregated.
- How much new for-sale + rental construction is in the pipeline within 1–3 miles? Heavy new supply typically softens prices + rents 12–24 months out; constrained supply supports both.
Investment metrics
- 1% rule
- 1.55% ✓
- Cap rate
- 10.09%
- Cash-on-cash
- 13.58%
- DSCR
- 1.60
- GRM
- 5.4
CMA / ARV
- ARV (on-the-fly)
- $115,500
- Comps found
- 12
Show comp detail 12 sales within ~0.75 mi
| Address | Dist | Beds/Ba | Sqft | Sold | Price | $/sf | Match |
|---|---|---|---|---|---|---|---|
| 1295 S Cawston Ave #433 | 0.00mi | 1/1.0 | 420 (0%) | 6mo | $119,100 | $284 | 95 |
| 1295 S Cawston Ave #359 | 0.00mi | 1/1.0 | 400 (-5%) | 0mo | $75,000 | $188 | 92 |
| 1295 S Cawston #319 | 0.00mi | 1/1.0 | 400 (-5%) | 7mo | $79,500 | $199 | 86 |
| 1295 S Cawston Ave #249 | 0.06mi | 1/1.0 | 400 (-5%) | 5mo | $110,000 | $275 | 85 |
| 1295 S Cawston #271 | 0.07mi | 1/1.0 | 400 (-5%) | 5mo | $115,000 | $288 | 85 |
| 1295 S Cawston Ave #378 | 0.00mi | 1/1.0 | 400 (-5%) | 9mo | $95,000 | $238 | 85 |
| 1295 Cawston #124 | 0.00mi | 1/1.0 | 400 (-5%) | 13mo | $125,500 | $314 | 81 |
| 1295 S Cawston Ave #236 | 0.00mi | 1/1.0 | 400 (-5%) | 14mo | $70,000 | $175 | 80 |
| 1295 S Cawston Ave #82 | 0.08mi | 1/1.0 | 400 (-5%) | 11mo | $115,000 | $288 | 79 |
| 1295 S Cawston Ave #503 | 0.00mi | 1/1.0 | 460 (+10%) | 8mo | $94,000 | $204 | 78 |
| 1295 S Cawston Ave #297 | 0.11mi | 1/1.5 | 400 (-5%) | 9mo | $135,000 | $338 | 77 |
| 1295 S Cawston Ave #344 | 0.00mi | 1/1.0 | 480 (+14%) | 5mo | $55,000 | $115 | 72 |
Match score weights: distance 35% · size 25% · config 20% · recency 20%. Top-matched comps best support the ARV.
Projected returns pro-forma
-3.0% appreciation · 3.74% rent growth · sell at horizon
- IRR
- 4.8%
- Equity multiple
- 1.19×
- Total profit
- $5,075
- Equity at exit
- $14,299
- IRR
- 15.2%
- Equity multiple
- 2.29×
- Total profit
- $34,589
- Equity at exit
- $8,292
Cash invested: $26,852 (down + closing). Projections, not guarantees.
Landlord ↔ Tenant lean methodology
- Overall (STATE)
- 18 Strongly Tenant-Friendly
- State California
- 18 Strongly Tenant-Friendly · D+13
- County
- — inherits STATE
- City
- — inherits STATE
ZIP-level market 92545
- Home prices YoY
- -24.6%
- Rents YoY
- 3.7%
- Active inventory
- 290
- Price-to-rent
- 5.4×
Monthly cashflow live
- Estimated rent
- $1,486 medium interval (Pro) →
- Mortgage (P&I)
- −$503
- Tax from tax record
- −$36 /mo · $427/yr
- Insurance
- −$40
- HOA
- −$292
- Vacancy / Maint / Mgmt
- −$312
- Net cashflow
- $304
Break-even live
UW: 25.0% down · 7.5% · 30yr · 1.5% tax · 5.0% vac · 8.0% maint · 8.0% mgmt
Financing live
Cash to close
- Down payment
- $23,975
- Closing costs
- $2,877
- Reserves months
- —
- Total cash needed
- —
Loan-product check · same deal, 3 products live
Conventional
25% down · 7.5% · 30yr
- Down + closing
- —
- Monthly P&I
- —
- Monthly cashflow
- —
- DSCR
- —
- Eligible?
- —
Personal DTI + credit; lowest rate.
DSCR
20% down · 8.5% · 30yr
- Down + closing
- —
- Monthly P&I
- —
- Monthly cashflow
- —
- DSCR
- —
- Eligible?
- —
No personal income docs; deal must DSCR.
Hard money
10% down · 12.0% · 12mo
- Down + closing
- —
- Monthly P&I
- —
- Monthly cashflow
- —
- DSCR
- —
- Eligible?
- —
Short-term bridge; refi at stabilization.
HOA detail
- Monthly dues
- $292 · $3,504/yr
- Likely covers
- poolgym
Listing history 5 events
-
2026-06-18days on market $95,900 Active 9 DOM
-
2026-06-17days on market $95,900 Active 8 DOM
-
2026-06-16days on market $95,900 Active 7 DOM
-
2026-06-15remarks 699-char remark
-
2026-06-15$95,900 Active 6 DOM
ⓘ Source: listings_history table (triggers on properties + properties_extension) + one-shot
backfill from property_details.listing_events for pre-trigger history.
Tax reassessment forecast CA · Resets to sale price
- Current annual tax
- $427 · $36/mo
- Projected year-2 tax
- $729 · $61/mo
- Expected delta
- +$302/yr (+$25/mo · 70.7%)
ⓘ Screening estimate from a state-policy table — verify with the county assessor before closing.
Climate risk First Street
- Flood 5/10 Major FEMA zone X (shaded) · 57% chance over 30 yrs
- Wildfire 6/10 Major
- Heat 7/10 Severe 6 d/yr ≥104°F today · 17 d/yr by 30 yrs out
- Wind 1/10 Low
- Air quality 6/10 Major 9 unhealthy d/yr today · 11 by 30 yrs out
Nearby sold comps map
Loading sold comps map…
Walkable amenities ~0.75 mi
Loading nearby amenities…
Taxation est. · year 1
- Rental income
- $17,837
- − Mortgage interest
- −$5,372
- − Property taxes
- −$427
- − Insurance
- −$480
- − Repairs & maintenance
- −$1,427
- − Management
- −$1,427
- − HOA
- −$3,504
- − Depreciation
- −$2,790
- Taxable income
- $2,411
- Est. tax owed @ 24.0%
- −$579
- After-tax cash flow
- $3,067/yr
For passive investors: Depreciation is non-cash, so a rental often shows a tax loss while cash-flowing — sheltering income. Rental losses are passive: they offset passive income freely, and up to $25,000/yr can offset ordinary (W-2) income if you actively participate and your MAGI is under $100k (phasing out to $0 by $150k); unused losses carry forward. On sale, claimed depreciation is recaptured at up to 25%, and gains may owe capital-gains tax (a 1031 exchange can defer both). Figures are a year-1 estimate at your 24.0% rate — not tax advice; consult a CPA.
Schools (NCES district)
- District
- Hemet Unified
- NCES district ID
- 0616920
- Math proficiency
- 19% ▼ -3.00%
- Reading proficiency
- 41% ▲ 4.00%
- Median HH income
- $39,962
- Composite
- 25.16/100
- National rank
- #7517
- State rank
- #360 of 517 in CA
Livability — Hemet
- Score
- 51/100
- State rank
- #1056
- US rank
- #25208
Category grades
Schools grade is shown separately in the Schools card above.
Census & demographics
- Census place
- Hemet, CA
- County
- Riverside County · 2,287,001 people
- City population
- 137,670
- Metro
- Riverside-San Bernardino-Ontario, CA
- Population (ZIP)
- 45,982
- Household income
- $63,770
- Rent vs Own
- Severe rent burden
- 1813.0
Population outlook (Riverside County) Hauer SSP2
- Today (2025)
- 2,664,475 people
- By 2030
- 2,802,692 · +5.2%
- By 2040
- 3,050,904 · +14.5%
- By 2050
- 3,256,783 · +22.2%
- By 2075
- 3,655,058 · +37.2%
- By 2100
- 3,766,594 · +41.4%
Race, ethnicity, and origin ACS 2023
- Neighborhood character
- Diverse neighborhood (Simpson 0.65)
- Race & ethnicity
- Hispanic / Latino 46% White 35% Two or more races 17% Black 8% Asian 5% Native American 1%
- Hispanic origin (detail)
- Mexican 40%
- Common ancestry
- Slovak 2% Lithuanian 2% Portuguese 1%
- Foreign-born
- 19% · Canada, Vietnam, Jamaica
- Languages at home
- 69% English-only · Spanish 27% Tagalog/Filipino 1% Other Indo-European 1%
Political lean MEDSL · Riverside
- 2024 margin
- Toss-up / Even · D 48.0% · R 49.3% · Other 2.6%
- 2008→2024 swing
- -3.6pp toward R · 2008: 2.3pp · 2024: -1.3pp
- All cycles
- 2024: R+1.3 2020: D+8.0 2016: D+4.3 2012: R+0.4 2008: D+2.3
Not yet ingested
- Civics
- —
Market trends
- HPI YoY
- ▼ -116.25%
- Current HPI
- 356.9414
- Rent YoY
- ▲ 3.74%
- Metro
- Riverside-San Bernardino-Ontario, CA
- State GDP YoY
- ▲ 3.21%
- F500 in state
- 116
Industry mix (Fortune 500 HQ in CA)
| Industry | F500 HQs | Revenue |
|---|---|---|
| Technology | 27 | $1,492B |
|
||
| Financial Services | 3 | $174B |
|
||
| Retail | 3 | $44B |
|
||
| Insurance | 3 | $26B |
|
||
| Media / Entertainment | 2 | $115B |
|
||
| Pharmaceuticals / Biotech | 2 | $62B |
|
||
Price history
+813.3% since first listed4 events — show timeline
- 2026-06-09 Listed $95,900 CRMLS
- 2016-12-16 Sold (Public Records) $20,000 Public Records
- 2010-08-19 Sold (Public Records) $35,000 Public Records
- 1999-02-04 Sold (Public Records) $10,500 Public Records
Property tax history
+15.0%/yrLatest (2014): $427 · -3.3% YoY. Source: county tax records.
Cash-flow waterfall
monthlySold comps — $/sqft
last 12 mo · ≤1 miLoading sold comps…