 🔨 Auction
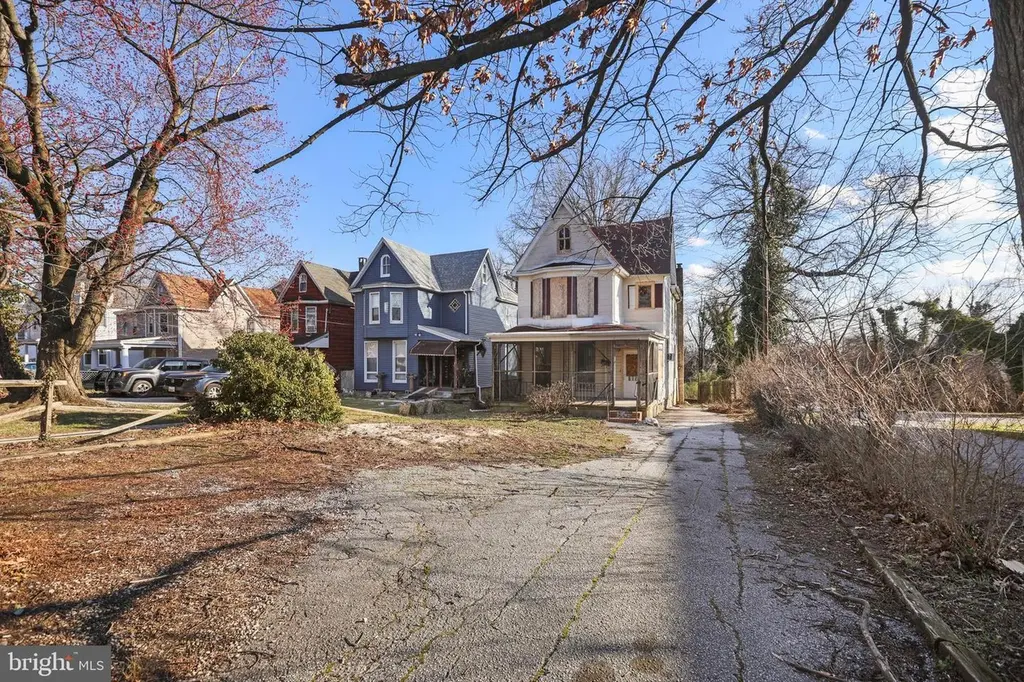
705 Woodbourne Ave · Baltimore, MD
Flood risk 1/10 · Minimal
- FEMA flood zone
- X (unshaded)
- Chance of flooding over 30 yrs
- 0.0%
- Est. flood insurance / yr
- $473 – $860
Fire risk 1/10 · Minimal
- Est. fire insurance / yr
- $755 – $1,403
Heat risk 6/10 · Moderate
- Hot days now (above 103°F)
- 7 days/yr
- Hot days in 30 yrs
- 14 days/yr
Wind risk 6/10 · Moderate
- Chance of severe wind over 30 yrs
- 27.0%
Air-quality risk 4/10 · Minor
- Unhealthy air days now
- 3 days/yr
- Unhealthy air days in 30 yrs
- 6 days/yr
Risk factors via First Street. Map © Google.
Why this score? — see what drove the F grade
The composite is a weighted blend of 9 inputs, each scored 0–100. Each bar is that input's sub-score; the figure is the points it added to the 100-point composite (weight × sub-score).
- ARV discount +7.5/15.0
- Cash flow +7.0/30.0
- Livability +3.8/5.0
- Rent growth +3.7/5.0
- Condition / age +2.5/5.0
- 1% rule +1.3/10.0
- DSCR +1.2/10.0
- Schools +1.0/10.0
- Appreciation +0.0/10.0
$70,000
🖨 Deal sheet 📄 Offer letter ✓ Due diligence
Listing remarks MLS
ONLINE AUCTION: This auction takes place on the Ashland Auction Group Website Bidding Platform. Bidding begins 5/29/2026 @ 10:00 AM. Bidding ends 6/2/2026 @ 12:10 PM. List Price is Suggested Opening Bid. Deposit: $15,000. Discover incredible potential in this expansive 2,800 SF residence. Boasting over 1,900 SF of above-grade living space plus a 900 SF basement, this vacant property is a blank canvas ready for your vision. The versatile layout allows for a modern open-concept first floor featuring a chef’s kitchen with a breakfast island, a formal dining room, and a living area. Ideally configured for multi-generational living, the home can accommodate a first-floor in-law suite with a full bath, plus three additional bedrooms and a full bath upstairs. Just minutes from the Woodbourne and York Road commercial districts and easy access to the York Road corridor. Ample parking for up to 4 vehicles.
Key facts
- Breakfast island
- Formal dining room
- Ample parking
Tags
Neighborhood map
What this means for you Summary
Snapshot
- This is a 3-bed/1.0-bath single-family listed at $70k.
Deal economics
- At list price, monthly cash flow is $-479 ($-6k/yr) — negative.
- The deal already cash-flows at list — no discount required.
- Meets the 1% rule at list price ($2k rent vs $70k).
- Recommended offer: $68k (3.0% below list) — sets the bar for market timing.
- Cap rate 4.5% vs local median 6.0% in Baltimore — below-typical yield; the buyer is paying a premium for something (appreciation thesis, condition, location) that the cap rate doesn't capture.
Location & tenants
- Location reads 76/100 on livability (#90 in MD, #3,396 nationally) — a middle-class / working-renter tenant base. Strengths: amenities A+, commute A+, housing A+; Watch: schools D, crime F.
- Baltimore City Public Schools (urban): math 7% / reading 16% proficiency, ranked #24 of 24 in MD (top 100%) — low school quality limits family demand, transient renter base, plan for 1-2y turnover; 79% free/reduced lunch — lower-income household profile, screen leases tightly.
- Market conditions: Rents rising fast (+4.7%/yr); 133 active listings in the ZIP; 36 comparable units currently listed for rent nearby; rentals at typical pace (median 24d on market — plan ~3-4 weeks tenant-placement turnaround); solid renter incomes; 1,273 units permitted in Baltimore city in 2024 (1,104 in 5+ unit buildings).
Forward outlook
- Local home prices are declining (-3.0%/yr); year-one equity from $2k of loan paydown is wiped out by about $10k of value loss. Plan a longer hold.
- Baltimore County population projected to shrink 4% by 2050 — rents likely to lag national; underwrite the cash flow, not the appreciation.
Negotiation context
- It's been on market 57 days — a 3% lower offer ($68k) is reasonable based on typical stale-listing flexibility.
- 9 sale attempts since 4y ago; this cycle's ask has dropped $20k (22%) from the opening price — seller is motivated, your offer sets the floor, not the list.
Risks & watch-outs
- Watch-outs: property tax is 4.5% of price; built in 1910 — expect roof / HVAC / electrical / plumbing capex.
- Climate carrying-cost: major wind risk, 27% chance of damaging wind over 30y; extreme-heat days projected 7→14/yr by 2055 (HVAC capex compounding) — expect insurance premiums to compound above CPI over the hold.
Questions for the listing agent
- What do current leases actually rent for vs. the listed asking? Can we see a recent rent roll and the last 12 months of T-12 income?
- It's been on market 57 days. Have you received any prior offers? Is the seller open to a 3% concession, seller financing, or rate buy-down credit?
- Built in 1910 — when were the roof, HVAC, electrical panel, plumbing, and water heater last replaced?
- Property tax is high relative to price — has the assessment been appealed recently, and will the sale trigger a re-assessment?
- Is there a deadline driving the sale (1031 exchange, divorce, estate, relocation)? That informs how much negotiation room exists.
- Schools are D-rated, which usually means shorter tenancies and higher turnover. Who's the typical renter profile here, and what's been the actual vacancy rate?
- Crime grade is F in this area — have there been break-ins, vandalism, or insurance claims at this property in the last 3 years? What carrier currently insures it and at what premium?
- The area grade is low — what's the realistic commute time and amenity access for the typical tenant pool here? Any planned neighborhood developments (good or bad) we should know about?
- What's the average days-on-market for RENTAL listings here right now (not sales)? A rising rental-DOM trend means longer vacancies and softer asking-rent achievability than the comps imply.
- What's the recent tenant-quality profile in this submarket — average credit score on applications, eviction rate, late-payment / NSF rate, and stable-employment percentage? A property-management company in the area should have these aggregated.
- How much new for-sale + rental construction is in the pipeline within 1–3 miles? Heavy new supply typically softens prices + rents 12–24 months out; constrained supply supports both.
Investment metrics
- 1% rule
- 0.63% ✗
- Cap rate
- 4.51%
- Cash-on-cash
- -6.37%
- DSCR
- 0.72
- GRM
- 13.2
CMA / ARV
- ARV (median comp)
- $322,751
- List price
- $70,000
- Delta
- -78.31%
- Verdict
- UNDERPRICED
- Comps
- 20 within 1.0 mi
Show comp detail 12 sales within ~0.75 mi
| Address | Dist | Beds/Ba | Sqft | Sold | Price | $/sf | Match |
|---|---|---|---|---|---|---|---|
| 310 Thornhill Rd | 0.47mi | 3/2.0 | 1,892 (-1%) | 1mo | $660,000 | $349 | 72 |
| 5302 Saint Georges Ave | 0.28mi | 3/3.0 | 1,840 (-4%) | 3mo | $180,000 | $98 | 70 |
| 5802 Clearspring Rd | 0.42mi | 3/2.0 | 1,962 (+3%) | 2mo | $316,000 | $161 | 70 |
| 5306 Kenilworth Ave | 0.36mi | 3/2.5 | 1,857 (-3%) | 5mo | $340,000 | $183 | 69 |
| 325 Broadmoor Rd | 0.39mi | 3/3.0 | 1,850 (-3%) | 0mo | $580,000 | $314 | 68 |
| 311 Woodbourne Ave | 0.26mi | 3/2.0 | 1,732 (-9%) | 5mo | $343,000 | $198 | 64 |
| 442 Rosebank Ave | 0.64mi | 3/2.0 | 1,930 (+1%) | 3mo | $275,000 | $142 | 62 |
| 5315 Midwood Ave | 0.23mi | 4/3.0 (+1) | 2,070 (+8%) | 1mo | $359,900 | $174 | 62 |
| 328 Paddington Rd | 0.34mi | 3/1.5 | 1,660 (-13%) | 2mo | $394,000 | $237 | 59 |
| 828 E Belvedere Ave | 0.53mi | 3/2.0 | 1,674 (-12%) | 0mo | $290,000 | $173 | 51 |
| 610 Saint Dunstans Rd | 0.43mi | 3/1.5 | 1,640 (-14%) | 7mo | $330,000 | $201 | 48 |
| 5728 Govane Ave | 0.37mi | 4/2.0 (+1) | 1,624 (-15%) | 2mo | $247,000 | $152 | 47 |
Match score weights: distance 35% · size 25% · config 20% · recency 20%. Top-matched comps best support the ARV.
Projected returns pro-forma
-3.0% appreciation · 4.65% rent growth · sell at horizon
- IRR
- -25.6%
- Equity multiple
- 0.12×
- Total profit
- $-79,451
- Equity at exit
- $48,123
- IRR
- -18.0%
- Equity multiple
- -0.04×
- Total profit
- $-94,137
- Equity at exit
- $27,906
Cash invested: $90,370 (down + closing). Projections, not guarantees.
Landlord ↔ Tenant lean methodology
- Overall (CITY)
- 12 Strongly Tenant-Friendly
- State Maryland
- 27 Tenant-Leaning · D+14
- County
- — inherits STATE
- City Baltimore
- 12 Strongly Tenant-Friendly · D+58
ZIP-level market 21212
- Rents YoY
- 4.7%
- Active inventory
- 133
- Price-to-rent
- 2.9×
Monthly cashflow live
- Estimated rent
- $2,038 high interval (Pro) →
- Mortgage (P&I)
- −$1,693
- Tax from tax record
- −$262 /mo · $3,145/yr
- Insurance
- −$134
- HOA
- −$0
- Vacancy / Maint / Mgmt
- −$428
- Net cashflow
- $-479
Break-even live
UW: 25.0% down · 7.5% · 30yr · 1.5% tax · 5.0% vac · 8.0% maint · 8.0% mgmt
Financing live
Cash to close
- Down payment
- $80,688
- Closing costs
- $9,683
- Reserves months
- —
- Total cash needed
- —
Loan-product check · same deal, 3 products live
Conventional
25% down · 7.5% · 30yr
- Down + closing
- —
- Monthly P&I
- —
- Monthly cashflow
- —
- DSCR
- —
- Eligible?
- —
Personal DTI + credit; lowest rate.
DSCR
20% down · 8.5% · 30yr
- Down + closing
- —
- Monthly P&I
- —
- Monthly cashflow
- —
- DSCR
- —
- Eligible?
- —
No personal income docs; deal must DSCR.
Hard money
10% down · 12.0% · 12mo
- Down + closing
- —
- Monthly P&I
- —
- Monthly cashflow
- —
- DSCR
- —
- Eligible?
- —
Short-term bridge; refi at stabilization.
Rent comps 36 comps
| Address | Beds | Baths | Sqft | Rent | $/sqft | DOM | Units | Dist |
|---|---|---|---|---|---|---|---|---|
| 620 Harwood Ave Baltimore, MD | 2.0 | 1.0 | 2056 | $1,350 | $0.66 | 44d | 1 | 0.20mi |
| 1008 Tunbridge Rd Baltimore, MD | 3.0 | 2.0 | 1732 | $2,050 | $1.18 | 24d | 1 | 0.32mi |
| 5622 Midwood Ave Baltimore, MD | 3.0 | 2.0 | 1452 | $2,300 | $1.58 | 44d | 1 | 0.35mi |
| 5626 Midwood Ave Unit 2 Baltimore, MD | 2.0 | 1.0 | 1452 | $1,100 | $0.76 | 24d | 1 | 0.36mi |
| 510 Winston Ave Baltimore, MD | 4.0 | 2.0 | 1600 | $2,800 | $1.75 | 20d | 1 | 0.36mi |
| 828 Saint Dunstans Rd Baltimore, MD | 3.0 | 2.0 | 1544 | $2,000 | $1.30 | 24d | 1 | 0.41mi |
| 1221 Glenwood Ave Baltimore, MD | 3.0 | 2.0 | 1390 | $2,595 | $1.87 | 44d | 1 | 0.49mi |
| 514 Radnor Ave Baltimore, MD | 3.0 | 1.5 | 1575 | $1,500 | $0.95 | 44d | 1 | 0.50mi |
| 804 Radnor Ave Baltimore, MD | 3.0 | 1.0 | 1654 | $2,000 | $1.21 | 44d | 1 | 0.53mi |
| 1224 Winston Ave Baltimore, MD | 3.0 | 2.0 | 1248 | $2,100 | $1.68 | 18d | 1 | 0.58mi |
| 4754 Alhambra Ave Baltimore, MD | 3.0 | 2.0 | 1876 | $1,500 | $0.80 | 24d | 1 | 0.60mi |
| 5204 Kelway Rd Baltimore, MD | 3.0 | 2.0 | 1666 | $2,350 | $1.41 | 24d | 1 | 0.68mi |
| 5520 Sagra Rd Baltimore, MD | 3.0 | 1.5 | 1650 | $1,900 | $1.15 | 44d | 1 | 0.71mi |
| 531 Willow Ave Unit Na Baltimore, MD | 4.0 | 1.0 | 1300 | $1,800 | $1.38 | 20d | 1 | 0.72mi |
| 4407 Old York Rd Baltimore, MD | 3.0 | 1.5 | 1356 | $1,574 | $1.16 | 44d | 1 | 0.78mi |
| 4407 Old York Rd Baltimore, MD | 3.0 | 1.5 | 1356 | $1,574 | $1.16 | 20d | 1 | 0.78mi |
| 6008 Clearspring Rd Baltimore, MD | 4.0 | 2.5 | 1758 | $3,600 | $2.05 | 24d | 1 | 0.80mi |
| 1111 Gleneagle Rd Unit 2 Baltimore, MD | 2.0 | 1.0 | 1452 | $1,050 | $0.72 | 44d | 1 | 0.82mi |
| 706 E 43rd St Baltimore, MD | 4.0 | 1.5 | 1596 | $1,899 | $1.19 | 2d | 1 | 0.89mi |
| 4303 York Rd #3 Baltimore, MD | 2.0 | 1.0 | 1680 | $1,400 | $0.83 | 44d | 1 | 0.97mi |
| 6159 Parkway Dr Apt 1 Baltimore, MD | 4.0 | 2.0 | 1408 | $2,200 | $1.56 | 24d | 1 | 1.01mi |
| 6159 Parkway Dr Baltimore, MD | 4.0 | 2.0 | 1408 | $2,200 | $1.56 | 22d | 1 | 1.01mi |
| 1545 E Cold Spring Ln Baltimore, MD | 4.0 | 2.0 | 1240 | $2,000 | $1.61 | 44d | 1 | 1.08mi |
| 6189 Northwood Dr Baltimore, MD | 4.0 | 2.0 | 1400 | $2,200 | $1.57 | 44d | 1 | 1.09mi |
| 513 E 41st St Baltimore, MD | 4.0 | 1.5 | 1620 | $1,900 | $1.17 | 44d | 1 | 1.09mi |
| 6149 Dunroming Rd Baltimore, MD | 3.0 | 1.5 | 1400 | $1,895 | $1.35 | 11d | 1 | 1.10mi |
| 100 E Melrose Ave Baltimore, MD | 2.0–3.0 | 2.0–2.5 | 1750 | $3,345 | $1.91 | 4d | 2 | 1.12mi |
| 4033 Greenmount Ave Baltimore, MD | 2.0 | 2.5 | 1860 | $2,550 | $1.37 | 24d | 1 | 1.12mi |
| 1508 Gleneagle Rd Baltimore, MD | 3.0 | 2.0 | 1824 | $2,180 | $1.20 | 4d | 1 | 1.18mi |
| 1804 Winford Rd Baltimore, MD | 3.0 | 1.5 | 1600 | $2,100 | $1.31 | 24d | 1 | 1.26mi |
| 4006 Loch Raven Blvd Baltimore, MD | 3.0 | 2.5 | 2016 | $2,695 | $1.34 | 18d | 1 | 1.30mi |
| 1539 Ralworth Rd Baltimore, MD | 3.0 | 2.0 | 1580 | $1,950 | $1.23 | 15d | 1 | 1.33mi |
| 1908 E Belvedere Ave Baltimore, MD | 4.0 | 2.0 | 1425 | $1,950 | $1.37 | 20d | 1 | 1.42mi |
| 1646 Wadsworth Way Baltimore, MD | 3.0 | 1.0 | 1520 | $2,100 | $1.38 | 11d | 1 | 1.43mi |
| 1444 Meridene Dr Baltimore, MD | 3.0 | 1.5 | 1520 | $1,950 | $1.28 | 44d | 1 | 1.43mi |
| 2028 Hillenwood Rd Baltimore, MD | 4.0 | 2.0 | 1820 | $2,100 | $1.15 | 22d | 1 | 1.44mi |
Listing history 36 events
-
2026-06-18days on market $70,000 Active 57 DOM
-
2026-06-17pricedays on market $70,000 Active 56 DOM
-
2026-06-16days on market $90,000 Active 55 DOM
-
2026-06-15days on market $90,000 Active 54 DOM
-
2026-06-13days on market $90,000 Active 52 DOM
-
2026-06-09days on market $90,000 Active 48 DOM
-
2026-06-08days on market $90,000 Active 47 DOM
-
2026-06-07days on market $90,000 Active 46 DOM
-
2026-06-04days on market $90,000 Active 43 DOM
-
2026-06-03days on market $90,000 Active 42 DOM
-
2026-06-02days on market $90,000 Active 41 DOM
-
2026-06-01days on market $90,000 Active 40 DOM
-
2026-05-31days on market $90,000 Active 39 DOM
-
2026-04-22$90,000 Active 915-char remark
Show marketing remark (915 chars)
ONLINE AUCTION: This auction takes place on the Ashland Auction Group Website Bidding Platform. Bidding begins 5/29/2026 @ 10:00 AM. Bidding ends 6/2/2026 @ 12:10 PM. List Price is Suggested Opening Bid. Deposit: $15,000. Discover incredible potential in this expansive 2,800 SF residence. Boasting over 1,900 SF of above-grade living space plus a 900 SF basement, this vacant property is a blank canvas ready for your vision. The versatile layout allows for a modern open-concept first floor featuring a chef’s kitchen with a breakfast island, a formal dining room, and a living area. Ideally configured for multi-generational living, the home can accommodate a first-floor in-law suite with a full bath, plus three additional bedrooms and a full bath upstairs. Just minutes from the Woodbourne and York Road commercial districts and easy access to the York Road corridor. Ample parking for up to 4 vehicles.
-
2026-04-10soldstatus $75,000 Closed 195-char remark
Show marketing remark (195 chars)
Single Family Home located in Woodbourne-McCabe community features 3 BD, 1.5 Bathroom. Large Living/Ding Room combo with Fireplace. Kitchen with space for table and sliding door to the back yard.
-
2026-03-10historical 195-char remark
Show marketing remark (195 chars)
Single Family Home located in Woodbourne-McCabe community features 3 BD, 1.5 Bathroom. Large Living/Ding Room combo with Fireplace. Kitchen with space for table and sliding door to the back yard.
-
2026-03-10$74,900 195-char remark
Show marketing remark (195 chars)
Single Family Home located in Woodbourne-McCabe community features 3 BD, 1.5 Bathroom. Large Living/Ding Room combo with Fireplace. Kitchen with space for table and sliding door to the back yard.
-
2025-04-11status Pending
-
2025-04-11historical
-
2025-04-02status Active
-
2025-03-25status Pending
-
2025-03-12$127,310 Active
-
2023-10-09historical
-
2023-07-26status Active
-
2023-06-18historical Active Under Contract
-
2023-05-31status Active
-
2023-05-11historical Active Under Contract
-
2023-04-21status Active
-
2023-04-09status Pending
-
2023-03-27status Active
-
2023-03-04status Pending
-
2023-02-23historical Active Under Contract
-
2022-10-20$239,900 Active
-
2006-04-14soldstatus $105,698
-
2003-03-12soldstatus $65,000
-
1988-06-21soldstatus $43,000
ⓘ Source: listings_history table (triggers on properties + properties_extension) + one-shot
backfill from property_details.listing_events for pre-trigger history.
Tax reassessment forecast MD · Partial reset (capped growth)
- Current annual tax
- $3,145 · $262/mo
- Projected year-2 tax
- $3,145 · $262/mo
- Expected delta
- $0/yr ($0/mo · 0.0%)
ⓘ Screening estimate from a state-policy table — verify with the county assessor before closing.
Climate risk First Street
- Flood 1/10 Low FEMA zone X (unshaded) · 0% chance over 30 yrs
- Wildfire 1/10 Low
- Heat 6/10 Major 7 d/yr ≥103°F today · 14 d/yr by 30 yrs out
- Wind 6/10 Major 27% chance of damaging wind over 30 yrs
- Air quality 4/10 Moderate 3 unhealthy d/yr today · 6 by 30 yrs out
Nearby sold comps map
Loading sold comps map…
Walkable amenities ~0.75 mi
Loading nearby amenities…
Taxation est. · year 1
- Rental income
- $24,451
- − Mortgage interest
- −$18,079
- − Property taxes
- −$3,145
- − Insurance
- −$1,614
- − Repairs & maintenance
- −$1,956
- − Management
- −$1,956
- − Depreciation
- −$9,389
- Taxable loss
- −$11,688
- Est. tax savings @ 24.0%
- +$2,805
- After-tax cash flow
- $-2,948/yr
For passive investors: Depreciation is non-cash, so a rental often shows a tax loss while cash-flowing — sheltering income. Rental losses are passive: they offset passive income freely, and up to $25,000/yr can offset ordinary (W-2) income if you actively participate and your MAGI is under $100k (phasing out to $0 by $150k); unused losses carry forward. On sale, claimed depreciation is recaptured at up to 25%, and gains may owe capital-gains tax (a 1031 exchange can defer both). Figures are a year-1 estimate at your 24.0% rate — not tax advice; consult a CPA.
Schools (NCES district)
- District
- Baltimore City Public Schools
- NCES district ID
- 2400090
- Math proficiency
- 7% ▼ -9.00%
- Reading proficiency
- 16% ▼ -5.00%
- Median HH income
- $42,108
- Composite
- 10.08/100
- National rank
- #9805
- State rank
- #24 of 24 in MD
Livability — Baltimore
- Score
- 76/100
- State rank
- #90
- US rank
- #3396
Category grades
Schools grade is shown separately in the Schools card above.
Census & demographics
- Census place
- Baltimore, MD
- County
- Baltimore City · 558,601 people
- City population
- 588,727
- Metro
- Baltimore-Columbia-Towson, MD
- Population (ZIP)
- 33,974
- Household income
- $96,685
- Rent vs Own
- Severe rent burden
- 769.0
Population outlook (Baltimore County) Hauer SSP2
- Today (2025)
- 624,249 people
- By 2030
- 621,541 · -0.4%
- By 2040
- 609,756 · -2.3%
- By 2050
- 597,249 · -4.3%
- By 2075
- 552,236 · -11.5%
- By 2100
- 513,934 · -17.7%
Race, ethnicity, and origin ACS 2023
- Neighborhood character
- Diverse neighborhood (Simpson 0.64)
- Race & ethnicity
- White 49% Black 35% Two or more races 9% Hispanic / Latino 7% Asian 4%
- Hispanic origin (detail)
- Mexican 1% Puerto Rican 1%
- Common ancestry
- Romanian 3% Italian 2% Slovak 2%
- Foreign-born
- 9% · Canada, China
- Languages at home
- 87% English-only · Spanish 5% Other Indo-European 2% French/Haitian/Cajun 1%
Political lean MEDSL · Baltimore
- 2024 margin
- Solid D (+73.0) · D 85.2% · R 12.2% · Other 2.6%
- 2008→2024 swing
- -2.5pp toward R · 2008: 75.5pp · 2024: 73.0pp
- All cycles
- 2024: D+73.0 2020: D+76.6 2016: D+74.6 2012: D+76.4 2008: D+75.5
Not yet ingested
- Civics
- —
Market trends
- HPI YoY
- ▼ -392.44%
- Current HPI
- 267.4569
- Rent YoY
- ▲ 4.65%
- Metro
- Baltimore-Columbia-Towson, MD
- State GDP YoY
- ▲ 2.97%
- F500 in state
- 12
Industry mix (Fortune 500 HQ in MD)
| Industry | F500 HQs | Revenue |
|---|---|---|
| Aerospace / Defense | 1 | $71B |
|
||
| Utilities | 1 | $25B |
|
||
| Hotels | 1 | $24B |
|
||
| Consumer Goods | 1 | $7B |
|
||
| Real Estate | 1 | $6B |
|
||
| Chemicals | 1 | $2B |
|
||
Price history
+109.3% since first listed23 events — show timeline
- 2026-04-22 Listed $90,000 BRIGHT MLS
- 2026-04-10 Sold (MLS) $75,000 BRIGHT MLS
- 2026-03-10 Listed $74,900 BRIGHT MLS
- 2026-03-10 Listing Removed — BRIGHT MLS
- 2025-04-11 Pending — BRIGHT MLS
- 2025-04-11 Listing Removed — BRIGHT MLS
- 2025-04-02 Relisted — BRIGHT MLS
- 2025-03-25 Pending — BRIGHT MLS
- 2025-03-12 Listed $127,310 BRIGHT MLS
- 2023-10-09 Listing Removed — BRIGHT MLS
- 2023-07-26 Relisted — BRIGHT MLS
- 2023-06-18 Contingent — BRIGHT MLS
- 2023-05-31 Relisted — BRIGHT MLS
- 2023-05-11 Contingent — BRIGHT MLS
- 2023-04-21 Relisted — BRIGHT MLS
- 2023-04-09 Pending — BRIGHT MLS
- 2023-03-27 Relisted — BRIGHT MLS
- 2023-03-04 Pending — BRIGHT MLS
- 2023-02-23 Contingent — BRIGHT MLS
- 2022-10-20 Listed $239,900 BRIGHT MLS
- 2006-04-14 Sold (Public Records) $105,698 Public Records
- 2003-03-12 Sold (Public Records) $65,000 Public Records
- 1988-06-21 Sold (Public Records) $43,000 Public Records
Property tax history
+1.7%/yrLatest (2025): $3,145 · +26.3% YoY. Source: county tax records.
Cash-flow waterfall
monthlySold comps — $/sqft
last 12 mo · ≤1 miLoading sold comps…