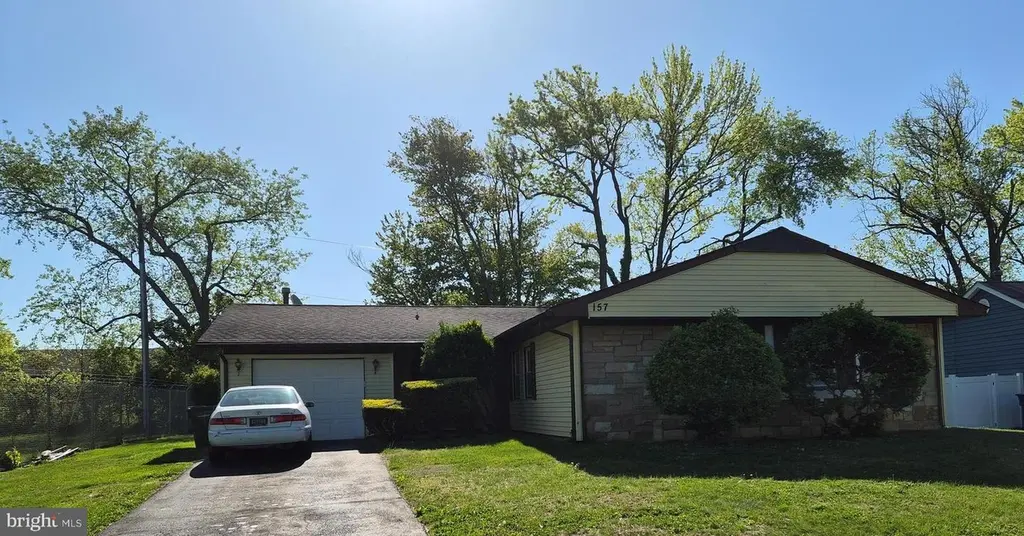
157 Edge Ln · Burlington, NJ
Flood risk 1/10 · Minimal
- FEMA flood zone
- X (unshaded)
- Chance of flooding over 30 yrs
- 0.0%
- Est. flood insurance / yr
- $507 – $1,088
Fire risk 1/10 · Minimal
- Est. fire insurance / yr
- $526 – $976
Heat risk 6/10 · Moderate
- Hot days now (above 105°F)
- 7 days/yr
- Hot days in 30 yrs
- 15 days/yr
Wind risk 6/10 · Moderate
- Chance of severe wind over 30 yrs
- 58.0%
Air-quality risk 4/10 · Minor
- Unhealthy air days now
- 5 days/yr
- Unhealthy air days in 30 yrs
- 7 days/yr
Risk factors via First Street. Map © Google.
Why this score? — see what drove the C+ grade
The composite is a weighted blend of 9 inputs, each scored 0–100. Each bar is that input's sub-score; the figure is the points it added to the 100-point composite (weight × sub-score).
- Cash flow +22.5/30.0
- ARV discount +15.0/15.0
- DSCR +7.2/10.0
- 1% rule +6.5/10.0
- Livability +3.9/5.0
- Rent growth +2.5/5.0
- Condition / age +2.5/5.0
- Schools +1.7/10.0
- Appreciation +0.0/10.0
$265,000
🖨 Deal sheet 📄 Offer letter ✓ Due diligence
Listing remarks
Perfect opportunity for Investors, flippers, renovators & 1st time home buyers to bring your vision to life. This 3 bedroom, 2 bath Ranch has a practical & functional floorplan with "good bones" . .. newer windows, roof & HVAC/Water Heater, making it an ideal canvas for a renovation to it's fullest potential. A large lot, cared for by a lawn service for many years provides great curb appeal. This property is being sold strickly AS-IS. Solar panels are leased. The seller will make no repairs. Buyer is responsible for all municiple requirements, Certificate of Occupancy, any open permits if applicable and resolving any violations should there be any. Showings begin
Key facts
- Great curb appeal
- Newer roof
- Large lot
Tags
Property features AI
Exterior
- Parking: Driveway
- Utilities: Public water; Public septic; Hot water: natural gas; Heating fuel: natural gas; PV solar array(s) leased
- Home design: Detached structure; Shingle roof; Frame construction
- Construction: Slab foundation; Construction not completed
- Exterior features: Not in a federal flood zone; 2+ access exits; Lot approximately 70 x 100
Interior
- Bedrooms: 3 bedrooms on main level
- Flooring: Vinyl
- Bathrooms: 2 full bathrooms on main level; 2 full bathrooms total
- Heating & cooling: 90% forced air heating (natural gas); Solar on-grid cooling
- Interior features: Dry wall walls and ceilings; Vinyl flooring; Has fireplace (1)
Neighborhood map
What this means for you Summary
Snapshot
- This is a 3-bed/2.0-bath single-family listed at $265k.
Deal economics
- At list price, monthly cash flow is $446 ($5k/yr) — positive.
- The deal already cash-flows at list — no discount required.
- Meets the 1% rule at list price ($3k rent vs $265k).
- Cap rate 8.3% vs local median 4.6% in Burlington — top-decile yield for the area; either an underpriced asset or a hidden risk that comps aren't pricing in. Stress-test before assuming the spread holds.
Location & tenants
- Location reads 78/100 on livability (#89 in NJ, #2,359 nationally) — a middle-class / working-renter tenant base. Strengths: housing A+, health & safety A+, cost of living A-; Watch: schools C-, amenities F.
- Willingboro Public School District (suburban): math 5% / reading 30% proficiency, ranked #433 of 472 in NJ (top 92%) — low school quality limits family demand, transient renter base, plan for 1-2y turnover.
- Market conditions: 151 active listings in the ZIP; 6 comparable units currently listed for rent nearby; rentals leasing fast (median 2d on market — plan ~1-2 weeks tenant-placement turnaround); solid renter incomes; 2,161 units permitted in Burlington County in 2024 (988 in 5+ unit buildings).
- This rent runs 37% of the median local income ($98k/yr) — at the standard rent-burdened threshold; future hikes will face affordability resistance.
Forward outlook
- Local home prices are declining (-3.0%/yr); year-one equity from $2k of loan paydown is wiped out by about $8k of value loss. Plan a longer hold.
- Burlington County population projected to shrink 5% by 2050 — rents likely to lag national; underwrite the cash flow, not the appreciation.
Negotiation context
- Only 8 days on market — expect competitive offers; lowballing is unlikely to land.
Risks & watch-outs
- Climate carrying-cost: major wind risk, 58% chance of damaging wind over 30y; extreme-heat days projected 7→15/yr by 2055 (HVAC capex compounding) — expect insurance premiums to compound above CPI over the hold.
Questions for the listing agent
- Built in 1967 — when were the roof, HVAC, electrical panel, plumbing, and water heater last replaced?
- Is there a deadline driving the sale (1031 exchange, divorce, estate, relocation)? That informs how much negotiation room exists.
- What's the average days-on-market for RENTAL listings here right now (not sales)? A rising rental-DOM trend means longer vacancies and softer asking-rent achievability than the comps imply.
- What's the recent tenant-quality profile in this submarket — average credit score on applications, eviction rate, late-payment / NSF rate, and stable-employment percentage? A property-management company in the area should have these aggregated.
- How much new for-sale + rental construction is in the pipeline within 1–3 miles? Heavy new supply typically softens prices + rents 12–24 months out; constrained supply supports both.
Investment metrics
- 1% rule
- 1.15% ✓
- Cap rate
- 8.31%
- Cash-on-cash
- 7.22%
- DSCR
- 1.32
- GRM
- 7.2
CMA / ARV
- ARV (on-the-fly)
- $337,930
- Comps found
- 12
Show comp detail 12 sales within ~0.75 mi
| Address | Dist | Beds/Ba | Sqft | Sold | Price | $/sf | Match |
|---|---|---|---|---|---|---|---|
| 157 Edge Ln | 0.00mi | 3/2.0 | 1,438 (0%) | 0mo | $265,000 | $184 | 100 |
| 139 Edge Ln | 0.07mi | 3/— | 1,438 (0%) | 2mo | $255,000 | $177 | 95 |
| 132 Edge Ln | 0.10mi | 3/2.0 | 1,322 (-8%) | 9mo | $339,900 | $257 | 74 |
| 41 Eastgate Ln | 0.52mi | 3/2.0 | 1,438 (0%) | 2mo | $385,000 | $268 | 74 |
| 111 Edge Ln | 0.18mi | 4/2.0 (+1) | 1,573 (+9%) | 1mo | $335,000 | $213 | 70 |
| 80 Ember Ln | 0.14mi | 4/2.0 (+1) | 1,573 (+9%) | 6mo | $370,000 | $235 | 68 |
| 29 Executive Ln | 0.21mi | 3/2.0 | 1,642 (+14%) | 7mo | $280,000 | $171 | 61 |
| 142 Eastbrook Ln | 0.55mi | 3/2.0 | 1,322 (-8%) | 1mo | $345,000 | $261 | 60 |
| 67 Triangle Ln | 0.70mi | 3/2.0 | 1,322 (-8%) | 4mo | $380,000 | $287 | 51 |
| 86 E River Dr | 0.58mi | 4/2.0 (+1) | 1,573 (+9%) | 3mo | $265,000 | $168 | 50 |
| 11 Guild Ct | 0.66mi | 4/2.0 (+1) | 1,542 (+7%) | 5mo | $355,865 | $231 | 48 |
| 30 Gallaway Ln | 0.73mi | 3/2.0 | 1,267 (-12%) | 2mo | $355,000 | $280 | 45 |
Match score weights: distance 35% · size 25% · config 20% · recency 20%. Top-matched comps best support the ARV.
Projected returns pro-forma
-3.0% appreciation · 3.0% rent growth · sell at horizon
- IRR
- -5.2%
- Equity multiple
- 0.81×
- Total profit
- $-14,392
- Equity at exit
- $39,512
- IRR
- 4.5%
- Equity multiple
- 1.33×
- Total profit
- $24,597
- Equity at exit
- $22,912
Cash invested: $74,200 (down + closing). Projections, not guarantees.
Landlord ↔ Tenant lean methodology
- Overall (STATE)
- 21 Tenant-Leaning
- State New Jersey
- 21 Tenant-Leaning · D+6
- County
- — inherits STATE
- City
- — inherits STATE
ZIP-level market 08046
- Active inventory
- 151
- Price-to-rent
- 7.2×
Monthly cashflow live
- Estimated rent
- $3,060 high interval (Pro) →
- Mortgage (P&I)
- −$1,390
- Tax from tax record
- −$471 /mo · $5,652/yr
- Insurance
- −$110
- HOA
- −$0
- Vacancy / Maint / Mgmt
- −$643
- Net cashflow
- $446
Break-even live
UW: 25.0% down · 7.5% · 30yr · 1.5% tax · 5.0% vac · 8.0% maint · 8.0% mgmt
Financing live
Cash to close
- Down payment
- $66,250
- Closing costs
- $7,950
- Reserves months
- —
- Total cash needed
- —
Loan-product check · same deal, 3 products live
Conventional
25% down · 7.5% · 30yr
- Down + closing
- —
- Monthly P&I
- —
- Monthly cashflow
- —
- DSCR
- —
- Eligible?
- —
Personal DTI + credit; lowest rate.
DSCR
20% down · 8.5% · 30yr
- Down + closing
- —
- Monthly P&I
- —
- Monthly cashflow
- —
- DSCR
- —
- Eligible?
- —
No personal income docs; deal must DSCR.
Hard money
10% down · 12.0% · 12mo
- Down + closing
- —
- Monthly P&I
- —
- Monthly cashflow
- —
- DSCR
- —
- Eligible?
- —
Short-term bridge; refi at stabilization.
Rent comps 6 comps
| Address | Beds | Baths | Sqft | Rent | $/sqft | DOM | Units | Dist |
|---|---|---|---|---|---|---|---|---|
| 4 Elliot Ln Westampton, NJ | 3.0 | 2.5 | 1500 | $2,900 | $1.93 | 1d | 1 | 0.14mi |
| 62 Sharpless Blvd Westampton, NJ | 3.0 | 1.5 | 1490 | $2,275 | $1.53 | 1d | 1 | 0.53mi |
| 16 Elridge Ln Willingboro, NJ | 3.0 | 2.0 | 1350 | $2,650 | $1.96 | 1d | 1 | 0.70mi |
| 89 Oakcrest Ln Westampton, NJ | 2.0 | 1.5 | 1358 | $2,500 | $1.84 | 1d | 1 | 0.84mi |
| 89 Hampshire Ln Willingboro, NJ | 4.0 | 2.0 | 1562 | $3,400 | $2.18 | 10d | 1 | 1.47mi |
| 48 Marboro Ln Willingboro, NJ | 4.0 | 2.0 | 1497 | $3,995 | $2.67 | 3d | 1 | 1.49mi |
Listing history 2 events
-
2026-05-09status Pending
-
2026-05-01$265,000 Active
ⓘ Source: listings_history table (triggers on properties + properties_extension) + one-shot
backfill from property_details.listing_events for pre-trigger history.
Tax reassessment forecast NJ · Partial reset (capped growth)
- Current annual tax
- $5,652 · $471/mo
- Projected year-2 tax
- $6,125 · $510/mo
- Expected delta
- +$473/yr (+$39/mo · 8.4%)
ⓘ Screening estimate from a state-policy table — verify with the county assessor before closing.
Climate risk First Street
- Flood 1/10 Low FEMA zone X (unshaded) · 0% chance over 30 yrs
- Wildfire 1/10 Low
- Heat 6/10 Major 7 d/yr ≥105°F today · 15 d/yr by 30 yrs out
- Wind 6/10 Major 58% chance of damaging wind over 30 yrs
- Air quality 4/10 Moderate 5 unhealthy d/yr today · 7 by 30 yrs out
Nearby sold comps map
Loading sold comps map…
Walkable amenities ~0.75 mi
Loading nearby amenities…
Taxation est. · year 1
- Rental income
- $36,718
- − Mortgage interest
- −$14,844
- − Property taxes
- −$5,652
- − Insurance
- −$1,325
- − Repairs & maintenance
- −$2,937
- − Management
- −$2,937
- − Depreciation
- −$7,709
- Taxable income
- $1,313
- Est. tax owed @ 24.0%
- −$315
- After-tax cash flow
- $5,039/yr
For passive investors: Depreciation is non-cash, so a rental often shows a tax loss while cash-flowing — sheltering income. Rental losses are passive: they offset passive income freely, and up to $25,000/yr can offset ordinary (W-2) income if you actively participate and your MAGI is under $100k (phasing out to $0 by $150k); unused losses carry forward. On sale, claimed depreciation is recaptured at up to 25%, and gains may owe capital-gains tax (a 1031 exchange can defer both). Figures are a year-1 estimate at your 24.0% rate — not tax advice; consult a CPA.
Schools (NCES district)
- District
- Willingboro Public School District
- NCES district ID
- 3418000
- Math proficiency
- 5% ▼ -11.00%
- Reading proficiency
- 30% ▼ -1.00%
- Median HH income
- $67,064
- Composite
- 17.37/100
- National rank
- #9074
- State rank
- #433 of 472 in NJ
Livability — Burlington
- Score
- 78/100
- State rank
- #89
- US rank
- #2359
Category grades
Schools grade is shown separately in the Schools card above.
Census & demographics
- County
- Burlington County · 323,710 people
- Metro
- Philadelphia-Camden-Wilmington, PA-NJ-DE-MD
- Population (ZIP)
- 31,981
- Household income
- $98,178
- Rent vs Own
- Severe rent burden
- 342.0
Population outlook (Burlington County) Hauer SSP2
- Today (2025)
- 453,425 people
- By 2030
- 452,359 · -0.2%
- By 2040
- 445,033 · -1.9%
- By 2050
- 431,760 · -4.8%
- By 2075
- 406,277 · -10.4%
- By 2100
- 364,732 · -19.6%
Race, ethnicity, and origin ACS 2023
- Neighborhood character
- Predominantly Black (66%)
- Race & ethnicity
- Black 66% Hispanic / Latino 15% Two or more races 14% White 10%
- Hispanic origin (detail)
- Puerto Rican 9% Dominican 2%
- Common ancestry
- Swiss 4% Romanian 2% Hispanic 1%
- Foreign-born
- 15% · Canada, Jamaica
- Languages at home
- 82% English-only · Spanish 10% French/Haitian/Cajun 2% Other Indo-European 1%
Political lean MEDSL · Burlington
- 2024 margin
- D (+16.6) · D 57.6% · R 41.0% · Other 1.3%
- 2008→2024 swing
- -2.0pp toward R · 2008: 18.6pp · 2024: 16.6pp
- All cycles
- 2024: D+16.6 2020: D+19.5 2016: D+14.8 2012: D+18.7 2008: D+18.6
Not yet ingested
- Civics
- —
Market trends
- HPI YoY
- ▼ -273.52%
- Current HPI
- 348.3441
- Rent YoY
- —
- Metro
- Philadelphia-Camden-Wilmington, PA-NJ-DE-MD
- State GDP YoY
- ▲ 2.05%
- F500 in state
- 34
Industry mix (Fortune 500 HQ in NJ)
| Industry | F500 HQs | Revenue |
|---|---|---|
| Consumer Goods | 3 | $31B |
|
||
| Pharmaceuticals | 2 | $153B |
|
||
| Technology | 2 | $21B |
|
||
| Insurance | 2 | $20B |
|
||
| Healthcare | 2 | $19B |
|
||
| Financial Services | 1 | $70B |
|
||
Price history
2 events — show timeline
- 2026-05-09 Pending — BRIGHT MLS
- 2026-05-01 Listed $265,000 BRIGHT MLS
Property tax history
+1.1%/yrLatest (2025): $5,652 · +2.0% YoY. Source: county tax records.
Cash-flow waterfall
monthlySold comps — $/sqft
last 12 mo · ≤1 miLoading sold comps…