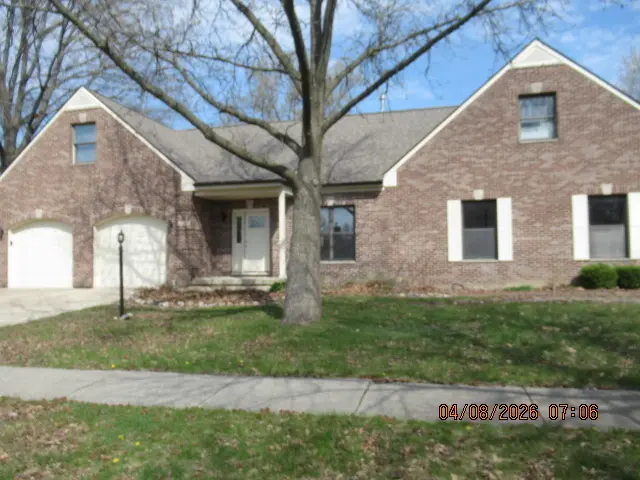
1318 Broadmoor Dr · Champaign, IL
Flood risk 1/10 · Minimal
- FEMA flood zone
- X (unshaded)
- Chance of flooding over 30 yrs
- 0.0%
- Est. flood insurance / yr
- $473 – $860
Fire risk 1/10 · Minimal
- Est. fire insurance / yr
- $804 – $1,492
Heat risk 3/10 · Minor
- Hot days now (above 103°F)
- 7 days/yr
- Hot days in 30 yrs
- 19 days/yr
Wind risk 2/10 · Minimal
- Chance of severe wind over 30 yrs
- 1.0%
Air-quality risk 2/10 · Minimal
- Unhealthy air days now
- 0 days/yr
- Unhealthy air days in 30 yrs
- 1 days/yr
Risk factors via First Street. Map © Google.
Why this score? — see what drove the D+ grade
The composite is a weighted blend of 9 inputs, each scored 0–100. Each bar is that input's sub-score; the figure is the points it added to the 100-point composite (weight × sub-score).
- Cash flow +16.1/30.0
- ARV discount +7.5/15.0
- 1% rule +6.7/10.0
- DSCR +5.0/10.0
- Rent growth +4.8/5.0
- Livability +4.2/5.0
- Condition / age +2.5/5.0
- Schools +2.2/10.0
- Appreciation +0.0/10.0
$200,000
🖨 Deal sheet 📄 Offer letter ✓ Due diligence
Listing remarks
This was a beautiful house. Now it needs a creative new owner. Start from scratch and build your dream home. Soaring ceilings accent the first floor. The master suite is located on the first floor. Upstairs are 2 more bedrooms and a sitting room that overlooks the main level. The full basement was finished with a third bathroom and super large family room. Look beyond the problems and visualize a spectacular new house.
Key facts
- 2 garage spots
- Built 1994
- Listed 11 days
Property features AI
Finance
- Other: Living area source: Assessor; Total finished/unfinished area listed as 3,800 (approx.); Main level approx. 1,300; upper level approx. 1,200; unfinished basement approx. 1,300
- HOA & community: No master association fee required
Exterior
- Parking: Attached garage (garage owned) with 2 garage spaces; Total of 2 parking spaces
- Utilities: Public water; Public sewer
- Home design: Detached single-family home; 1.5-story design; Fee simple ownership
- Construction: Brick construction; Built approximately 31–40 years ago
- Exterior features: Lot dimensions: 74.31 x 149.5 x 157.88 x 131.57; Lot size approximately 0.25–0.49 acre
Interior
- Kitchen: Kitchen with eating area/table space (21 x 12)
- Bedrooms: Master bedroom on the main level (27 x 15) with a full bath; Second bedroom on the second level (16 x 12); Third bedroom on the second level (14 x 12)
- Bathrooms: Three full bathrooms; One half bathroom; Basement contains a bathroom
- Heating & cooling: Natural gas heating; Central air conditioning
- Interior features: Seven total rooms; Unfinished full basement; One fireplace in the living room; Separate dining room
- Laundry & utility: Laundry room
Neighborhood map
What this means for you Summary
Snapshot
- This is a 3-bed/3.5-bath other listed at $200k.
Deal economics
- At list price, monthly cash flow is $101 ($1k/yr) — positive.
- The deal already cash-flows at list — no discount required.
- Meets the 1% rule at list price ($2k rent vs $200k).
- Cap rate 6.9% vs local median 3.8% in Champaign — top-decile yield for the area; either an underpriced asset or a hidden risk that comps aren't pricing in. Stress-test before assuming the spread holds.
Location & tenants
- Location reads 83/100 on livability (#44 in IL, #902 nationally) — a professional / high-income tenant draw. Strengths: commute A+, cost of living A+, housing A+; Watch: crime F.
- Champaign CUSD 4 (urban): math 24% / reading 26% proficiency, ranked #333 of 620 in IL (top 54%) — low school quality limits family demand, transient renter base, plan for 1-2y turnover.
- Zoned schools: Stratton Elementary School (math 12% / reading 2%, grade F, #1,673 of 2,056 statewide, top 84%, 476 students, 0% FRL); Central High School (math 32% / reading 38%, grade F, #125 of 693 statewide, top 18%, 1,597 students, 0% FRL) — zoned schools average 0% FRL vs 52% district-wide (52 pts lower); this property's tenant base skews higher-income than the district average.
- Market conditions: Rents rising fast (+9.3%/yr); 89 active listings in the ZIP; 4 comparable units currently listed for rent nearby; rentals lingering (median 44d on market — plan ~5-8 weeks vacancy on turnover, expect pricing pressure); 75% of comp listings sitting > 30 days — soft ceiling on asking rent; 573 units permitted in Champaign County in 2024 (359 in 5+ unit buildings).
- This rent runs 40% of the median local income ($71k/yr) — at the standard rent-burdened threshold; future hikes will face affordability resistance.
Forward outlook
- Local home prices are declining (-3.0%/yr); year-one equity from $1k of loan paydown is wiped out by about $6k of value loss. Plan a longer hold.
- Champaign County population projected at +15% by 2050 — modest demand growth; plan on rents tracking national, not racing it.
- At projected returns (-3.0% appreciation + 8.0% rent growth), your $56k cash investment doubles in ~10 years — after that, you're playing with house money.
Negotiation context
- Only 11 days on market — expect competitive offers; lowballing is unlikely to land.
- 7 sale attempts since 2y ago with the ask held roughly flat each time — persistent listings suggest the price (not the market) is what's stuck; bring a comps-based counter.
Risks & watch-outs
- Watch-outs: property tax is 3.7% of price.
Questions for the listing agent
- Property tax is high relative to price — has the assessment been appealed recently, and will the sale trigger a re-assessment?
- Is there a deadline driving the sale (1031 exchange, divorce, estate, relocation)? That informs how much negotiation room exists.
- Crime grade is F in this area — have there been break-ins, vandalism, or insurance claims at this property in the last 3 years? What carrier currently insures it and at what premium?
- The area grade is low — what's the realistic commute time and amenity access for the typical tenant pool here? Any planned neighborhood developments (good or bad) we should know about?
- What's the average days-on-market for RENTAL listings here right now (not sales)? A rising rental-DOM trend means longer vacancies and softer asking-rent achievability than the comps imply.
- What's the recent tenant-quality profile in this submarket — average credit score on applications, eviction rate, late-payment / NSF rate, and stable-employment percentage? A property-management company in the area should have these aggregated.
- How much new for-sale + rental construction is in the pipeline within 1–3 miles? Heavy new supply typically softens prices + rents 12–24 months out; constrained supply supports both.
Investment metrics
- 1% rule
- 1.17% ✓
- Cap rate
- 6.90%
- Cash-on-cash
- 2.17%
- DSCR
- 1.10
- GRM
- 7.1
CMA / ARV
No comps found within radius.
Projected returns pro-forma
-3.0% appreciation · 8.0% rent growth · sell at horizon
- IRR
- -6.0%
- Equity multiple
- 0.76×
- Total profit
- $-13,356
- Equity at exit
- $29,821
- IRR
- 9.8%
- Equity multiple
- 1.96×
- Total profit
- $53,949
- Equity at exit
- $17,292
Cash invested: $56,000 (down + closing). Projections, not guarantees.
Landlord ↔ Tenant lean methodology
- Overall (STATE)
- 43 Moderately Tenant-Leaning
- State Illinois
- 43 Moderately Tenant-Leaning · D+7
- County
- — inherits STATE
- City
- — inherits STATE
ZIP-level market 61821
- Home prices YoY
- -26.1%
- Rents YoY
- 9.3%
- Active inventory
- 89
- Price-to-rent
- 7.1×
Monthly cashflow live
- Estimated rent
- $2,338 medium interval (Pro) →
- Mortgage (P&I)
- −$1,049
- Tax from tax record
- −$614 /mo · $7,367/yr
- Insurance
- −$83
- HOA
- −$0
- Vacancy / Maint / Mgmt
- −$491
- Net cashflow
- $101
Break-even live
UW: 25.0% down · 7.5% · 30yr · 1.5% tax · 5.0% vac · 8.0% maint · 8.0% mgmt
Financing live
Cash to close
- Down payment
- $50,000
- Closing costs
- $6,000
- Reserves months
- —
- Total cash needed
- —
Loan-product check · same deal, 3 products live
Conventional
25% down · 7.5% · 30yr
- Down + closing
- —
- Monthly P&I
- —
- Monthly cashflow
- —
- DSCR
- —
- Eligible?
- —
Personal DTI + credit; lowest rate.
DSCR
20% down · 8.5% · 30yr
- Down + closing
- —
- Monthly P&I
- —
- Monthly cashflow
- —
- DSCR
- —
- Eligible?
- —
No personal income docs; deal must DSCR.
Hard money
10% down · 12.0% · 12mo
- Down + closing
- —
- Monthly P&I
- —
- Monthly cashflow
- —
- DSCR
- —
- Eligible?
- —
Short-term bridge; refi at stabilization.
Rent comps 4 comps
| Address | Beds | Baths | Sqft | Rent | $/sqft | DOM | Units | Dist |
|---|---|---|---|---|---|---|---|---|
| 1716 Georgetown Dr Champaign, IL | 3.0 | 2.5 | 2081 | $2,500 | $1.20 | 13d | 1 | 0.13mi |
| 1716 Georgetown Dr Champaign, IL | 3.0 | 2.5 | 2081 | $2,800 | $1.35 | 43d | 1 | 0.13mi |
| 1738 Westhaven Dr Champaign, IL | 4.0 | 3.5 | 2810 | $2,100 | $0.75 | 43d | 1 | 0.91mi |
| 707 Hessel Blvd Champaign, IL | 3.0 | 2.0 | 1967 | $1,930 | $0.98 | 43d | 1 | 0.93mi |
Listing history 21 events
-
2026-05-08status Pending 429-char remark
-
2026-04-27$200,000 Active 429-char remark
-
2026-04-05historical
-
2026-01-01status Temporarily No Showings
-
2025-09-27status Pending
-
2025-08-28price
-
2025-07-17price
-
2025-07-03status Active
-
2025-07-03price
-
2025-04-29historical
-
2025-04-29status Temporarily No Showings
-
2025-04-28historical
-
2025-04-24Active
-
2025-04-04historical
-
2025-03-24price
-
2025-03-10price
-
2025-02-25price
-
2025-02-18Active
-
2024-06-12soldstatus $300,000
-
2024-06-12$275,000
-
2024-06-12soldstatus $450,000
ⓘ Source: listings_history table (triggers on properties + properties_extension) + one-shot
backfill from property_details.listing_events for pre-trigger history.
Tax reassessment forecast IL · Partial reset (capped growth)
- Current annual tax
- $7,367 · $614/mo
- Projected year-2 tax
- $7,367 · $614/mo
- Expected delta
- $0/yr ($0/mo · 0.0%)
ⓘ Screening estimate from a state-policy table — verify with the county assessor before closing.
Climate risk First Street
- Flood 1/10 Low FEMA zone X (unshaded) · 0% chance over 30 yrs
- Wildfire 1/10 Low
- Heat 3/10 Moderate 7 d/yr ≥103°F today · 19 d/yr by 30 yrs out
- Wind 2/10 Low 100% chance of damaging wind over 30 yrs
- Air quality 2/10 Low 0 unhealthy d/yr today · 1 by 30 yrs out
Nearby sold comps map
Loading sold comps map…
Walkable amenities ~0.75 mi
Loading nearby amenities…
Taxation est. · year 1
- Rental income
- $28,057
- − Mortgage interest
- −$11,203
- − Property taxes
- −$7,367
- − Insurance
- −$1,000
- − Repairs & maintenance
- −$2,245
- − Management
- −$2,245
- − Depreciation
- −$5,818
- Taxable loss
- −$1,820
- Est. tax savings @ 24.0%
- +$437
- After-tax cash flow
- $1,650/yr
For passive investors: Depreciation is non-cash, so a rental often shows a tax loss while cash-flowing — sheltering income. Rental losses are passive: they offset passive income freely, and up to $25,000/yr can offset ordinary (W-2) income if you actively participate and your MAGI is under $100k (phasing out to $0 by $150k); unused losses carry forward. On sale, claimed depreciation is recaptured at up to 25%, and gains may owe capital-gains tax (a 1031 exchange can defer both). Figures are a year-1 estimate at your 24.0% rate — not tax advice; consult a CPA.
Schools (NCES district)
- District
- Champaign CUSD 4
- NCES district ID
- 1709420
- Math proficiency
- 24% ▼ -7.00%
- Reading proficiency
- 26% ▼ -7.00%
- Median HH income
- $45,797
- Composite
- 21.66/100
- National rank
- #8281
- State rank
- #333 of 620 in IL
Livability — Champaign
- Score
- 83/100
- State rank
- #44
- US rank
- #902
Category grades
Schools grade is shown separately in the Schools card above.
Census & demographics
- Census place
- Champaign, IL
- County
- Champaign County · 182,148 people
- City population
- 96,852
- Metro
- Champaign-Urbana, IL
- Population (ZIP)
- 28,611
- Household income
- $70,715
- Rent vs Own
- Severe rent burden
- 1023.0
Population outlook (Champaign County) Hauer SSP2
- Today (2025)
- 223,848 people
- By 2030
- 231,416 · +3.4%
- By 2040
- 244,321 · +9.1%
- By 2050
- 256,432 · +14.6%
- By 2075
- 285,823 · +27.7%
- By 2100
- 296,406 · +32.4%
Race, ethnicity, and origin ACS 2023
- Neighborhood character
- Diverse neighborhood (Simpson 0.61)
- Race & ethnicity
- White 57% Black 23% Asian 8% Hispanic / Latino 8% Two or more races 6%
- Hispanic origin (detail)
- Mexican 4% Puerto Rican 2%
- Common ancestry
- Romanian 4% Lithuanian 2% Slovak 2%
- Foreign-born
- 14% · Canada, China, South Korea
- Languages at home
- 82% English-only · Spanish 5% French/Haitian/Cajun 5% Tagalog/Filipino 2%
Political lean MEDSL · Champaign
- 2024 margin
- Strong D (+24.1) · D 61.3% · R 37.2% · Other 1.5%
- 2008→2024 swing
- +6.6pp toward D · 2008: 17.5pp · 2024: 24.1pp
- All cycles
- 2024: D+24.1 2020: D+22.8 2016: D+18.4 2012: D+6.8 2008: D+17.5
Not yet ingested
- Civics
- —
Market trends
- HPI YoY
- ▼ -78.19%
- Current HPI
- 221.1245
- Rent YoY
- ▲ 9.29%
- Metro
- Champaign-Urbana, IL
- State GDP YoY
- ▲ 1.59%
- F500 in state
- 60
Industry mix (Fortune 500 HQ in IL)
| Industry | F500 HQs | Revenue |
|---|---|---|
| Insurance | 4 | $201B |
|
||
| Consumer Goods | 4 | $87B |
|
||
| Industrial Machinery | 3 | $64B |
|
||
| Healthcare | 2 | $55B |
|
||
| Retail / Pharmacy | 1 | $148B |
|
||
| Agriculture / Food | 1 | $86B |
|
||
Price history
-16.7% since first listed22 events — show timeline
- 2026-05-22 Sold (MLS) $250,000 MRED as Distributed by MLS Grid
- 2026-05-08 Pending — MRED as Distributed by MLS Grid
- 2026-04-27 Listed $200,000 MRED as Distributed by MLS Grid
- 2026-04-05 Listing Removed — MRED as Distributed by MLS Grid
- 2026-01-01 Relisted — MRED as Distributed by MLS Grid
- 2025-09-27 Pending — MRED as Distributed by MLS Grid
- 2025-08-28 Price Changed — MRED as Distributed by MLS Grid
- 2025-07-17 Price Changed — MRED as Distributed by MLS Grid
- 2025-07-03 Relisted — MRED as Distributed by MLS Grid
- 2025-07-03 Price Changed — MRED as Distributed by MLS Grid
- 2025-04-29 Listing Removed — MRED as Distributed by MLS Grid
- 2025-04-29 Relisted — MRED as Distributed by MLS Grid
- 2025-04-28 Listing Removed — MRED as Distributed by MLS Grid
- 2025-04-24 Listed — MRED as Distributed by MLS Grid
- 2025-04-04 Listing Removed — MRED as Distributed by MLS Grid
- 2025-03-24 Price Changed — MRED as Distributed by MLS Grid
- 2025-03-10 Price Changed — MRED as Distributed by MLS Grid
- 2025-02-25 Price Changed — MRED as Distributed by MLS Grid
- 2025-02-18 Listed — MRED as Distributed by MLS Grid
- 2024-06-12 Sold (Public Records) $450,000 Public Records
- 2024-06-12 Listed $275,000 MRED as Distributed by MLS Grid
- 2024-06-12 Sold (MLS) $300,000 MRED as Distributed by MLS Grid
Property tax history
+2.5%/yrLatest (2025): $7,367 · +8.1% YoY. Source: county tax records.
Cash-flow waterfall
monthlySold comps — $/sqft
last 12 mo · ≤1 miLoading sold comps…