 🏷️ Likely Rental
2616 Somerville Loop · Cape Coral, FL
Flood risk 8/10 · Major
- FEMA flood zone
- X (shaded)
- Chance of flooding over 30 yrs
- 0.99%
- Est. flood insurance / yr
- $507 – $1,088
Fire risk 1/10 · Minimal
- Est. fire insurance / yr
- $947 – $1,759
Heat risk 10/10 · Severe
- Hot days now (above 107°F)
- 6 days/yr
- Hot days in 30 yrs
- 23 days/yr
Wind risk 10/10 · Severe
- Chance of severe wind over 30 yrs
- 99.0%
Air-quality risk 2/10 · Minimal
- Unhealthy air days now
- 1 days/yr
- Unhealthy air days in 30 yrs
- 1 days/yr
Risk factors via First Street. Map © Google.
Why this score? — see what drove the D+ grade
The composite is a weighted blend of 9 inputs, each scored 0–100. Each bar is that input's sub-score; the figure is the points it added to the 100-point composite (weight × sub-score).
- ARV discount +15.0/15.0
- Cash flow +14.1/30.0
- DSCR +4.3/10.0
- Schools +4.1/10.0
- Condition / age +4.0/5.0
- 1% rule +3.9/10.0
- Livability +3.9/5.0
- Rent growth +0.4/5.0
- Appreciation +0.0/10.0
$279,900
🖨 Deal sheet 📄 Offer letter ✓ Due diligence
Listing remarks
Why make SOMERVILLE at SANDOVAL your new home? Here& apos; s why! Within this well-established community of 172 condominiums in Somerville Loop and 1,490 single family homes within the community, you simply won& apos; t find anything like it in Cape Coral. Looking for that ultimate tropical lifestyle? Somerville at Sandoval offers a remarkable array of CLUBS, SPECIAL EVENTS and LIFESTYLE ACTIVITIES for all ages. The Somerville condos are a FAMILY & amp; PET FRIENDLY (2 dog parks!) neighborhood with its own PRIVATE POOL & amp; HOT TUB. Of course, Somerville residents have access to all of Sandoval& apos; s expansive array of amenities. There is no need to go on a vacatio
Key facts
- Built 2006
Neighborhood map
What this means for you Summary
Snapshot
- This is a 2-bed/2.0-bath single-family listed at $280k. Condition is rated good.
Deal economics
- At list price, monthly cash flow is $-24 ($-292/yr) — negative.
- To cash-flow at today's rent, offer at most $276k (1.3% below list).
- To meet the 1% rule (rent ≥ 1% of price), the offer needs to be $250k (10.6% below list).
- Recommended offer: $250k (10.6% below list) — sets the bar for 1% rule.
- Cap rate 6.5% vs local median 3.1% in Cape Coral — top-decile yield for the area; either an underpriced asset or a hidden risk that comps aren't pricing in. Stress-test before assuming the spread holds.
Location & tenants
- Location reads 77/100 on livability (#208 in FL, #3,098 nationally) — a middle-class / working-renter tenant base. Strengths: housing A+, health & safety A+, amenities B+; Watch: commute F.
- Lee (suburban): math 47% / reading 50% proficiency, ranked #42 of 73 in FL (top 58%) — families likely to look elsewhere, expect single-tenant / working-renter base with shorter leases.
- Market conditions: Rents falling (-8.6%/yr); 686 active listings in the ZIP; 22 comparable units currently listed for rent nearby; rentals at typical pace (median 24d on market — plan ~3-4 weeks tenant-placement turnaround); solid renter incomes; 15,411 units permitted in Lee County in 2024 (4,686 in 5+ unit buildings).
- This rent runs 36% of the median local income ($84k/yr) — at the standard rent-burdened threshold; future hikes will face affordability resistance.
Forward outlook
- Local home prices are declining (-3.0%/yr); year-one equity from $2k of loan paydown is wiped out by about $8k of value loss. Plan a longer hold.
- Lee County population projected at +44% by 2050 — long-run rental-demand tailwind backs the buy-and-hold thesis.
Negotiation context
- Only 0 days on market — expect competitive offers; lowballing is unlikely to land.
Risks & watch-outs
- Watch-outs: flood insurance adds $66/mo.
- Climate carrying-cost: severe flood risk; severe wind risk, 99% chance of damaging wind over 30y; extreme-heat days projected 6→23/yr by 2055 (HVAC capex compounding) — expect insurance premiums to compound above CPI over the hold.
Questions for the listing agent
- What do current leases actually rent for vs. the listed asking? Can we see a recent rent roll and the last 12 months of T-12 income?
- What's the actual annual flood-insurance premium (NFIP or private), and is the property in a SFHA with mandatory coverage?
- Is there a deadline driving the sale (1031 exchange, divorce, estate, relocation)? That informs how much negotiation room exists.
- Schools are B-rated — typically a magnet for longer-tenancy family renters. What's the average tenant stay here, and is there a school-zone premium baked into asking?
- The area grade is low — what's the realistic commute time and amenity access for the typical tenant pool here? Any planned neighborhood developments (good or bad) we should know about?
- What's the average days-on-market for RENTAL listings here right now (not sales)? A rising rental-DOM trend means longer vacancies and softer asking-rent achievability than the comps imply.
- What's the recent tenant-quality profile in this submarket — average credit score on applications, eviction rate, late-payment / NSF rate, and stable-employment percentage? A property-management company in the area should have these aggregated.
- How much new for-sale + rental construction is in the pipeline within 1–3 miles? Heavy new supply typically softens prices + rents 12–24 months out; constrained supply supports both.
Investment metrics
- 1% rule
- 0.89% ✗
- Cap rate
- 6.47%
- Cash-on-cash
- 0.64%
- DSCR
- 1.03
- GRM
- 9.3
CMA / ARV
- ARV (on-the-fly)
- $391,050
- Comps found
- 12
Show comp detail 12 sales within ~0.75 mi
| Address | Dist | Beds/Ba | Sqft | Sold | Price | $/sf | Match |
|---|---|---|---|---|---|---|---|
| 2527 Blackburn Cir | 0.36mi | 3/2.0 (+1) | 1,792 (+9%) | 2mo | $359,000 | $200 | 62 |
| 2525 SW 24th Ct | 0.42mi | 3/2.0 (+1) | 1,702 (+3%) | 12mo | $390,000 | $229 | 60 |
| 2652 SW 29th Ave | 0.61mi | 3/2.0 (+1) | 1,698 (+3%) | 4mo | $327,500 | $193 | 58 |
| 2535 Woodbourne Pl | 0.49mi | 3/2.0 (+1) | 1,507 (-9%) | 1mo | $380,000 | $252 | 56 |
| 2835 SW 26th Pl | 0.70mi | 3/2.0 (+1) | 1,648 (-0%) | 8mo | $457,000 | $277 | 56 |
| 2710 Surfside Blvd | 0.60mi | 3/2.0 (+1) | 1,697 (+3%) | 9mo | $565,000 | $333 | 55 |
| 2492 Hopefield Ct | 0.70mi | 3/2.0 (+1) | 1,726 (+5%) | 6mo | $329,000 | $191 | 49 |
| 2523 Blackburn Cir | 0.38mi | 3/2.0 (+1) | 1,792 (+9%) | 20mo | $424,000 | $237 | 47 |
| 2520 Hopefield Ct | 0.69mi | 3/2.0 (+1) | 1,507 (-9%) | 7mo | $350,000 | $232 | 43 |
| 2428 Miracle | 0.32mi | 3/2.0 (+1) | 1,886 (+14%) | 16mo | $498,000 | $264 | 43 |
| 2313 SW 27th Ter | 0.68mi | 3/2.0 (+1) | 1,796 (+9%) | 13mo | $400,000 | $223 | 38 |
| 2707 SW 27th St | 0.50mi | 3/2.0 (+1) | 1,850 (+12%) | 21mo | $455,000 | $246 | 34 |
Match score weights: distance 35% · size 25% · config 20% · recency 20%. Top-matched comps best support the ARV.
Projected returns pro-forma
-3.0% appreciation · 0.0% rent growth · sell at horizon
- IRR
- -20.4%
- Equity multiple
- 0.31×
- Total profit
- $-54,161
- Equity at exit
- $41,734
- IRR
- -22.6%
- Equity multiple
- 0.02×
- Total profit
- $-77,175
- Equity at exit
- $24,201
Cash invested: $78,372 (down + closing). Projections, not guarantees.
Landlord ↔ Tenant lean methodology
- Overall (STATE)
- 87 Strongly Landlord-Friendly
- State Florida
- 87 Strongly Landlord-Friendly · R+3
- County
- — inherits STATE
- City
- — inherits STATE
ZIP-level market 33991
- Home prices YoY
- -27.8%
- Rents YoY
- -8.6%
- Active inventory
- 686
- Price-to-rent
- 9.3×
Monthly cashflow live
- Estimated rent
- $2,502 high interval (Pro) →
- Mortgage (P&I)
- −$1,468
- Tax est. 1.5%
- −$350 /mo · $4,198/yr
- Insurance
- −$117
- Flood insurance flood zone
- −$66 /mo · $798/yr
- HOA
- −$0
- Vacancy / Maint / Mgmt
- −$525
- Net cashflow
- $-24
Break-even live
UW: 25.0% down · 7.5% · 30yr · 1.5% tax · 5.0% vac · 8.0% maint · 8.0% mgmt
Financing live
Cash to close
- Down payment
- $69,975
- Closing costs
- $8,397
- Reserves months
- —
- Total cash needed
- —
Loan-product check · same deal, 3 products live
Conventional
25% down · 7.5% · 30yr
- Down + closing
- —
- Monthly P&I
- —
- Monthly cashflow
- —
- DSCR
- —
- Eligible?
- —
Personal DTI + credit; lowest rate.
DSCR
20% down · 8.5% · 30yr
- Down + closing
- —
- Monthly P&I
- —
- Monthly cashflow
- —
- DSCR
- —
- Eligible?
- —
No personal income docs; deal must DSCR.
Hard money
10% down · 12.0% · 12mo
- Down + closing
- —
- Monthly P&I
- —
- Monthly cashflow
- —
- DSCR
- —
- Eligible?
- —
Short-term bridge; refi at stabilization.
Rent comps 22 comps
| Address | Beds | Baths | Sqft | Rent | $/sqft | DOM | Units | Dist |
|---|---|---|---|---|---|---|---|---|
| 2616 Somerville Loop #2108 Cape Coral, FL | 2.0 | 2.0 | 1650 | $2,100 | $1.27 | 23d | 1 | 0.03mi |
| 2616 Somerville Loop #2107 Cape Coral, FL | 2.0 | 2.0 | 1373 | $1,700 | $1.24 | 23d | 1 | 0.03mi |
| 2627 Somerville Loop #608 Cape Coral, FL | 2.0 | 2.0 | 1650 | $4,400 | $2.67 | 23d | 1 | 0.11mi |
| 2430 Verdmont Ct Cape Coral, FL | 3.0 | 2.0 | 1694 | $2,500 | $1.48 | 15d | 1 | 0.27mi |
| 2454 Blackburn Cir Cape Coral, FL | 3.0 | 2.0 | 1696 | $2,650 | $1.56 | 23d | 1 | 0.29mi |
| 2535 SW 28th Pl Cape Coral, FL | 3.0 | 2.0 | 1452 | $5,500 | $3.79 | 23d | 1 | 0.44mi |
| 2919 SW 25th St Cape Coral, FL | 3.0 | 2.0 | 1394 | $3,100 | $2.22 | 23d | 1 | 0.48mi |
| 2919 SW 25th St Cape Coral, FL | 3.0 | 2.0 | 1394 | $2,900 | $2.08 | 21d | 1 | 0.48mi |
| 2200 Oasis Palm Cir Cape Coral, FL | 1.0–3.0 | 1.0–2.0 | 1076 | $1,659 | $1.54 | 2d | 19 | 0.60mi |
| 2427 Woodbourne Pl Cape Coral, FL | 3.0 | 2.0 | 1507 | $2,300 | $1.53 | 15d | 1 | 0.62mi |
| 2305 SW 19th Pl Cape Coral, FL | 3.0 | 2.0 | 1521 | $4,975 | $3.27 | 23d | 1 | 0.93mi |
| 2513 SW 31st St Cape Coral, FL | 3.0 | 2.0 | 1428 | $1,816 | $1.27 | 21d | 1 | 0.96mi |
| 1825 SW 25th St Cape Coral, FL | 3.0 | 2.0 | 1785 | $1,950 | $1.09 | 3d | 1 | 0.99mi |
| 2649 SW 32nd St Cape Coral, FL | 3.0 | 2.0 | 1864 | $2,750 | $1.48 | 23d | 1 | 1.10mi |
| 2609 Clairfont Ct Cape Coral, FL | 3.0 | 2.0 | 1726 | $2,800 | $1.62 | 23d | 1 | 1.11mi |
| 1726 SW 22nd St Cape Coral, FL | 3.0 | 2.0 | 1283 | $1,920 | $1.50 | 3d | 1 | 1.11mi |
| 2310 SW 17th Pl Cape Coral, FL | 1.0–2.0 | 1.0–2.0 | 1011 | $2,000 | $1.98 | 2d | 9 | 1.11mi |
| 3322 Oasis Blvd Cape Coral, FL | 3.0 | 2.0 | 1415 | $3,200 | $2.26 | 23d | 1 | 1.36mi |
| 2005 Chiquita Blvd S Cape Coral, FL | 3.0 | 2.0 | 1200 | $1,600 | $1.33 | 3d | 1 | 1.43mi |
| 1704 SW 17th Ave Cape Coral, FL | 3.0 | 3.0 | 2140 | $8,000 | $3.74 | 23d | 1 | 1.44mi |
| 3433 SW 27th Ave Cape Coral, FL | 3.0 | 2.0 | 2148 | $6,010 | $2.80 | 23d | 1 | 1.49mi |
| 1916 SW 15th Pl Cape Coral, FL | 3.0 | 2.0 | 1200 | $1,549 | $1.29 | 19d | 1 | 1.49mi |
Listing history 2 events
-
2026-06-16remarks 679-char remark
-
2026-06-16$279,900 Under Contract
ⓘ Source: listings_history table (triggers on properties + properties_extension) + one-shot
backfill from property_details.listing_events for pre-trigger history.
Climate risk First Street
- Flood 8/10 Severe FEMA zone X (shaded) · 99% chance over 30 yrs
- Wildfire 1/10 Low
- Heat 10/10 Extreme 6 d/yr ≥107°F today · 23 d/yr by 30 yrs out
- Wind 10/10 Extreme 99% chance of damaging wind over 30 yrs
- Air quality 2/10 Low 1 unhealthy d/yr today · 1 by 30 yrs out
Nearby sold comps map
Loading sold comps map…
Walkable amenities ~0.75 mi
Loading nearby amenities…
Taxation est. · year 1
- Rental income
- $30,022
- − Mortgage interest
- −$15,679
- − Property taxes
- −$4,198
- − Insurance
- −$2,197
- − Repairs & maintenance
- −$2,402
- − Management
- −$2,402
- − Depreciation
- −$8,143
- Taxable loss
- −$4,999
- Est. tax savings @ 24.0%
- +$1,200
- After-tax cash flow
- $907/yr
For passive investors: Depreciation is non-cash, so a rental often shows a tax loss while cash-flowing — sheltering income. Rental losses are passive: they offset passive income freely, and up to $25,000/yr can offset ordinary (W-2) income if you actively participate and your MAGI is under $100k (phasing out to $0 by $150k); unused losses carry forward. On sale, claimed depreciation is recaptured at up to 25%, and gains may owe capital-gains tax (a 1031 exchange can defer both). Figures are a year-1 estimate at your 24.0% rate — not tax advice; consult a CPA.
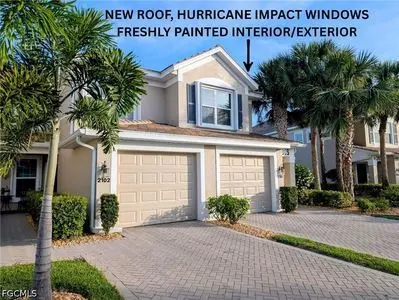
Condition & rehab AI · 2 photos
This home is in good condition with a fresh exterior paint job and well-maintained landscaping, making it a great candidate for both resale and rental.
Value-add opportunities
- Both Paint exterior — Enhances curb appeal and resale value
- Both Landscaping — Improves curb appeal and rental value
- Both HVAC maintenance — Ensures comfort and energy efficiency
Renovation cost estimate screening
Value-add ROI direction
- Both Paint exterior — Enhances curb appeal and resale value ↑
- Both Landscaping — Improves curb appeal and rental value ↑
- Both HVAC maintenance — Ensures comfort and energy efficiency ↑
ⓘ Cost ranges are severity-bucket heuristics (US national rule-of-thumb). Get contractor quotes + a written scope before underwriting a rehab budget.
Schools (NCES district)
- District
- Lee
- NCES district ID
- 1201080
- Math proficiency
- 47% ▼ -11.00%
- Reading proficiency
- 50% ▼ -4.00%
- Median HH income
- $49,518
- Composite
- 41.49/100
- National rank
- #3458
- State rank
- #42 of 73 in FL
Livability — Cape Coral
- Score
- 77/100
- State rank
- #208
- US rank
- #3098
Category grades
Schools grade is shown separately in the Schools card above.
Census & demographics
- Census place
- Cape Coral, FL
- County
- Lee County · 788,662 people
- City population
- 217,388
- Metro
- Cape Coral-Fort Myers, FL
- Population (ZIP)
- 27,725
- Household income
- $84,470
- Rent vs Own
- Severe rent burden
- 760.0
Population outlook (Lee County) Hauer SSP2
- Today (2025)
- 871,946 people
- By 2030
- 955,468 · +9.6%
- By 2040
- 1,113,587 · +27.7%
- By 2050
- 1,256,891 · +44.1%
- By 2075
- 1,560,270 · +78.9%
- By 2100
- 1,726,848 · +98.0%
Race, ethnicity, and origin ACS 2023
- Neighborhood character
- Predominantly White (71%)
- Race & ethnicity
- White 71% Hispanic / Latino 20% Two or more races 14% Black 3% Asian 1%
- Hispanic origin (detail)
- Mexican 1% Puerto Rican 6% Cuban 6%
- Common ancestry
- Romanian 5% Lithuanian 3% Italian 3%
- Foreign-born
- 13% · Canada, Jamaica
- Languages at home
- 81% English-only · Spanish 15% Russian/Polish/Slavic 1% Tagalog/Filipino 1%
Political lean MEDSL · Lee
- 2024 margin
- Strong R (+28.4) · D 35.5% · R 63.9%
- 2008→2024 swing
- -18.0pp toward R · 2008: -10.4pp · 2024: -28.4pp
- All cycles
- 2024: R+28.4 2020: R+19.2 2016: R+20.4 2012: R+16.6 2008: R+10.4
Not yet ingested
- Civics
- —
Market trends
- HPI YoY
- ▼ -108.25%
- Current HPI
- 281.0735
- Rent YoY
- ▼ -8.55%
- Metro
- Cape Coral-Fort Myers, FL
- State GDP YoY
- ▲ 3.28%
- F500 in state
- 36
Industry mix (Fortune 500 HQ in FL)
| Industry | F500 HQs | Revenue |
|---|---|---|
| Industrial Technology | 2 | $29B |
|
||
| Insurance | 2 | $17B |
|
||
| Retail | 1 | $60B |
|
||
| Technology Distribution | 1 | $58B |
|
||
| Homebuilding | 1 | $35B |
|
||
| Technology Manufacturing | 1 | $35B |
|
||
Price history
1 event — show timeline
- 2026-05-26 Listed $279,900 FSBO.com
Cash-flow waterfall
monthlySold comps — $/sqft
last 12 mo · ≤1 miLoading sold comps…