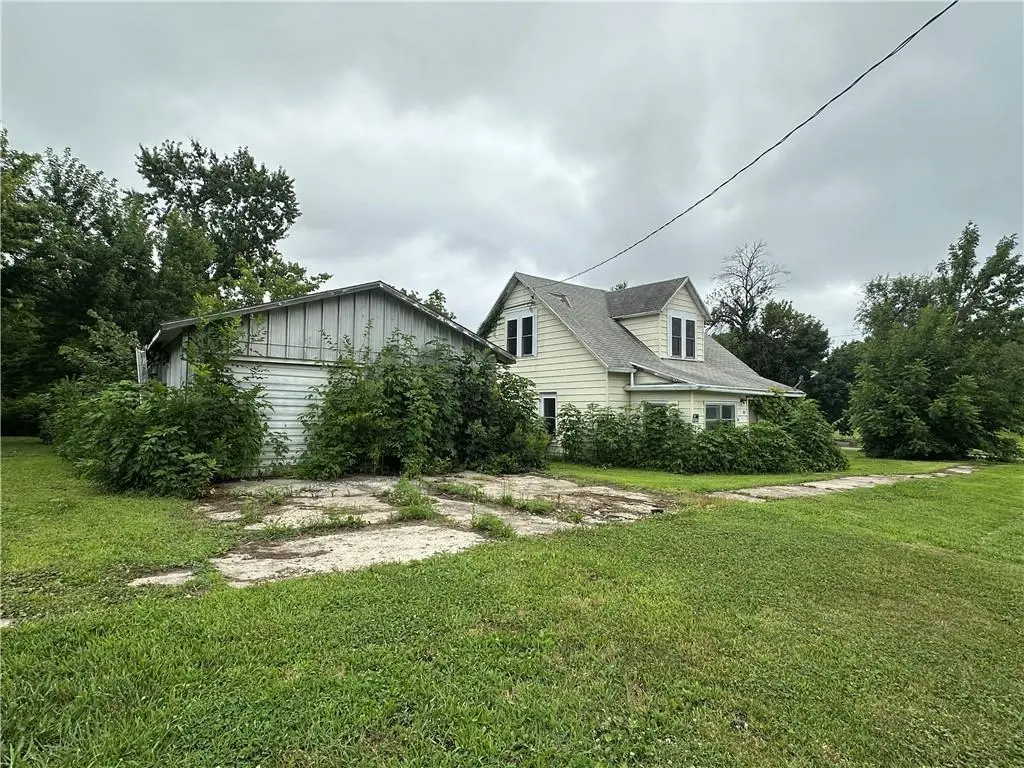
901 2nd St · Ridgeway, MO
Flood risk 1/10 · Minimal
- FEMA flood zone
- X
- Chance of flooding over 30 yrs
- 0.0%
- Est. flood insurance / yr
- $473 – $860
Fire risk 4/10 · Minor
- Est. fire insurance / yr
- $1,054 – $1,958
Heat risk 3/10 · Minor
- Hot days now (above 104°F)
- 7 days/yr
- Hot days in 30 yrs
- 15 days/yr
Wind risk 2/10 · Minimal
- Chance of severe wind over 30 yrs
- —
Air-quality risk 1/10 · Minimal
- Unhealthy air days now
- 0 days/yr
- Unhealthy air days in 30 yrs
- 0 days/yr
Risk factors via First Street. Map © Google.
Why this score? — see what drove the B grade
The composite is a weighted blend of 9 inputs, each scored 0–100. Each bar is that input's sub-score; the figure is the points it added to the 100-point composite (weight × sub-score).
- Cash flow +30.0/30.0
- 1% rule +10.0/10.0
- DSCR +10.0/10.0
- ARV discount +7.5/15.0
- Appreciation +5.0/10.0
- Livability +2.8/5.0
- Schools +2.7/10.0
- Rent growth +2.5/5.0
- Condition / age +2.5/5.0
$65,000
🖨 Deal sheet (PDF) 📄 Offer letter ✓ Due diligence
Listing remarks MLS
Here’s your chance to snag a value-add property on a spacious corner lot in Northwest Missouri—just off I-35 for easy access. This fixer-upper sits on over half an acre and has the bones to become a great flip, rental, or primary residence with sweat equity. The main level features: • Kitchen, living room, dining room, bathroom, and utility room • Updated flooring, fresh paint, and newer windows already done for you Upstairs offers three bedrooms ready for your finishing touches. Outside, the lot delivers bonus value with two outbuildings: • A 20x20 two-car garage • A 29x23 Steel building—perfect for storage, a workshop, or extra rental space If you’re looking for real estate opportunities, this one checks a lot of boxes for the right buyer. Whether you’re an investor, flipper, or hands-on homeowner, this property has plenty of potential and room to grow. Bring your tools, bring your vision, and let’s make it happen!
Key facts
- Over half an acre
- Fresh paint
- Two outbuildings
Tags
Neighborhood map
What this means for you Summary
Snapshot
- This is a 3-bed/1.0-bath other listed at $65k.
Deal economics
- At list price, monthly cash flow is $435 ($5k/yr) — positive.
- The deal already cash-flows at list — no discount required.
- Meets the 1% rule at list price ($1k rent vs $65k).
- Recommended offer: $57k (12.0% below list) — sets the bar for market timing.
Location & tenants
- Location reads 56/100 on livability (#679 in MO) — a working-class tenant base; expect higher turnover. Strengths: cost of living A+, housing A+; Watch: schools D, crime F, amenities F.
- Ridgeway R-V (rural): math 20% / reading 40% proficiency, ranked #467 of 535 in MO (top 87%) — families likely to look elsewhere, expect single-tenant / working-renter base with shorter leases.
- Market conditions: 6 active listings in the ZIP; 2 units permitted in Harrison County in 2024 (0 in 5+ unit buildings).
Forward outlook
- In year one you build about $2k of equity ($449 loan paydown + $2k appreciation (3.0% local appreciation)).
- Harrison County population projected at -22% by 2050 — secular population decline; favor cash flow + early exit over multi-decade hold.
- At projected returns (3.0% appreciation + 3.0% rent growth), your $18k cash investment doubles in ~3 years — after that, you're playing with house money.
Negotiation context
- It's been on market 334 days — a 12% lower offer ($57k) is reasonable based on typical stale-listing flexibility.
Risks & watch-outs
- Watch-outs: built in 1900 — expect roof / HVAC / electrical / plumbing capex.
Questions for the listing agent
- It's been on market 334 days. Have you received any prior offers? Is the seller open to a 12% concession, seller financing, or rate buy-down credit?
- Built in 1900 — when were the roof, HVAC, electrical panel, plumbing, and water heater last replaced?
- Why hasn't it sold? Are there any deal-killer items the seller is aware of (foundation, flood, title, zoning, code violations)?
- Is there a deadline driving the sale (1031 exchange, divorce, estate, relocation)? That informs how much negotiation room exists.
- Schools are D-rated, which usually means shorter tenancies and higher turnover. Who's the typical renter profile here, and what's been the actual vacancy rate?
- Crime grade is F in this area — have there been break-ins, vandalism, or insurance claims at this property in the last 3 years? What carrier currently insures it and at what premium?
- What's the average days-on-market for RENTAL listings here right now (not sales)? A rising rental-DOM trend means longer vacancies and softer asking-rent achievability than the comps imply.
- What's the recent tenant-quality profile in this submarket — average credit score on applications, eviction rate, late-payment / NSF rate, and stable-employment percentage? A property-management company in the area should have these aggregated.
- How much new for-sale + rental construction is in the pipeline within 1–3 miles? Heavy new supply typically softens prices + rents 12–24 months out; constrained supply supports both.
Investment metrics
- 1% rule
- 1.60% ✓
- Cap rate
- 14.32%
- Cash-on-cash
- 28.67%
- DSCR
- 2.28
- GRM
- 5.2
CMA / ARV
- ARV (median comp)
- $133,614
- List price
- $65,000
- Delta
- -51.35%
- Verdict
- UNDERPRICED
- Comps
- 2 within 1.0 mi
Projected returns pro-forma
3.0% appreciation · 3.0% rent growth · sell at horizon
- IRR
- 34.6%
- Equity multiple
- 2.95×
- Total profit
- $35,505
- Equity at exit
- $29,227
- IRR
- 34.7%
- Equity multiple
- 5.81×
- Total profit
- $87,562
- Equity at exit
- $45,042
Cash invested: $18,200 (down + closing). Projections, not guarantees.
Landlord ↔ Tenant lean methodology
- Overall (STATE)
- 81 Strongly Landlord-Friendly
- State Missouri
- 81 Strongly Landlord-Friendly · R+10
- County
- — inherits STATE
- City
- — inherits STATE
ZIP-level market 64481
- Active inventory
- 6
- Price-to-rent
- 5.2×
Monthly cashflow live
- Estimated rent
- $1,043 medium interval (Pro) →
- Mortgage (P&I)
- −$341
- Tax from tax record
- −$21 /mo · $256/yr
- Insurance
- −$27
- HOA
- −$0
- Vacancy / Maint / Mgmt
- −$219
- Net cashflow
- $435
Break-even live
Sensitivity live
| Price | -10% $472 | -5% $453 | +0% $435 | +5% $416 | +10% $398 |
|---|---|---|---|---|---|
| Rent | -10% $352 | -5% $394 | +0% $435 | +5% $476 | +10% $517 |
| Rate | -1.0pp $468 | -0.5pp $451 | base $435 | +0.5pp $418 | +1.0pp $401 |
UW: 25.0% down · 7.5% · 30yr · 1.5% tax · 5.0% vac · 8.0% maint · 8.0% mgmt
Financing live
Cash to close
- Down payment
- $16,250
- Closing costs
- $1,950
- Reserves months
- —
- Total cash needed
- —
Loan-product check · same deal, 3 products live
Conventional
25% down · 7.5% · 30yr
- Down + closing
- —
- Monthly P&I
- —
- Monthly cashflow
- —
- DSCR
- —
- Eligible?
- —
Personal DTI + credit; lowest rate.
DSCR
20% down · 8.5% · 30yr
- Down + closing
- —
- Monthly P&I
- —
- Monthly cashflow
- —
- DSCR
- —
- Eligible?
- —
No personal income docs; deal must DSCR.
Hard money
10% down · 12.0% · 12mo
- Down + closing
- —
- Monthly P&I
- —
- Monthly cashflow
- —
- DSCR
- —
- Eligible?
- —
Short-term bridge; refi at stabilization.
Listing history 20 events
-
2026-06-21days on market $65,000 Active 334 DOM
-
2026-06-18days on market $65,000 Active 332 DOM
-
2026-06-17days on market $65,000 Active 331 DOM
-
2026-06-16days on market $65,000 Active 330 DOM
-
2026-06-15days on market $65,000 Active 329 DOM
-
2026-06-13days on market $65,000 Active 327 DOM
-
2026-06-12days on market $65,000 Active 326 DOM
-
2026-06-09days on market $65,000 Active 323 DOM
-
2026-06-08days on market $65,000 Active 322 DOM
-
2026-06-07days on market $65,000 Active 321 DOM
-
2026-06-07days on market $65,000 Active 320 DOM
-
2026-06-04days on market $65,000 Active 317 DOM
-
2026-06-02days on market $65,000 Active 316 DOM
-
2026-06-01days on market $65,000 Active 315 DOM
-
2026-05-31days on market $65,000 Active 314 DOM
-
2025-07-21$65,000 Active 1000-char remark
Show marketing remark (1000 chars)
Here’s your chance to snag a value-add property on a spacious corner lot in Northwest Missouri—just off I-35 for easy access. This fixer-upper sits on over half an acre and has the bones to become a great flip, rental, or primary residence with sweat equity. The main level features: • Kitchen, living room, dining room, bathroom, and utility room • Updated flooring, fresh paint, and newer windows already done for you Upstairs offers three bedrooms ready for your finishing touches. Outside, the lot delivers bonus value with two outbuildings: • A 20x20 two-car garage • A 29x23 Steel building—perfect for storage, a workshop, or extra rental space If you’re looking for real estate opportunities, this one checks a lot of boxes for the right buyer. Whether you’re an investor, flipper, or hands-on homeowner, this property has plenty of potential and room to grow. Bring your tools, bring your vision, and let’s make it happen!
-
2003-07-08soldstatus
-
2002-05-01soldstatus
-
2000-11-03soldstatus
-
1987-10-26soldstatus
ⓘ Source: listings_history table (triggers on properties + properties_extension) + one-shot
backfill from property_details.listing_events for pre-trigger history.
Tax reassessment forecast MO · Resets to sale price
- Current annual tax
- $256 · $21/mo
- Projected year-2 tax
- $630 · $53/mo
- Expected delta
- +$374/yr (+$31/mo · 146.1%)
ⓘ Screening estimate from a state-policy table — verify with the county assessor before closing.
Climate risk First Street
- Flood 1/10 Low FEMA zone X · 0% chance over 30 yrs
- Wildfire 4/10 Moderate
- Heat 3/10 Moderate 7 d/yr ≥104°F today · 15 d/yr by 30 yrs out
- Wind 2/10 Low
- Air quality 1/10 Low 0 unhealthy d/yr today · 0 by 30 yrs out
Nearby sold comps map
Loading sold comps map…
Walkable amenities ~0.75 mi
Loading nearby amenities…
Taxation est. · year 1
- Rental income
- $12,519
- − Mortgage interest
- −$3,641
- − Property taxes
- −$256
- − Insurance
- −$325
- − Repairs & maintenance
- −$1,002
- − Management
- −$1,002
- − Depreciation
- −$1,891
- Taxable income
- $4,403
- Est. tax owed @ 24.0%
- −$1,057
- After-tax cash flow
- $4,162/yr
For passive investors: Depreciation is non-cash, so a rental often shows a tax loss while cash-flowing — sheltering income. Rental losses are passive: they offset passive income freely, and up to $25,000/yr can offset ordinary (W-2) income if you actively participate and your MAGI is under $100k (phasing out to $0 by $150k); unused losses carry forward. On sale, claimed depreciation is recaptured at up to 25%, and gains may owe capital-gains tax (a 1031 exchange can defer both). Figures are a year-1 estimate at your 24.0% rate — not tax advice; consult a CPA.
Schools (NCES district)
- District
- Ridgeway R-V
- NCES district ID
- 2926490
- Math proficiency
- 20% ▼ -10.00%
- Reading proficiency
- 40% ▬ 0.00%
- Median HH income
- $33,412
- Composite
- 27.42/100
- National rank
- #12393
- State rank
- #467 of 535 in MO
Livability — Ridgeway
- Score
- 56/100
- State rank
- #679
- US rank
- #22452
Category grades
Schools grade is shown separately in the Schools card above.
Census & demographics
- Census place
- Ridgeway, MO
- Population (ZIP)
- 1,179
Population outlook (Harrison County) Hauer SSP2
- Today (2025)
- 7,893 people
- By 2030
- 7,511 · -4.8%
- By 2040
- 6,811 · -13.7%
- By 2050
- 6,131 · -22.3%
- By 2075
- 4,814 · -39.0%
- By 2100
- 3,643 · -53.8%
Race, ethnicity, and origin ACS 2023
- Neighborhood character
- Predominantly White (99%)
- Race & ethnicity
- White 99%
- Common ancestry
- Iranian 7% Slovak 3% German 1%
- Languages at home
- 99% English-only · German/W. Germanic 1% Spanish 1%
Political lean MEDSL · Harrison
- 2024 margin
- Solid R (+71.8) · D 13.9% · R 85.6%
- 2008→2024 swing
- -40.5pp toward R · 2008: -31.3pp · 2024: -71.8pp
- All cycles
- 2024: R+71.8 2020: R+68.0 2016: R+64.9 2012: R+44.4 2008: R+31.3
Not yet ingested
- Civics
- —
Market trends
- HPI YoY
- —
- Current HPI
- —
- Rent YoY
- —
- Metro
- —
- State GDP YoY
- ▲ 1.84%
- F500 in state
- 20
Industry mix (Fortune 500 HQ in MO)
| Industry | F500 HQs | Revenue |
|---|---|---|
| Healthcare | 1 | $163B |
|
||
| Insurance | 1 | $21B |
|
||
| Industrial Technology | 1 | $17B |
|
||
| Retail | 1 | $16B |
|
||
| Industrial Distribution | 1 | $10B |
|
||
| Utilities | 1 | $9B |
|
||
Price history
5 events — show timeline
- 2025-07-21 Listed $65,000 Heartland MLS as Distributed by MLS Grid
- 2003-07-08 Sold (Public Records) — Public Records
- 2002-05-01 Sold (Public Records) — Public Records
- 2000-11-03 Sold (Public Records) — Public Records
- 1987-10-26 Sold (Public Records) — Public Records
Property tax history
-0.5%/yrLatest (2025): $256 · -21.9% YoY. Source: county tax records.
Cash-flow waterfall
monthlySold comps — $/sqft
last 12 mo · ≤1 miLoading sold comps…