 5-Plex
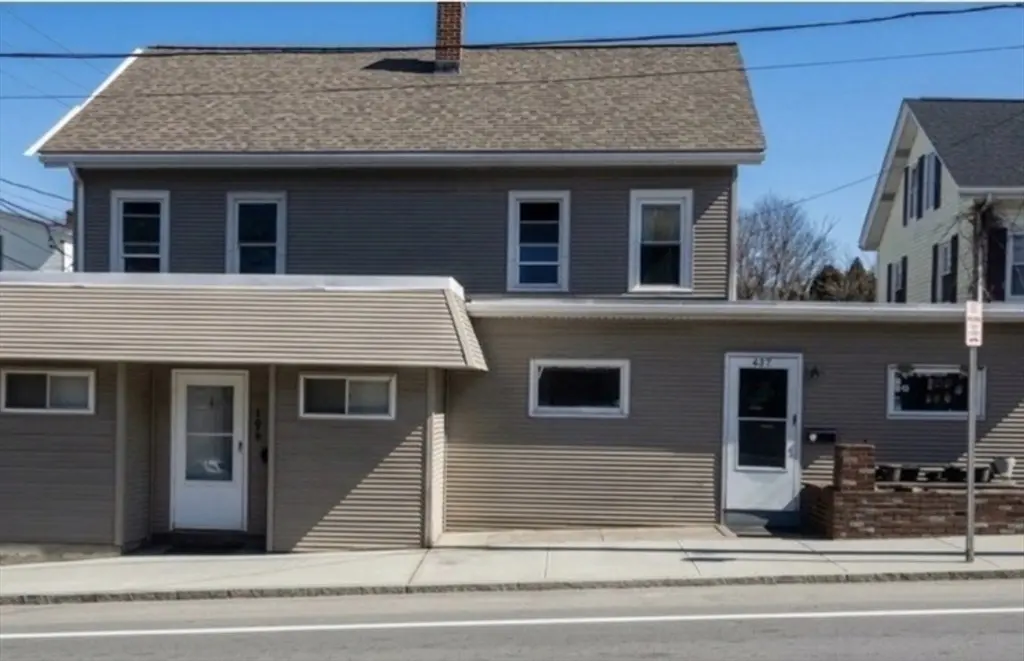
407-409 Broad St · Cumberland, RI
Flood risk 1/10 · Minimal
- FEMA flood zone
- X (unshaded)
- Chance of flooding over 30 yrs
- 0.0%
- Est. flood insurance / yr
- $473 – $860
Fire risk 1/10 · Minimal
- Est. fire insurance / yr
- $835 – $1,551
Heat risk 5/10 · Moderate
- Hot days now (above 96°F)
- 7 days/yr
- Hot days in 30 yrs
- 15 days/yr
Wind risk 6/10 · Moderate
- Chance of severe wind over 30 yrs
- 69.0%
Air-quality risk 2/10 · Minimal
- Unhealthy air days now
- 1 days/yr
- Unhealthy air days in 30 yrs
- 2 days/yr
Risk factors via First Street. Map © Google.
Why this score? — see what drove the C+ grade
The composite is a weighted blend of 9 inputs, each scored 0–100. Each bar is that input's sub-score; the figure is the points it added to the 100-point composite (weight × sub-score).
- Cash flow +30.0/30.0
- 1% rule +10.0/10.0
- DSCR +10.0/10.0
- Schools +4.2/10.0
- Livability +2.5/5.0
- Condition / age +2.5/5.0
- Rent growth +2.1/5.0
- ARV discount +1.1/15.0
- Appreciation +0.0/10.0
$795,000
🖨 Deal sheet 📄 Offer letter ✓ Due diligence
Multi-family units
County records classify this as Multi-Family (5+ Unit). Listing-text estimate: 5 units. confirmed
5+ unit building — per-unit beds/baths from public records are typically unavailable; the breakdown below (if shown) is an estimate from the listing text.
Listing remarks MLS
Welcome to this Spacious 5-unit multifamily located at 407–409 Broad Street, Cumberland, Rhode Island, offering excellent rental income potential. This property is a great investment opportunity with strong cash-flow possibilities. Conveniently located near schools, public transportation, and shopping centers, making it attractive for tenants. Don’t miss the opportunity to own a multifamily in a desirable Cumberland location with great upside potential. ready for a new owner
Key facts
- Near schools
- Shopping centers
- Strong cash-flow
Tags
Neighborhood map
What this means for you Summary
Snapshot
- This is a 5 × 6-bed/5.0-bath units multifamily listed at $795k.
Deal economics
- At list price, monthly cash flow is $6k ($68k/yr) — positive. Per door: $1k/mo.
- The deal already cash-flows at list — no discount required.
- Meets the 1% rule at list price ($14k rent vs $795k).
- Recommended offer: $723k (9.0% below list) — sets the bar for market timing.
Location & tenants
- Location reads: area grade C — affects rentability + tenant quality, not the cash-flow math above.
- Cumberland (suburban): math 40% / reading 52% proficiency, ranked #9 of 39 in RI (top 23%) — families likely to look elsewhere, expect single-tenant / working-renter base with shorter leases; only 18% free/reduced lunch — higher-income household profile.
- Market conditions: Rents soft (-1.5%/yr); 141 active listings in the ZIP; high-income renter base; 776 units permitted in Providence County in 2024 (229 in 5+ unit buildings).
- At $13,524/mo this rent would consume 138% of the median local household income ($118k/yr) (locally 771% of renters already pay >50% of income on rent) — very limited rent-growth headroom before tenants either downsize or default.
Forward outlook
- Local home prices are declining (-3.0%/yr); year-one equity from $5k of loan paydown is wiped out by about $24k of value loss. Plan a longer hold.
- Providence County population projected at +5% by 2050 — modest demand growth; plan on rents tracking national, not racing it.
- At projected returns (-3.0% appreciation + 0.0% rent growth), your $223k cash investment doubles in ~5 years — after that, you're playing with house money.
Negotiation context
- It's been on market 99 days — a 9% lower offer ($723k) is reasonable based on typical stale-listing flexibility.
- Current owner paid $352k; list at $795k implies a 126% gain — meaningful room to come down on a strong offer.
Risks & watch-outs
- Watch-outs: built in 1900 — expect roof / HVAC / electrical / plumbing capex.
- Climate carrying-cost: major wind risk, 69% chance of damaging wind over 30y; extreme-heat days projected 7→15/yr by 2055 (HVAC capex compounding) — expect insurance premiums to compound above CPI over the hold.
Questions for the listing agent
- It's been on market 99 days. Have you received any prior offers? Is the seller open to a 9% concession, seller financing, or rate buy-down credit?
- Can we see the unit-by-unit rent roll, current vacancy, and any below-market leases? What's the average tenancy length?
- What capital expenditures (roof, boiler, parking lot, exteriors) have been made in the last 5 years, and what's planned in the next 2?
- Built in 1900 — when were the roof, HVAC, electrical panel, plumbing, and water heater last replaced?
- Why hasn't it sold? Are there any deal-killer items the seller is aware of (foundation, flood, title, zoning, code violations)?
- Is there a deadline driving the sale (1031 exchange, divorce, estate, relocation)? That informs how much negotiation room exists.
- What's the average days-on-market for RENTAL listings here right now (not sales)? A rising rental-DOM trend means longer vacancies and softer asking-rent achievability than the comps imply.
- What's the recent tenant-quality profile in this submarket — average credit score on applications, eviction rate, late-payment / NSF rate, and stable-employment percentage? A property-management company in the area should have these aggregated.
- How much new apartment / multifamily construction is in the pipeline within 1–3 miles? Heavy new supply (>2% of stock underway) typically softens rents 12–24 months out; light construction supports rent growth.
Investment metrics
- 1% rule
- 1.70% ✓
- Cap rate
- 14.79%
- Cash-on-cash
- 30.33%
- DSCR
- 2.35
- GRM
- 4.9
CMA / ARV
- ARV (median comp)
- $696,048
- List price
- $795,000
- Delta
- 14.22%
- Verdict
- OVERPRICED
- Comps
- 20 within 1.0 mi
Show comp detail 2 sales within ~0.75 mi
| Address | Dist | Beds/Ba | Sqft | Sold | Price | $/sf | Match |
|---|---|---|---|---|---|---|---|
| 309 High St | 0.23mi | 5/2.5 | 3,255 (-15%) | 7mo | $549,000 | $169 | 48 |
| 125 Londsdale Main St | 0.51mi | 6/3.5 (+1) | 3,888 (+2%) | 19mo | $510,000 | $131 | 46 |
Match score weights: distance 35% · size 25% · config 20% · recency 20%. Top-matched comps best support the ARV.
Projected returns pro-forma
-3.0% appreciation · 0.0% rent growth · sell at horizon
- IRR
- 21.7%
- Equity multiple
- 1.85×
- Total profit
- $189,868
- Equity at exit
- $118,537
- IRR
- 27.8%
- Equity multiple
- 3.13×
- Total profit
- $473,388
- Equity at exit
- $68,737
Cash invested: $222,600 (down + closing). Projections, not guarantees.
Landlord ↔ Tenant lean methodology
- Overall (STATE)
- 31 Tenant-Leaning
- State Rhode Island
- 31 Tenant-Leaning · D+8
- County
- — inherits STATE
- City
- — inherits STATE
ZIP-level market 02864
- Rents YoY
- -1.5%
- Active inventory
- 141
- Price-to-rent
- 24.5×
Monthly cashflow live
- Estimated rent
- $13,524 medium interval (Pro) →
- Mortgage (P&I)
- −$4,169
- Tax from tax record
- −$557 /mo · $6,679/yr
- Insurance
- −$331
- HOA
- −$0
- Vacancy / Maint / Mgmt
- −$2,840
- Net cashflow
- $5,627
Break-even live
5-unit breakdown (identical units grouped — click to expand)
| Units | Beds | Baths | Est. rent |
|---|---|---|---|
| 5× units | 6 | 5 | $13,525 |
| #1 | 6 | 5 | $2,705 |
| #2 | 6 | 5 | $2,705 |
| #3 | 6 | 5 | $2,705 |
| #4 | 6 | 5 | $2,705 |
| #5 | 6 | 5 | $2,705 |
| Total (5 units) | $13,524 | ||
UW: 25.0% down · 7.5% · 30yr · 1.5% tax · 5.0% vac · 8.0% maint · 8.0% mgmt
Financing live
Cash to close
- Down payment
- $198,750
- Closing costs
- $23,850
- Reserves months
- —
- Total cash needed
- —
Loan-product check · same deal, 3 products live
Conventional
25% down · 7.5% · 30yr
- Down + closing
- —
- Monthly P&I
- —
- Monthly cashflow
- —
- DSCR
- —
- Eligible?
- —
Personal DTI + credit; lowest rate.
DSCR
20% down · 8.5% · 30yr
- Down + closing
- —
- Monthly P&I
- —
- Monthly cashflow
- —
- DSCR
- —
- Eligible?
- —
No personal income docs; deal must DSCR.
Hard money
10% down · 12.0% · 12mo
- Down + closing
- —
- Monthly P&I
- —
- Monthly cashflow
- —
- DSCR
- —
- Eligible?
- —
Short-term bridge; refi at stabilization.
Listing history 16 events
-
2026-06-18days on market $795,000 Active 99 DOM
-
2026-06-17days on market $795,000 Active 98 DOM
-
2026-06-16days on market $795,000 Active 97 DOM
-
2026-06-15days on market $795,000 Active 96 DOM
-
2026-06-13days on market $795,000 Active 94 DOM
-
2026-06-09days on market $795,000 Active 90 DOM
-
2026-06-08days on market $795,000 Active 89 DOM
-
2026-06-07days on market $795,000 Active 88 DOM
-
2026-06-05days on market $795,000 Active 85 DOM
-
2026-06-03days on market $795,000 Active 84 DOM
-
2026-06-02days on market $795,000 Active 83 DOM
-
2026-06-01days on market $795,000 Active 82 DOM
-
2026-05-31days on market $795,000 Active 81 DOM
-
2026-03-11$795,000 New 491-char remark
Show marketing remark (491 chars)
Welcome to this Spacious 5-unit multifamily located at 407–409 Broad Street, Cumberland, Rhode Island, offering excellent rental income potential. This property is a great investment opportunity with strong cash-flow possibilities. Conveniently located near schools, public transportation, and shopping centers, making it attractive for tenants. Don’t miss the opportunity to own a multifamily in a desirable Cumberland location with great upside potential. ready for a new owner
-
2021-06-17soldstatus $352,000
-
2020-12-23soldstatus $250,000
ⓘ Source: listings_history table (triggers on properties + properties_extension) + one-shot
backfill from property_details.listing_events for pre-trigger history.
Tax reassessment forecast RI · Partial reset (capped growth)
- Current annual tax
- $6,679 · $557/mo
- Projected year-2 tax
- $9,819 · $818/mo
- Expected delta
- +$3,140/yr (+$262/mo · 47.0%)
ⓘ Screening estimate from a state-policy table — verify with the county assessor before closing.
Climate risk First Street
- Flood 1/10 Low FEMA zone X (unshaded) · 0% chance over 30 yrs
- Wildfire 1/10 Low
- Heat 5/10 Major 7 d/yr ≥96°F today · 15 d/yr by 30 yrs out
- Wind 6/10 Major 69% chance of damaging wind over 30 yrs
- Air quality 2/10 Low 1 unhealthy d/yr today · 2 by 30 yrs out
Nearby sold comps map
Loading sold comps map…
Walkable amenities ~0.75 mi
Loading nearby amenities…
Taxation est. · year 1
- Rental income
- $162,288
- − Mortgage interest
- −$44,532
- − Property taxes
- −$6,679
- − Insurance
- −$3,975
- − Repairs & maintenance
- −$12,983
- − Management
- −$12,983
- − Depreciation
- −$23,127
- Taxable income
- $58,008
- Est. tax owed @ 24.0%
- −$13,922
- After-tax cash flow
- $53,603/yr
For passive investors: Depreciation is non-cash, so a rental often shows a tax loss while cash-flowing — sheltering income. Rental losses are passive: they offset passive income freely, and up to $25,000/yr can offset ordinary (W-2) income if you actively participate and your MAGI is under $100k (phasing out to $0 by $150k); unused losses carry forward. On sale, claimed depreciation is recaptured at up to 25%, and gains may owe capital-gains tax (a 1031 exchange can defer both). Figures are a year-1 estimate at your 24.0% rate — not tax advice; consult a CPA.
Schools (NCES district)
- District
- Cumberland
- NCES district ID
- 4400270
- Math proficiency
- 40% ▼ -13.00%
- Reading proficiency
- 52% ▼ -10.00%
- Median HH income
- $75,407
- Composite
- 41.85/100
- National rank
- #3382
- State rank
- #9 of 39 in RI
Livability — Cumberland
No livability data for this city. (Only ~50 U.S. cities are tracked.)
Census & demographics
- Census place
- Valley Falls, RI
- County
- Providence County · 548,917 people
- City population
- 36,820
- Metro
- Providence-Warwick, RI-MA
- Population (ZIP)
- 36,820
- Household income
- $117,522
- Rent vs Own
- Severe rent burden
- 771.0
Population outlook (Providence County) Hauer SSP2
- Today (2025)
- 653,469 people
- By 2030
- 660,819 · +1.1%
- By 2040
- 672,747 · +3.0%
- By 2050
- 683,741 · +4.6%
- By 2075
- 720,435 · +10.2%
- By 2100
- 741,582 · +13.5%
Race, ethnicity, and origin ACS 2023
- Neighborhood character
- Predominantly White (83%)
- Race & ethnicity
- White 83% Hispanic / Latino 6% Two or more races 5% Asian 4% Black 3%
- Hispanic origin (detail)
- Puerto Rican 2%
- Common ancestry
- Lithuanian 11% Russian 10% Romanian 6%
- Foreign-born
- 11% · Canada, Jamaica, China
- Languages at home
- 83% English-only · Other Indo-European 7% Spanish 4% French/Haitian/Cajun 2%
Political lean MEDSL · Providence
- 2024 margin
- D (+14.4) · D 56.1% · R 41.7% · Other 2.2%
- 2008→2024 swing
- -20.0pp toward R · 2008: 34.4pp · 2024: 14.4pp
- All cycles
- 2024: D+14.4 2020: D+22.9 2016: D+21.2 2012: D+34.9 2008: D+34.4
Not yet ingested
- Civics
- —
Market trends
- HPI YoY
- ▼ -461.15%
- Current HPI
- 313.0341
- Rent YoY
- ▼ -1.48%
- Metro
- Providence-Warwick, RI-MA
- State GDP YoY
- ▲ 2.25%
- F500 in state
- 10
Industry mix (Fortune 500 HQ in RI)
| Industry | F500 HQs | Revenue |
|---|---|---|
| Healthcare | 1 | $373B |
|
||
| Food Distribution | 1 | $31B |
|
||
| Aerospace / Defense | 1 | $14B |
|
||
| Financial Services | 1 | $8B |
|
||
| Consumer Goods | 1 | $4B |
|
||
Price history
+218.0% since first listed3 events — show timeline
- 2026-03-11 Listed $795,000 MLS PIN
- 2021-06-17 Sold (Public Records) $352,000 Public Records
- 2020-12-23 Sold (Public Records) $250,000 Public Records
Property tax history
+3.5%/yrLatest (2025): $6,679 · +2.7% YoY. Source: county tax records.
Cash-flow waterfall
monthlySold comps — $/sqft
last 12 mo · ≤1 miLoading sold comps…