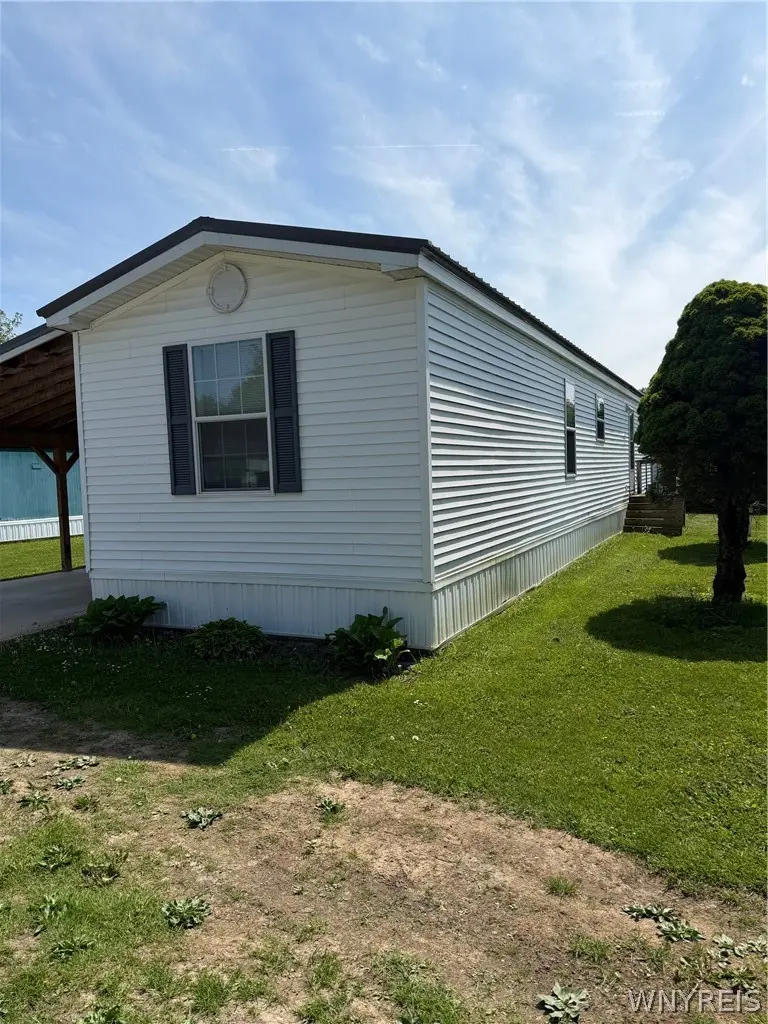
330 Parkview Dr · Arcade, NY
Flood risk 7/10 · Major
- FEMA flood zone
- X
- Chance of flooding over 30 yrs
- 0.99%
- Est. flood insurance / yr
- $507 – $1,088
Fire risk 1/10 · Minimal
- Est. fire insurance / yr
- $691 – $1,283
Heat risk 2/10 · Minimal
- Hot days now (above 90°F)
- 8 days/yr
- Hot days in 30 yrs
- 19 days/yr
Wind risk 1/10 · Minimal
- Chance of severe wind over 30 yrs
- —
Air-quality risk 2/10 · Minimal
- Unhealthy air days now
- 0 days/yr
- Unhealthy air days in 30 yrs
- 1 days/yr
Risk factors via First Street. Map © Google.
Why this score? — see what drove the B+ grade
The composite is a weighted blend of 9 inputs, each scored 0–100. Each bar is that input's sub-score; the figure is the points it added to the 100-point composite (weight × sub-score).
- Cash flow +30.0/30.0
- 1% rule +10.0/10.0
- DSCR +10.0/10.0
- Appreciation +7.8/10.0
- ARV discount +7.5/15.0
- Schools +4.4/10.0
- Livability +3.2/5.0
- Rent growth +2.5/5.0
- Condition / age +2.2/5.0
$58,000
🖨 Deal sheet 📄 Offer letter ✓ Due diligence
Listing remarks
2 bedroom / 1 bath move in ready home. Open concept living makes this space feel larger. Carport and shed 5 years old. Appliances included. Quiet community, close to stores.
Key facts
- Open concept living
- Shed
- Carport
Tags
Property features AI
Finance
- Financial info: Monthly land lease: $395
- HOA & community: Has land lease
Exterior
- Parking: Carport
- Utilities: Public water connected; Sewer connected
- Home design: Single-wide mobile home (Marlette); Single-story
- Construction: Vinyl siding; Pillar/post/pier foundation; Existing (previously built)
- Exterior features: Concrete driveway; Irregular lot
Interior
- Kitchen: Gas oven; Gas range; Electric water heater
- Bedrooms: 2 bedrooms on the main level
- Flooring: Carpet; Luxury vinyl; Varied flooring
- Bathrooms: 1 full bathroom on the main level
- Heating & cooling: Gas forced-air heating
- Interior features: Eat-in kitchen; Bedroom on main level
- Laundry & utility: Main level laundry
Neighborhood map
What this means for you Summary
Snapshot
- This is a 2-bed/1.0-bath manufactured listed at $58k. Condition is rated fair.
Deal economics
- At list price, monthly cash flow is $335 ($4k/yr) — positive.
- The deal already cash-flows at list — no discount required.
- Meets the 1% rule at list price ($1k rent vs $58k).
- Recommended offer: $57k (1.5% below list) — sets the bar for market timing.
Location & tenants
- Location reads 64/100 on livability (#774 in NY) — a middle-class / working-renter tenant base. Strengths: housing A+, cost of living A, crime A-; Watch: schools C-, amenities F, commute F.
- Yorkshire-Pioneer Central School District (town): math 50% / reading 54% proficiency, ranked #358 of 590 in NY (top 61%) — acceptable for families but not a draw, mixed tenant base, ~2y average lease.
- Market conditions: 39 active listings in the ZIP; 1 comparable units currently listed for rent nearby; 83 units permitted in Wyoming County in 2024 (0 in 5+ unit buildings).
Forward outlook
- In year one you build about $4k of equity ($401 loan paydown + $3k appreciation (5.7% local appreciation)).
- Wyoming County population projected at -16% by 2050 — secular population decline; favor cash flow + early exit over multi-decade hold.
- At projected returns (5.7% appreciation + 3.0% rent growth), your $16k cash investment doubles in ~3 years — after that, you're playing with house money.
- By year 9, paydown + projected appreciation supports a ~$33k cash-out refi (75% LTV) — recoverable capital for the next deal without selling this one.
Negotiation context
- It's been on market 21 days — a 2% lower offer ($57k) is reasonable based on typical stale-listing flexibility.
Risks & watch-outs
- Watch-outs: flood insurance adds $66/mo.
- Climate carrying-cost: major flood risk — expect insurance premiums to compound above CPI over the hold.
Questions for the listing agent
- Have any recent inspections been done? Can we get a copy of the seller's disclosures and any deferred-maintenance estimates?
- What's the actual annual flood-insurance premium (NFIP or private), and is the property in a SFHA with mandatory coverage?
- Is there a deadline driving the sale (1031 exchange, divorce, estate, relocation)? That informs how much negotiation room exists.
- What's the average days-on-market for RENTAL listings here right now (not sales)? A rising rental-DOM trend means longer vacancies and softer asking-rent achievability than the comps imply.
- What's the recent tenant-quality profile in this submarket — average credit score on applications, eviction rate, late-payment / NSF rate, and stable-employment percentage? A property-management company in the area should have these aggregated.
- How much new for-sale + rental construction is in the pipeline within 1–3 miles? Heavy new supply typically softens prices + rents 12–24 months out; constrained supply supports both.
Investment metrics
- 1% rule
- 1.75% ✓
- Cap rate
- 14.59%
- Cash-on-cash
- 29.63%
- DSCR
- 2.32
- GRM
- 4.8
CMA / ARV
- ARV (on-the-fly)
- $36,960
- Comps found
- 6
Show comp detail 6 sales within ~0.75 mi
| Address | Dist | Beds/Ba | Sqft | Sold | Price | $/sf | Match |
|---|---|---|---|---|---|---|---|
| 12 Southview Dr | 0.04mi | 2/1.0 | 784 (-7%) | 4mo | $88,500 | $113 | 84 |
| 319 Parkview Dr | 0.01mi | 3/2.0 (+1) | 952 (+13%) | 4mo | $42,000 | $44 | 65 |
| 56 Aristo Ter | 0.46mi | 2/1.0 | 840 (0%) | 19mo | $25,000 | $30 | 63 |
| 89 Autumnview Dr | 0.14mi | 2/1.0 | 924 (+10%) | 19mo | $14,500 | $16 | 61 |
| 329 Parkview Dr | 0.01mi | 1/1.0 (-1) | 720 (-14%) | 23mo | $15,800 | $22 | 52 |
| 433 Bristol Ln | 0.37mi | 3/2.0 (+1) | 880 (+5%) | 18mo | $84,000 | $95 | 51 |
Match score weights: distance 35% · size 25% · config 20% · recency 20%. Top-matched comps best support the ARV.
Projected returns pro-forma
5.65% appreciation · 3.0% rent growth · sell at horizon
- IRR
- 35.6%
- Equity multiple
- 3.27×
- Total profit
- $36,907
- Equity at exit
- $35,180
- IRR
- 33.4%
- Equity multiple
- 6.69×
- Total profit
- $92,330
- Equity at exit
- $62,720
Cash invested: $16,240 (down + closing). Projections, not guarantees.
Landlord ↔ Tenant lean methodology
- Overall (STATE)
- 15 Strongly Tenant-Friendly
- State New York
- 15 Strongly Tenant-Friendly · D+10
- County
- — inherits STATE
- City
- — inherits STATE
ZIP-level market 14009
- Home prices YoY
- 2.0%
- Active inventory
- 39
- Price-to-rent
- 4.8×
Monthly cashflow live
- Estimated rent
- $1,015 medium interval (Pro) →
- Mortgage (P&I)
- −$304
- Tax est. 1.5%
- −$72 /mo · $870/yr
- Insurance
- −$24
- Flood insurance flood zone
- −$66 /mo · $798/yr
- HOA
- −$0
- Vacancy / Maint / Mgmt
- −$213
- Net cashflow
- $335
Break-even live
UW: 25.0% down · 7.5% · 30yr · 1.5% tax · 5.0% vac · 8.0% maint · 8.0% mgmt
Financing live
Cash to close
- Down payment
- $14,500
- Closing costs
- $1,740
- Reserves months
- —
- Total cash needed
- —
Loan-product check · same deal, 3 products live
Conventional
25% down · 7.5% · 30yr
- Down + closing
- —
- Monthly P&I
- —
- Monthly cashflow
- —
- DSCR
- —
- Eligible?
- —
Personal DTI + credit; lowest rate.
DSCR
20% down · 8.5% · 30yr
- Down + closing
- —
- Monthly P&I
- —
- Monthly cashflow
- —
- DSCR
- —
- Eligible?
- —
No personal income docs; deal must DSCR.
Hard money
10% down · 12.0% · 12mo
- Down + closing
- —
- Monthly P&I
- —
- Monthly cashflow
- —
- DSCR
- —
- Eligible?
- —
Short-term bridge; refi at stabilization.
Rent comps 1 comps
| Address | Beds | Baths | Sqft | Rent | $/sqft | DOM | Units | Dist |
|---|---|---|---|---|---|---|---|---|
| 12100 Countyline Rd Arcade, NY | 2.0 | 1.0 | 810 | $1,015 | $1.25 | 16d | 1 | 0.34mi |
Listing history 15 events
-
2026-06-18days on market $58,000 Active 21 DOM
-
2026-06-17days on market $58,000 Active 20 DOM
-
2026-06-16days on market $58,000 Active 19 DOM
-
2026-06-15days on market $58,000 Active 18 DOM
-
2026-06-13days on market $58,000 Active 16 DOM
-
2026-06-12days on market $58,000 Active 15 DOM
-
2026-06-09days on market $58,000 Active 12 DOM
-
2026-06-08days on market $58,000 Active 11 DOM
-
2026-06-07days on market $58,000 Active 10 DOM
-
2026-06-07days on market $58,000 Active 9 DOM
-
2026-06-04days on market $58,000 Active 6 DOM
-
2026-06-02days on market $58,000 Active 5 DOM
-
2026-06-01days on market $58,000 Active 4 DOM
-
2026-05-31days on market $58,000 Active 3 DOM
-
2026-05-28$58,000 Active
ⓘ Source: listings_history table (triggers on properties + properties_extension) + one-shot
backfill from property_details.listing_events for pre-trigger history.
Climate risk First Street
- Flood 7/10 Severe FEMA zone X · 99% chance over 30 yrs
- Wildfire 1/10 Low
- Heat 2/10 Low 8 d/yr ≥90°F today · 19 d/yr by 30 yrs out
- Wind 1/10 Low
- Air quality 2/10 Low 0 unhealthy d/yr today · 1 by 30 yrs out
Nearby sold comps map
Loading sold comps map…
Walkable amenities ~0.75 mi
Loading nearby amenities…
Taxation est. · year 1
- Rental income
- $12,180
- − Mortgage interest
- −$3,249
- − Property taxes
- −$870
- − Insurance
- −$1,088
- − Repairs & maintenance
- −$974
- − Management
- −$974
- − Depreciation
- −$1,687
- Taxable income
- $3,338
- Est. tax owed @ 24.0%
- −$801
- After-tax cash flow
- $3,214/yr
For passive investors: Depreciation is non-cash, so a rental often shows a tax loss while cash-flowing — sheltering income. Rental losses are passive: they offset passive income freely, and up to $25,000/yr can offset ordinary (W-2) income if you actively participate and your MAGI is under $100k (phasing out to $0 by $150k); unused losses carry forward. On sale, claimed depreciation is recaptured at up to 25%, and gains may owe capital-gains tax (a 1031 exchange can defer both). Figures are a year-1 estimate at your 24.0% rate — not tax advice; consult a CPA.
Condition & rehab AI · 2 photos
This manufactured home requires cosmetic repairs to the exterior and roof, with significant potential for value increase through painting and siding repairs.
Repairs flagged
- Major siding — Significant wear and tear
- Major roof — Aged appearance
Value-add opportunities
- Both paint exterior — Enhances curb appeal and value
- Both repair siding — Improves structural integrity and appearance
Renovation cost estimate screening
| Repair item | Severity | Est. cost |
|---|---|---|
| siding · Significant wear and tear | Major | $15,000–50,000 |
| roof · Aged appearance | Major | $15,000–50,000 |
| Total estimated repair cost · 2 items | $30,000–100,000 |
Value-add ROI direction
- Both paint exterior — Enhances curb appeal and value ↑
- Both repair siding — Improves structural integrity and appearance ↑
ⓘ Cost ranges are severity-bucket heuristics (US national rule-of-thumb). Get contractor quotes + a written scope before underwriting a rehab budget.
Schools (NCES district)
- District
- Yorkshire-Pioneer Central School District
- NCES district ID
- 3608970
- Math proficiency
- 50% ▼ -17.00%
- Reading proficiency
- 54% ▼ -1.00%
- Median HH income
- $45,735
- Composite
- 44.02/100
- National rank
- #2885
- State rank
- #358 of 590 in NY
Livability — Arcade
- Score
- 64/100
- State rank
- #774
- US rank
- #14787
Category grades
Schools grade is shown separately in the Schools card above.
Census & demographics
- Population (ZIP)
- 5,787
Population outlook (Wyoming County) Hauer SSP2
- Today (2025)
- 38,976 people
- By 2030
- 37,826 · -3.0%
- By 2040
- 35,585 · -8.7%
- By 2050
- 32,841 · -15.7%
- By 2075
- 25,920 · -33.5%
- By 2100
- 19,082 · -51.0%
Race, ethnicity, and origin ACS 2023
- Neighborhood character
- Predominantly White (94%)
- Race & ethnicity
- White 94% Two or more races 3% Asian 2%
- Common ancestry
- Romanian 9% Iranian 2% Subsaharan African 1%
- Foreign-born
- 2% · Canada
- Languages at home
- 96% English-only · Tagalog/Filipino 2% Other Asian/Pacific 1%
Political lean MEDSL · Wyoming
- 2024 margin
- Solid R (+48.2) · D 25.9% · R 74.1%
- 2008→2024 swing
- -22.1pp toward R · 2008: -26.1pp · 2024: -48.2pp
- All cycles
- 2024: R+48.2 2020: R+45.5 2016: R+51.0 2012: R+29.6 2008: R+26.1
Not yet ingested
- Civics
- —
Market trends
- HPI YoY
- ▲ 5.65%
- Current HPI
- 281.8451
- Rent YoY
- —
- Metro
- —
- State GDP YoY
- ▲ 2.60%
- F500 in state
- 92
Industry mix (Fortune 500 HQ in NY)
| Industry | F500 HQs | Revenue |
|---|---|---|
| Financial Services | 10 | $950B |
|
||
| Consumer Goods | 9 | $162B |
|
||
| Insurance | 4 | $225B |
|
||
| Telecommunications | 2 | $144B |
|
||
| Pharmaceuticals | 2 | $112B |
|
||
| Media / Entertainment | 2 | $69B |
|
||
Price history
1 event — show timeline
- 2026-05-28 Listed $58,000 WNYREIS
Cash-flow waterfall
monthlySold comps — $/sqft
last 12 mo · ≤1 miLoading sold comps…