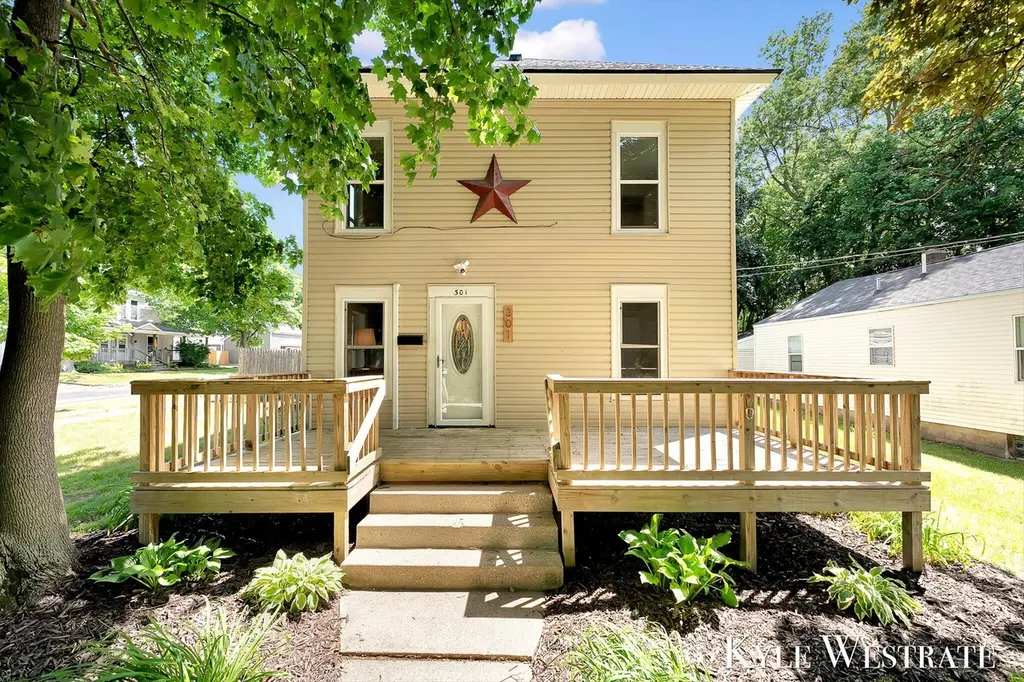
301 W Montcalm St · Greenville, MI
Flood risk 1/10 · Minimal
- FEMA flood zone
- X
- Chance of flooding over 30 yrs
- 0.0%
- Est. flood insurance / yr
- $473 – $860
Fire risk 1/10 · Minimal
- Est. fire insurance / yr
- $784 – $1,456
Heat risk 2/10 · Minimal
- Hot days now (above 98°F)
- 7 days/yr
- Hot days in 30 yrs
- 15 days/yr
Wind risk 1/10 · Minimal
- Chance of severe wind over 30 yrs
- —
Air-quality risk 2/10 · Minimal
- Unhealthy air days now
- 1 days/yr
- Unhealthy air days in 30 yrs
- 1 days/yr
Risk factors via First Street. Map © Google.
Why this score? — see what drove the D grade
The composite is a weighted blend of 9 inputs, each scored 0–100. Each bar is that input's sub-score; the figure is the points it added to the 100-point composite (weight × sub-score).
- Cash flow +16.1/30.0
- DSCR +5.0/10.0
- 1% rule +4.4/10.0
- Schools +3.7/10.0
- Livability +3.3/5.0
- ARV discount +3.0/15.0
- Rent growth +2.5/5.0
- Condition / age +2.5/5.0
- Appreciation +0.0/10.0
$249,900
🖨 Deal sheet (PDF) 📄 Offer letter ✓ Due diligence
Listing remarks MLS
Welcome to 301 W Montcalm! This 4 bed 1.5 bath home is move in ready! Offering immediate possession this home is a must see! The main level features a spacious living area, dining space, kitchen, bedroom, full bath, and a half bath with laundry for comfort and convenience! The upper level features three spacious bedrooms! Enjoy the large fenced in back yard with a patio perfect for relaxing and entertaining in the warm summer months! Conveniently located, you are just minutes from parks, schools, shopping, and restaurants! All offers due Wednesday, June 17 at 12PM. Schedule your showing today!
Key facts
- Spacious living area
- Kitchen
- Immediate possession
Tags
Property features AI
Exterior
- Parking: Detached garage (1 car)
- Utilities: Natural gas connected; Public water
- Home design: Traditional single-family residence; Built in 1900
- Construction: Vinyl siding; Composition roof; Built 1900
- Exterior features: Corner lot; Sidewalk; Paved road access; Public water
Interior
- Kitchen: Dishwasher; Microwave; Oven; Refrigerator
- Bathrooms: 1 full bathroom; 1 half bathroom
- Heating & cooling: Radiant heating
- Interior features: Eat-in kitchen; Michigan basement; 9 total rooms
- Laundry & utility: Washer; Dryer; Natural gas water heater
Neighborhood map
What this means for you Summary
Snapshot
- This is a 4-bed/1.5-bath single-family listed at $250k.
Deal economics
- At list price, monthly cash flow is $129 ($2k/yr) — positive.
- The deal already cash-flows at list — no discount required.
- To meet the 1% rule (rent ≥ 1% of price), the offer needs to be $235k (6.0% below list).
- Recommended offer: $235k (6.0% below list) — sets the bar for 1% rule.
- Cap rate 6.9% vs local median 4.2% in Greenville — top-decile yield for the area; either an underpriced asset or a hidden risk that comps aren't pricing in. Stress-test before assuming the spread holds.
Location & tenants
- Location reads 66/100 on livability (#426 in MI) — a middle-class / working-renter tenant base. Strengths: cost of living A+, housing A+; Watch: crime F, amenities F, commute F.
- Greenville Public Schools (town): math 35% / reading 52% proficiency, ranked #167 of 540 in MI (top 31%) — families likely to look elsewhere, expect single-tenant / working-renter base with shorter leases.
- Zoned schools: Baldwin Heights School (math 47% / reading 60%, grade C, #318 of 1,397 statewide, top 23%, 485 students, 57% FRL); Greenville Middle School (math 28% / reading 49%, grade F, #228 of 493 statewide, top 47%, 799 students, 63% FRL); Greenville Senior High School (math 35% / reading 60%, grade D, #185 of 713 statewide, top 26%, 1,106 students, 57% FRL) — zoned schools average 59% FRL vs 44% district-wide (15 pts higher); higher-poverty schools than district average — tighter screening recommended.
- Market conditions: 193 active listings in the ZIP; 7 comparable units currently listed for rent nearby; rentals leasing fast (median 12d on market — plan ~1-2 weeks tenant-placement turnaround); 273 units permitted in Montcalm County in 2024 (5 in 5+ unit buildings).
- This rent runs 40% of the median local income ($70k/yr) — at the standard rent-burdened threshold; future hikes will face affordability resistance.
Forward outlook
- Local home prices are declining (-3.0%/yr); year-one equity from $2k of loan paydown is wiped out by about $7k of value loss. Plan a longer hold.
- Montcalm County population projected at -17% by 2050 — secular population decline; favor cash flow + early exit over multi-decade hold.
Negotiation context
- Only 9 days on market — expect competitive offers; lowballing is unlikely to land.
- 6 sale attempts since 14y ago with the ask held roughly flat each time — persistent listings suggest the price (not the market) is what's stuck; bring a comps-based counter.
- Current owner paid $158k; list at $250k implies a 58% gain — meaningful room to come down on a strong offer.
Risks & watch-outs
- Watch-outs: built in 1900 — expect roof / HVAC / electrical / plumbing capex.
Questions for the listing agent
- Built in 1900 — when were the roof, HVAC, electrical panel, plumbing, and water heater last replaced?
- Is there a deadline driving the sale (1031 exchange, divorce, estate, relocation)? That informs how much negotiation room exists.
- Schools are D-rated, which usually means shorter tenancies and higher turnover. Who's the typical renter profile here, and what's been the actual vacancy rate?
- Crime grade is F in this area — have there been break-ins, vandalism, or insurance claims at this property in the last 3 years? What carrier currently insures it and at what premium?
- The area grade is low — what's the realistic commute time and amenity access for the typical tenant pool here? Any planned neighborhood developments (good or bad) we should know about?
- What's the average days-on-market for RENTAL listings here right now (not sales)? A rising rental-DOM trend means longer vacancies and softer asking-rent achievability than the comps imply.
- What's the recent tenant-quality profile in this submarket — average credit score on applications, eviction rate, late-payment / NSF rate, and stable-employment percentage? A property-management company in the area should have these aggregated.
- How much new for-sale + rental construction is in the pipeline within 1–3 miles? Heavy new supply typically softens prices + rents 12–24 months out; constrained supply supports both.
Investment metrics
- 1% rule
- 0.94% ✗
- Cap rate
- 6.91%
- Cash-on-cash
- 2.22%
- DSCR
- 1.10
- GRM
- 8.9
CMA / ARV
- ARV (on-the-fly)
- $227,200
- Comps found
- 12
Show comp detail 12 sales within ~0.75 mi
| Address | Dist | Beds/Ba | Sqft | Sold | Price | $/sf | Match |
|---|---|---|---|---|---|---|---|
| 213 W Montcalm St | 0.05mi | 4/1.0 | 1,384 (-2%) | 5mo | $153,000 | $111 | 87 |
| 205 W Montcalm St | 0.08mi | 3/1.0 (-1) | 1,430 (+1%) | 1mo | $155,000 | $108 | 87 |
| 510 W Oakridge Rdg | 0.22mi | 4/2.0 | 1,320 (-7%) | 5mo | $132,000 | $100 | 72 |
| 909 W Orange St | 0.58mi | 4/2.0 | 1,472 (+4%) | 8mo | $256,000 | $174 | 58 |
| 605 S Franklin St | 0.45mi | 4/1.0 | 1,551 (+9%) | 6mo | $205,000 | $132 | 56 |
| 909 S Franklin St | 0.72mi | 5/2.0 (+1) | 1,450 (+2%) | 2mo | $232,000 | $160 | 55 |
| 201 E Coffren Ave | 0.54mi | 3/1.5 (-1) | 1,304 (-8%) | 5mo | $217,000 | $166 | 52 |
| 211 E Coffren Ave | 0.55mi | 3/1.0 (-1) | 1,500 (+6%) | 9mo | $225,000 | $150 | 50 |
| 611 S Baldwin St | 0.59mi | 3/2.0 (-1) | 1,526 (+8%) | 4mo | $285,000 | $187 | 49 |
| 1010 W Orange St | 0.62mi | 3/1.0 (-1) | 1,295 (-9%) | 5mo | $165,000 | $127 | 45 |
| 805 S Merry Lane Ter | 0.72mi | 3/2.0 (-1) | 1,536 (+8%) | 1mo | $287,000 | $187 | 45 |
| 315 E Coffren Ave | 0.58mi | 3/1.0 (-1) | 1,220 (-14%) | 1mo | $260,000 | $213 | 42 |
Match score weights: distance 35% · size 25% · config 20% · recency 20%. Top-matched comps best support the ARV.
Projected returns pro-forma
-3.0% appreciation · 3.0% rent growth · sell at horizon
- IRR
- -12.8%
- Equity multiple
- 0.54×
- Total profit
- $-32,216
- Equity at exit
- $37,261
- IRR
- -3.7%
- Equity multiple
- 0.75×
- Total profit
- $-17,294
- Equity at exit
- $21,607
Cash invested: $69,972 (down + closing). Projections, not guarantees.
Landlord ↔ Tenant lean methodology
- Overall (STATE)
- 62 Landlord-Friendly
- State Michigan
- 62 Landlord-Friendly · EVEN
- County
- — inherits STATE
- City
- — inherits STATE
ZIP-level market 48838
- Home prices YoY
- -30.2%
- Active inventory
- 193
- Price-to-rent
- 8.9×
Monthly cashflow live
- Estimated rent
- $2,350 high interval (Pro) →
- Mortgage (P&I)
- −$1,311
- Tax est. 1.5%
- −$312 /mo · $3,748/yr
- Insurance
- −$104
- HOA
- −$0
- Vacancy / Maint / Mgmt
- −$493
- Net cashflow
- $129
Break-even live
Sensitivity live
| Price | -10% $302 | -5% $216 | +0% $129 | +5% $43 | +10% $-43 |
|---|---|---|---|---|---|
| Rent | -10% $-56 | -5% $37 | +0% $129 | +5% $222 | +10% $315 |
| Rate | -1.0pp $255 | -0.5pp $193 | base $129 | +0.5pp $65 | +1.0pp $-1 |
UW: 25.0% down · 7.5% · 30yr · 1.5% tax · 5.0% vac · 8.0% maint · 8.0% mgmt
Financing live
Cash to close
- Down payment
- $62,475
- Closing costs
- $7,497
- Reserves months
- —
- Total cash needed
- —
Loan-product check · same deal, 3 products live
Conventional
25% down · 7.5% · 30yr
- Down + closing
- —
- Monthly P&I
- —
- Monthly cashflow
- —
- DSCR
- —
- Eligible?
- —
Personal DTI + credit; lowest rate.
DSCR
20% down · 8.5% · 30yr
- Down + closing
- —
- Monthly P&I
- —
- Monthly cashflow
- —
- DSCR
- —
- Eligible?
- —
No personal income docs; deal must DSCR.
Hard money
10% down · 12.0% · 12mo
- Down + closing
- —
- Monthly P&I
- —
- Monthly cashflow
- —
- DSCR
- —
- Eligible?
- —
Short-term bridge; refi at stabilization.
Rent comps 7 comps
| Address | Beds | Baths | Sqft | Rent | $/sqft | DOM | Units | Dist |
|---|---|---|---|---|---|---|---|---|
| 1305 Trail View Dr Greenville, MI | 3.0 | 2.5 | 1450 | $2,295 | $1.58 | 4d | 1 | 1.14mi |
| 1301 Timber Hollow Ct Greenville, MI | 3.0 | 2.5 | 1450 | $1,895 | $1.31 | 4d | 1 | 1.18mi |
| 1301 Timber Hollow Ct Greenville, MI | 3.0 | 2.5 | 1450 | $2,295 | $1.58 | 45d | 1 | 1.18mi |
| 1310 Timber Hollow Ct Greenville, MI | 3.0 | 2.5 | 1450 | $2,295 | $1.58 | 45d | 1 | 1.19mi |
| 1310 Timber Hollow Ct Greenville, MI | 3.0 | 2.5 | 1450 | $1,895 | $1.31 | 16d | 1 | 1.19mi |
| 1310 Trail View Dr Greenville, MI | 3.0 | 2.5 | 1450 | $2,195 | $1.51 | 12d | 1 | 1.20mi |
| 1405 Ridgeview Dr Greenville, MI | 4.0 | 3.0 | 1640 | $2,495 | $1.52 | 4d | 1 | 1.32mi |
Listing history 8 events
-
2026-06-21days on market $249,900 Active 9 DOM
-
2026-06-18days on market $249,900 Active 6 DOM
-
2026-06-17days on market $249,900 Active 5 DOM
-
2026-06-16remarks 605-char remark
-
2026-06-16days on market $249,900 Active 4 DOM
-
2026-06-15days on market $249,900 Active 3 DOM
-
2026-06-13remarks 600-char remark
-
2026-06-13$249,900 Active 1 DOM
ⓘ Source: listings_history table (triggers on properties + properties_extension) + one-shot
backfill from property_details.listing_events for pre-trigger history.
Climate risk First Street
- Flood 1/10 Low FEMA zone X · 0% chance over 30 yrs
- Wildfire 1/10 Low
- Heat 2/10 Low 7 d/yr ≥98°F today · 15 d/yr by 30 yrs out
- Wind 1/10 Low
- Air quality 2/10 Low 1 unhealthy d/yr today · 1 by 30 yrs out
Nearby sold comps map
Loading sold comps map…
Walkable amenities ~0.75 mi
Loading nearby amenities…
Taxation est. · year 1
- Rental income
- $28,199
- − Mortgage interest
- −$13,998
- − Property taxes
- −$3,748
- − Insurance
- −$1,250
- − Repairs & maintenance
- −$2,256
- − Management
- −$2,256
- − Depreciation
- −$7,270
- Taxable loss
- −$2,579
- Est. tax savings @ 24.0%
- +$619
- After-tax cash flow
- $2,172/yr
For passive investors: Depreciation is non-cash, so a rental often shows a tax loss while cash-flowing — sheltering income. Rental losses are passive: they offset passive income freely, and up to $25,000/yr can offset ordinary (W-2) income if you actively participate and your MAGI is under $100k (phasing out to $0 by $150k); unused losses carry forward. On sale, claimed depreciation is recaptured at up to 25%, and gains may owe capital-gains tax (a 1031 exchange can defer both). Figures are a year-1 estimate at your 24.0% rate — not tax advice; consult a CPA.
Schools (NCES district)
- District
- Greenville Public Schools
- NCES district ID
- 2617160
- Math proficiency
- 35% ▼ -7.00%
- Reading proficiency
- 52% ▬ 0.00%
- Median HH income
- $44,624
- Composite
- 36.81/100
- National rank
- #4566
- State rank
- #167 of 540 in MI
Livability — Greenville
- Score
- 66/100
- State rank
- #426
- US rank
- #11581
Category grades
Schools grade is shown separately in the Schools card above.
Census & demographics
- Census place
- Greenville, MI
- County
- Montcalm County · 18,212 people
- City population
- 18,212
- Metro
- Grand Rapids-Kentwood, MI
- Population (ZIP)
- 18,212
- Household income
- $70,176
- Rent vs Own
- Severe rent burden
- 365.0
Population outlook (Montcalm County) Hauer SSP2
- Today (2025)
- 61,011 people
- By 2030
- 59,467 · -2.5%
- By 2040
- 55,427 · -9.2%
- By 2050
- 50,517 · -17.2%
- By 2075
- 38,731 · -36.5%
- By 2100
- 26,770 · -56.1%
Race, ethnicity, and origin ACS 2023
- Neighborhood character
- Predominantly White (85%)
- Race & ethnicity
- White 85% Two or more races 10% Hispanic / Latino 8%
- Hispanic origin (detail)
- Mexican 5% Puerto Rican 2%
- Common ancestry
- Iranian 5% Romanian 4% Lithuanian 2%
- Foreign-born
- 3% · Canada
- Languages at home
- 93% English-only · Spanish 5% Chinese 1%
Political lean MEDSL · Montcalm
- 2024 margin
- Solid R (+39.0) · D 29.8% · R 68.7% · Other 1.5%
- 2008→2024 swing
- -38.7pp toward R · 2008: -0.3pp · 2024: -39.0pp
- All cycles
- 2024: R+39.0 2020: R+37.7 2016: R+34.0 2012: R+8.6 2008: R+0.3
Not yet ingested
- Civics
- —
Market trends
- HPI YoY
- ▼ -108.31%
- Current HPI
- 249.996
- Rent YoY
- —
- Metro
- Grand Rapids-Kentwood, MI
- State GDP YoY
- ▲ 1.37%
- F500 in state
- 28
Industry mix (Fortune 500 HQ in MI)
| Industry | F500 HQs | Revenue |
|---|---|---|
| Automotive Parts | 3 | $48B |
|
||
| Automotive | 2 | $372B |
|
||
| Chemicals | 1 | $45B |
|
||
| Automotive Retail | 1 | $29B |
|
||
| Healthcare / Medical Devices | 1 | $23B |
|
||
| Automotive Technology | 1 | $20B |
|
||
Price history
+220.4% since first listed13 events — show timeline
- 2026-06-12 Listed $249,900 MiRealSource-MiMLS
- 2026-06-12 Listed $249,900 SW Michigan MLS
- 2026-04-10 Sold (Public Records) $158,000 Public Records
- 2014-09-17 Listing Removed — SW Michigan MLS
- 2014-06-26 Sold (Public Records) $68,000 Public Records
- 2014-06-20 Sold (MLS) $68,000 REALCOMP
- 2014-06-20 Sold (MLS) $68,000 SW Michigan MLS
- 2014-04-23 Listed $68,000 REALCOMP
- 2014-04-23 Listed $68,000 SW Michigan MLS
- 2013-09-23 Listing Removed — REALCOMP
- 2012-12-18 Listed $85,000 REALCOMP
- 2012-12-18 Listed $85,000 SW Michigan MLS
- 2003-12-24 Sold (Public Records) $78,000 Public Records
Cash-flow waterfall
monthlySold comps — $/sqft
last 12 mo · ≤1 miLoading sold comps…