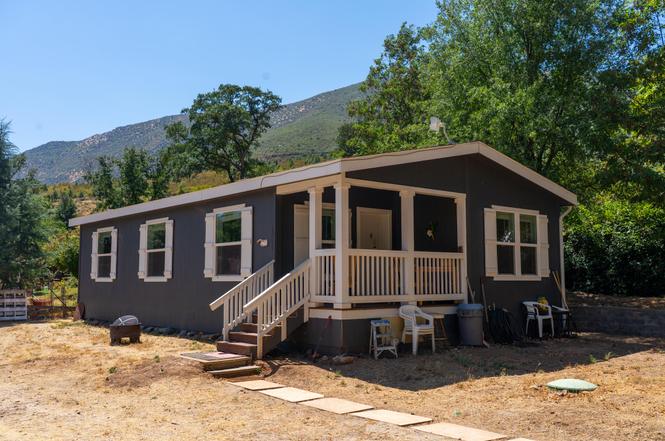
14166 Main St · French Gulch, CA
Flood risk 9/10 · Severe
- FEMA flood zone
- X (unshaded)
- Chance of flooding over 30 yrs
- 0.99%
- Est. flood insurance / yr
- $507 – $1,088
Fire risk 5/10 · Moderate
- Est. fire insurance / yr
- $659 – $1,223
Heat risk 8/10 · Major
- Hot days now (above 96°F)
- 8 days/yr
- Hot days in 30 yrs
- 20 days/yr
Wind risk 1/10 · Minimal
- Chance of severe wind over 30 yrs
- —
Air-quality risk 10/10 · Severe
- Unhealthy air days now
- 39 days/yr
- Unhealthy air days in 30 yrs
- 42 days/yr
Risk factors via First Street. Map © Google.
Why this score? — see what drove the D- grade
The composite is a weighted blend of 9 inputs, each scored 0–100. Each bar is that input's sub-score; the figure is the points it added to the 100-point composite (weight × sub-score).
- Cash flow +9.6/30.0
- ARV discount +7.5/15.0
- Appreciation +5.0/10.0
- Schools +4.6/10.0
- Livability +2.8/5.0
- DSCR +2.7/10.0
- 1% rule +2.5/10.0
- Rent growth +2.5/5.0
- Condition / age +2.5/5.0
$239,900
🖨 Deal sheet (PDF) 📄 Offer letter ✓ Due diligence
Listing remarks
Charming Victorian with Guest House/ADU (Built in 2024) - Full of Historic Potential! Discover a rare opportunity to own a piece of history with this approx. 2,071 sq ft Victorian home brimming with character and significant historical value once owned by Ezra Erich who was a very talented and well known geologist in French Gulch and the owner of the Brown Bear mine. Nestled on a 2.9 acre lot, this 3 bedroom, 2 bathroom main house offers endless potential for restoration enthusiasts or those seeking a unique project. While the home needs work, its classic Victorian details—think ornate trim, high ceilings, and timeless charm—make it a gem waiting to be polished. The property als
Key facts
- Historic potential
- Guest house
- High ceilings
Tags
Property features AI
Finance
- Other: Property sits on approximately 2.9 acres
Exterior
- Parking: Off-street parking; Boat parking; Oversized parking; RV access/parking
- Utilities: Well water; Septic tank
- Home design: Single-family residence; One and two levels
- Construction: Wood siding; Raised foundation; Composition roof; Built as a residential single-family home
- Exterior features: Rolling slope lot; Asphalt road access; No pool
Interior
- Kitchen: Dishwasher
- Flooring: Carpet; Vinyl
- Bathrooms: 4 full bathrooms
- Heating & cooling: Central air; Has heating
- Interior features: Dishwasher; No fireplace
Neighborhood map
What this means for you Summary
Snapshot
- This is a 3-bed/2.0-bath single-family listed at $240k.
Deal economics
- At list price, monthly cash flow is $-229 ($-3k/yr) — negative.
- To cash-flow at today's rent, offer at most $199k (16.9% below list).
- To meet the 1% rule (rent ≥ 1% of price), the offer needs to be $179k (25.5% below list).
- Recommended offer: $179k (25.5% below list) — sets the bar for 1% rule.
Location & tenants
- Location reads 55/100 on livability (#834 in CA) — a working-class tenant base; expect higher turnover. Strengths: housing A+; Watch: schools D+, crime F, amenities F.
- Shasta Union High (urban): math 41% / reading 67% proficiency, ranked #122 of 517 in CA (top 24%) — acceptable for families but not a draw, mixed tenant base, ~2y average lease; only 16% free/reduced lunch — higher-income household profile.
- Market conditions: 15 active listings in the ZIP; 246 units permitted in Shasta County in 2024 (0 in 5+ unit buildings).
Forward outlook
- In year one you build about $9k of equity ($2k loan paydown + $7k appreciation (3.0% local appreciation)).
- Shasta County population projected to shrink 9% by 2050 — rents likely to lag national; underwrite the cash flow, not the appreciation.
- By year 4, paydown + projected appreciation supports a ~$30k cash-out refi (75% LTV) — recoverable capital for the next deal without selling this one.
Negotiation context
- It's been on market 185 days — a 12% lower offer ($211k) is reasonable based on typical stale-listing flexibility.
- 3 sale attempts; this cycle's ask has dropped $60k (20%) from the opening price — seller is motivated, your offer sets the floor, not the list.
Risks & watch-outs
- Watch-outs: flood insurance adds $66/mo.
- Climate carrying-cost: severe flood risk; moderate wildfire risk; extreme-heat days projected 8→20/yr by 2055 (HVAC capex compounding) — expect insurance premiums to compound above CPI over the hold.
Questions for the listing agent
- What do current leases actually rent for vs. the listed asking? Can we see a recent rent roll and the last 12 months of T-12 income?
- It's been on market 185 days. Have you received any prior offers? Is the seller open to a 25% concession, seller financing, or rate buy-down credit?
- What's the actual annual flood-insurance premium (NFIP or private), and is the property in a SFHA with mandatory coverage?
- Why hasn't it sold? Are there any deal-killer items the seller is aware of (foundation, flood, title, zoning, code violations)?
- Is there a deadline driving the sale (1031 exchange, divorce, estate, relocation)? That informs how much negotiation room exists.
- Schools are D-rated, which usually means shorter tenancies and higher turnover. Who's the typical renter profile here, and what's been the actual vacancy rate?
- Crime grade is F in this area — have there been break-ins, vandalism, or insurance claims at this property in the last 3 years? What carrier currently insures it and at what premium?
- The area grade is low — what's the realistic commute time and amenity access for the typical tenant pool here? Any planned neighborhood developments (good or bad) we should know about?
- What's the average days-on-market for RENTAL listings here right now (not sales)? A rising rental-DOM trend means longer vacancies and softer asking-rent achievability than the comps imply.
- What's the recent tenant-quality profile in this submarket — average credit score on applications, eviction rate, late-payment / NSF rate, and stable-employment percentage? A property-management company in the area should have these aggregated.
- How much new for-sale + rental construction is in the pipeline within 1–3 miles? Heavy new supply typically softens prices + rents 12–24 months out; constrained supply supports both.
Investment metrics
- 1% rule
- 0.75% ✗
- Cap rate
- 5.48%
- Cash-on-cash
- -2.90%
- DSCR
- 0.87
- GRM
- 11.2
CMA / ARV
No comps found within radius.
Projected returns pro-forma
3.0% appreciation · 3.0% rent growth · sell at horizon
- IRR
- 3.7%
- Equity multiple
- 1.21×
- Total profit
- $14,327
- Equity at exit
- $107,869
- IRR
- 7.0%
- Equity multiple
- 2.06×
- Total profit
- $71,510
- Equity at exit
- $166,240
Cash invested: $67,172 (down + closing). Projections, not guarantees.
Landlord ↔ Tenant lean methodology
- Overall (STATE)
- 18 Strongly Tenant-Friendly
- State California
- 18 Strongly Tenant-Friendly · D+13
- County
- — inherits STATE
- City
- — inherits STATE
ZIP-level market 96033
- Active inventory
- 15
- Price-to-rent
- 11.2×
Monthly cashflow live
- Estimated rent
- $1,787 medium interval (Pro) →
- Mortgage (P&I)
- −$1,258
- Tax from tax record
- −$217 /mo · $2,600/yr
- Insurance
- −$100
- Flood insurance flood zone
- −$66 /mo · $798/yr
- HOA
- −$0
- Vacancy / Maint / Mgmt
- −$375
- Net cashflow
- $-229
Break-even live
Sensitivity live
| Price | -10% $-93 | -5% $-161 | +0% $-229 | +5% $-297 | +10% $-365 |
|---|---|---|---|---|---|
| Rent | -10% $-370 | -5% $-300 | +0% $-229 | +5% $-158 | +10% $-88 |
| Rate | -1.0pp $-108 | -0.5pp $-168 | base $-229 | +0.5pp $-291 | +1.0pp $-354 |
UW: 25.0% down · 7.5% · 30yr · 1.5% tax · 5.0% vac · 8.0% maint · 8.0% mgmt
Financing live
Cash to close
- Down payment
- $59,975
- Closing costs
- $7,197
- Reserves months
- —
- Total cash needed
- —
Loan-product check · same deal, 3 products live
Conventional
25% down · 7.5% · 30yr
- Down + closing
- —
- Monthly P&I
- —
- Monthly cashflow
- —
- DSCR
- —
- Eligible?
- —
Personal DTI + credit; lowest rate.
DSCR
20% down · 8.5% · 30yr
- Down + closing
- —
- Monthly P&I
- —
- Monthly cashflow
- —
- DSCR
- —
- Eligible?
- —
No personal income docs; deal must DSCR.
Hard money
10% down · 12.0% · 12mo
- Down + closing
- —
- Monthly P&I
- —
- Monthly cashflow
- —
- DSCR
- —
- Eligible?
- —
Short-term bridge; refi at stabilization.
Listing history 27 events
-
2026-06-19days on market $239,900 Active 185 DOM
-
2026-06-18price $239,900 Active 184 DOM
-
2026-06-18days on market $250,000 Active 184 DOM
-
2026-06-17days on market $250,000 Active 183 DOM
-
2026-06-16days on market $250,000 Active 182 DOM
-
2026-06-15days on market $250,000 Active 181 DOM
-
2026-06-14days on market $250,000 Active 179 DOM
-
2026-06-13days on market $250,000 Active 178 DOM
-
2026-06-10days on market $250,000 Active 176 DOM
-
2026-06-09days on market $250,000 Active 175 DOM
-
2026-06-08days on market $250,000 Active 174 DOM
-
2026-06-07days on market $250,000 Active 173 DOM
-
2026-06-03days on market $250,000 Active 169 DOM
-
2026-06-02days on market $250,000 Active 168 DOM
-
2026-06-01days on market $250,000 Active 167 DOM
-
2026-05-31days on market $250,000 Active 166 DOM
-
2026-05-30days on market $250,000 Active 165 DOM
-
2026-05-06status Active
-
2026-04-29status Pending
-
2026-04-23price $250,000
-
2026-03-30price $275,000
-
2026-03-03price $289,900
-
2025-12-10$299,900 Active
-
2025-12-05price $299,900
-
2025-11-15price $325,000
-
2025-10-06price $349,900
-
2025-08-15$375,000 Active
ⓘ Source: listings_history table (triggers on properties + properties_extension) + one-shot
backfill from property_details.listing_events for pre-trigger history.
Tax reassessment forecast CA · Resets to sale price
- Current annual tax
- $2,600 · $217/mo
- Projected year-2 tax
- $2,600 · $217/mo
- Expected delta
- $0/yr ($0/mo · 0.0%)
ⓘ Screening estimate from a state-policy table — verify with the county assessor before closing.
Climate risk First Street
- Flood 9/10 Extreme FEMA zone X (unshaded) · 99% chance over 30 yrs
- Wildfire 5/10 Major
- Heat 8/10 Severe 8 d/yr ≥96°F today · 20 d/yr by 30 yrs out
- Wind 1/10 Low
- Air quality 10/10 Extreme 39 unhealthy d/yr today · 42 by 30 yrs out
Nearby sold comps map
Loading sold comps map…
Walkable amenities ~0.75 mi
Loading nearby amenities…
Taxation est. · year 1
- Rental income
- $21,450
- − Mortgage interest
- −$13,438
- − Property taxes
- −$2,600
- − Insurance
- −$1,997
- − Repairs & maintenance
- −$1,716
- − Management
- −$1,716
- − Depreciation
- −$6,979
- Taxable loss
- −$6,997
- Est. tax savings @ 24.0%
- +$1,679
- After-tax cash flow
- $-1,070/yr
For passive investors: Depreciation is non-cash, so a rental often shows a tax loss while cash-flowing — sheltering income. Rental losses are passive: they offset passive income freely, and up to $25,000/yr can offset ordinary (W-2) income if you actively participate and your MAGI is under $100k (phasing out to $0 by $150k); unused losses carry forward. On sale, claimed depreciation is recaptured at up to 25%, and gains may owe capital-gains tax (a 1031 exchange can defer both). Figures are a year-1 estimate at your 24.0% rate — not tax advice; consult a CPA.
Schools (NCES district)
- District
- Shasta Union High
- NCES district ID
- 0636600
- Math proficiency
- 41% ▲ 3.00%
- Reading proficiency
- 67% ▲ 9.00%
- Median HH income
- $50,080
- Composite
- 46.01/100
- National rank
- #2532
- State rank
- #122 of 517 in CA
Livability — French Gulch
- Score
- 55/100
- State rank
- #834
- US rank
- #23173
Category grades
Schools grade is shown separately in the Schools card above.
Census & demographics
- Census place
- French Gulch, CA
- Population (ZIP)
- 245
Population outlook (Shasta County) Hauer SSP2
- Today (2025)
- 179,231 people
- By 2030
- 176,953 · -1.3%
- By 2040
- 169,982 · -5.2%
- By 2050
- 162,547 · -9.3%
- By 2075
- 145,649 · -18.7%
- By 2100
- 123,025 · -31.4%
Race, ethnicity, and origin ACS 2023
- Neighborhood character
- Predominantly White (84%)
- Race & ethnicity
- White 84% Two or more races 10% Hispanic / Latino 7% Asian 6%
- Hispanic origin (detail)
- Mexican 5%
- Common ancestry
- Slovak 4% German 2% Lithuanian 2%
- Foreign-born
- 6% · China
- Languages at home
- 91% English-only · Chinese 6% Spanish 3%
Political lean MEDSL · Shasta
- 2024 margin
- Solid R (+36.5) · D 30.5% · R 67.0% · Other 2.5%
- 2008→2024 swing
- -10.7pp toward R · 2008: -25.8pp · 2024: -36.5pp
- All cycles
- 2024: R+36.5 2020: R+33.1 2016: R+37.4 2012: R+30.3 2008: R+25.8
Not yet ingested
- Civics
- —
Market trends
- HPI YoY
- —
- Current HPI
- —
- Rent YoY
- —
- Metro
- —
- State GDP YoY
- ▲ 3.21%
- F500 in state
- 116
Industry mix (Fortune 500 HQ in CA)
| Industry | F500 HQs | Revenue |
|---|---|---|
| Technology | 27 | $1,492B |
|
||
| Financial Services | 3 | $174B |
|
||
| Retail | 3 | $44B |
|
||
| Insurance | 3 | $26B |
|
||
| Media / Entertainment | 2 | $115B |
|
||
| Pharmaceuticals / Biotech | 2 | $62B |
|
||
Price history
-33.3% since first listed10 events — show timeline
- 2026-05-06 Relisted — SAOR
- 2026-04-29 Pending — SAOR
- 2026-04-23 Price Changed $250,000 SAOR
- 2026-03-30 Price Changed $275,000 SAOR
- 2026-03-03 Price Changed $289,900 SAOR
- 2025-12-10 Listed $299,900 SAOR
- 2025-12-05 Price Changed $299,900 SAOR
- 2025-11-15 Price Changed $325,000 SAOR
- 2025-10-06 Price Changed $349,900 SAOR
- 2025-08-15 Listed $375,000 SAOR
Property tax history
+9.2%/yrLatest (2025): $2,600 · +1.4% YoY. Source: county tax records.
Cash-flow waterfall
monthlySold comps — $/sqft
last 12 mo · ≤1 miLoading sold comps…