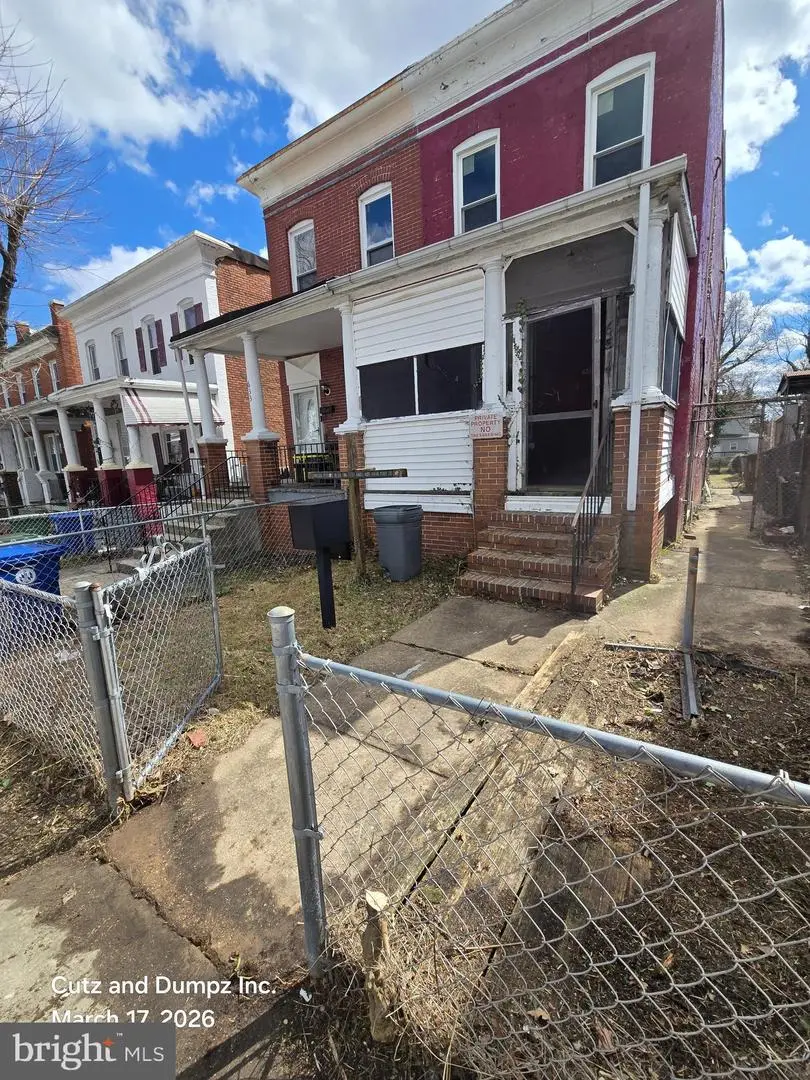
631 Cator Ave · Baltimore, MD
Flood risk 1/10 · Minimal
- FEMA flood zone
- X (unshaded)
- Chance of flooding over 30 yrs
- 0.0%
- Est. flood insurance / yr
- $473 – $860
Fire risk 1/10 · Minimal
- Est. fire insurance / yr
- $755 – $1,403
Heat risk 7/10 · Major
- Hot days now (above 103°F)
- 7 days/yr
- Hot days in 30 yrs
- 15 days/yr
Wind risk 6/10 · Moderate
- Chance of severe wind over 30 yrs
- 27.0%
Air-quality risk 4/10 · Minor
- Unhealthy air days now
- 6 days/yr
- Unhealthy air days in 30 yrs
- 7 days/yr
Risk factors via First Street. Map © Google.
Why this score? — see what drove the B+ grade
The composite is a weighted blend of 9 inputs, each scored 0–100. Each bar is that input's sub-score; the figure is the points it added to the 100-point composite (weight × sub-score).
- Cash flow +30.0/30.0
- ARV discount +15.0/15.0
- 1% rule +10.0/10.0
- DSCR +10.0/10.0
- Livability +3.8/5.0
- Rent growth +2.9/5.0
- Condition / age +2.5/5.0
- Schools +1.0/10.0
- Appreciation +0.0/10.0
$89,900
🖨 Deal sheet 📄 Offer letter ✓ Due diligence
Listing remarks MLS
Pen Lucy over here on the north end of Baltimore and this is a cool little classic, end of group Baltimore row home with a screened in front porch and three floors of living space. This neighborhood is a hidden treasure just south of Govans right along York Road and it's even convenient to Charles Village. Situated on a quaint little street here with awesome curb appeal, and friendly neighbors. You will be treated to a full size 3 bedroom row home with a sizable front and rear yard that offers privacy, wrapped up in a cool community vibe. Overall, the home is in good condition and actually doesn’t need much to finish out, and start enjoying. Whether you’re an owner occupant or want to add this to your rental collection, it’s pretty much a slam dunk. Don't miss out on the opportunity ! Restaurants, parks, and great schools are all nearby. Get in now while the prices are low! Buyer to determine if ground rent exists, seller will not redeem.
Key facts
- Built 1920
- Listed 96 days
Tags
Neighborhood map
What this means for you Summary
Snapshot
- This is a 3-bed/1.0-bath townhouse listed at $90k.
Deal economics
- At list price, monthly cash flow is $766 ($9k/yr) — positive.
- The deal already cash-flows at list — no discount required.
- Meets the 1% rule at list price ($2k rent vs $90k).
- Recommended offer: $82k (9.0% below list) — sets the bar for market timing.
- Cap rate 16.5% vs local median 6.0% in Baltimore — top-decile yield for the area; either an underpriced asset or a hidden risk that comps aren't pricing in. Stress-test before assuming the spread holds.
Location & tenants
- Location reads 76/100 on livability (#90 in MD, #3,396 nationally) — a middle-class / working-renter tenant base. Strengths: amenities A+, commute A+, housing A+; Watch: schools D, crime F.
- Baltimore City Public Schools (urban): math 7% / reading 16% proficiency, ranked #24 of 24 in MD (top 100%) — low school quality limits family demand, transient renter base, plan for 1-2y turnover; 79% free/reduced lunch — lower-income household profile, screen leases tightly.
- Market conditions: Rents rising (+1.6%/yr); 325 active listings in the ZIP; 40 comparable units currently listed for rent nearby; rentals at typical pace (median 20d on market — plan ~3-4 weeks tenant-placement turnaround); 42% of comp listings sitting > 30 days — soft ceiling on asking rent; 1,273 units permitted in Baltimore city in 2024 (1,104 in 5+ unit buildings).
- This rent runs 38% of the median local income ($62k/yr) — at the standard rent-burdened threshold; future hikes will face affordability resistance.
Forward outlook
- Local home prices are declining (-3.0%/yr); year-one equity from $622 of loan paydown is wiped out by about $3k of value loss. Plan a longer hold.
- Baltimore County population projected to shrink 4% by 2050 — rents likely to lag national; underwrite the cash flow, not the appreciation.
- At projected returns (-3.0% appreciation + 1.6% rent growth), your $25k cash investment doubles in ~4 years — after that, you're playing with house money.
Negotiation context
- It's been on market 96 days — a 9% lower offer ($82k) is reasonable based on typical stale-listing flexibility.
- Current owner paid $36k; list at $90k implies a 150% gain — meaningful room to come down on a strong offer.
Risks & watch-outs
- Watch-outs: property tax is 3.6% of price; built in 1920 — expect roof / HVAC / electrical / plumbing capex.
- Climate carrying-cost: major wind risk, 27% chance of damaging wind over 30y; extreme-heat days projected 7→15/yr by 2055 (HVAC capex compounding) — expect insurance premiums to compound above CPI over the hold.
Questions for the listing agent
- It's been on market 96 days. Have you received any prior offers? Is the seller open to a 9% concession, seller financing, or rate buy-down credit?
- Built in 1920 — when were the roof, HVAC, electrical panel, plumbing, and water heater last replaced?
- Property tax is high relative to price — has the assessment been appealed recently, and will the sale trigger a re-assessment?
- Why hasn't it sold? Are there any deal-killer items the seller is aware of (foundation, flood, title, zoning, code violations)?
- Is there a deadline driving the sale (1031 exchange, divorce, estate, relocation)? That informs how much negotiation room exists.
- Schools are D-rated, which usually means shorter tenancies and higher turnover. Who's the typical renter profile here, and what's been the actual vacancy rate?
- Crime grade is F in this area — have there been break-ins, vandalism, or insurance claims at this property in the last 3 years? What carrier currently insures it and at what premium?
- What's the average days-on-market for RENTAL listings here right now (not sales)? A rising rental-DOM trend means longer vacancies and softer asking-rent achievability than the comps imply.
- What's the recent tenant-quality profile in this submarket — average credit score on applications, eviction rate, late-payment / NSF rate, and stable-employment percentage? A property-management company in the area should have these aggregated.
- How much new for-sale + rental construction is in the pipeline within 1–3 miles? Heavy new supply typically softens prices + rents 12–24 months out; constrained supply supports both.
Investment metrics
- 1% rule
- 2.17% ✓
- Cap rate
- 16.52%
- Cash-on-cash
- 36.51%
- DSCR
- 2.62
- GRM
- 3.8
CMA / ARV
- ARV (median comp)
- $176,533
- List price
- $89,900
- Delta
- -49.07%
- Verdict
- UNDERPRICED
- Comps
- 20 within 1.0 mi
Show comp detail 12 sales within ~0.75 mi
| Address | Dist | Beds/Ba | Sqft | Sold | Price | $/sf | Match |
|---|---|---|---|---|---|---|---|
| 827 Belgian Ave | 0.16mi | 3/2.0 | 1,260 (0%) | 2mo | $130,000 | $103 | 87 |
| 646 E 37th St | 0.36mi | 3/2.0 | 1,284 (+2%) | 0mo | $94,000 | $73 | 76 |
| 604 E 35th St E | 0.54mi | 3/1.0 | 1,260 (0%) | 1mo | $94,000 | $75 | 74 |
| 515 E 35th St | 0.57mi | 3/1.5 | 1,260 (0%) | 1mo | $135,999 | $108 | 71 |
| 608 Chestnut Hill Ave | 0.32mi | 2/1.0 (-1) | 1,156 (-8%) | 1mo | $73,000 | $63 | 66 |
| 3633 Elkader Rd | 0.46mi | 2/1.5 (-1) | 1,304 (+4%) | 1mo | $265,000 | $203 | 65 |
| 800 Radnor Ave | 0.60mi | 3/1.5 | 1,224 (-3%) | 2mo | $99,900 | $82 | 64 |
| 3825 Elkader Rd | 0.35mi | 4/2.0 (+1) | 1,352 (+7%) | 1mo | $275,000 | $203 | 62 |
| 3807 Elkader Rd | 0.38mi | 4/2.0 (+1) | 1,352 (+7%) | 0mo | $235,000 | $174 | 61 |
| 609 Melville Ave | 0.51mi | 4/2.0 (+1) | 1,364 (+8%) | 1mo | $120,000 | $88 | 52 |
| 4100 N Charles St #1110 | 0.67mi | 2/2.0 (-1) | 1,363 (+8%) | 0mo | $339,000 | $249 | 46 |
| 4100 N Charles St N #803 | 0.67mi | 2/2.0 (-1) | 1,421 (+13%) | 2mo | $305,000 | $215 | 37 |
Match score weights: distance 35% · size 25% · config 20% · recency 20%. Top-matched comps best support the ARV.
Projected returns pro-forma
-3.0% appreciation · 1.63% rent growth · sell at horizon
- IRR
- 30.6%
- Equity multiple
- 2.26×
- Total profit
- $31,684
- Equity at exit
- $13,404
- IRR
- 37.0%
- Equity multiple
- 4.19×
- Total profit
- $80,311
- Equity at exit
- $7,773
Cash invested: $25,172 (down + closing). Projections, not guarantees.
Landlord ↔ Tenant lean methodology
- Overall (CITY)
- 12 Strongly Tenant-Friendly
- State Maryland
- 27 Tenant-Leaning · D+14
- County
- — inherits STATE
- City Baltimore
- 12 Strongly Tenant-Friendly · D+58
ZIP-level market 21218
- Rents YoY
- 1.6%
- Active inventory
- 325
- Price-to-rent
- 3.8×
Monthly cashflow live
- Estimated rent
- $1,953 high interval (Pro) →
- Mortgage (P&I)
- −$471
- Tax from tax record
- −$268 /mo · $3,218/yr
- Insurance
- −$37
- HOA
- −$0
- Vacancy / Maint / Mgmt
- −$410
- Net cashflow
- $766
Break-even live
UW: 25.0% down · 7.5% · 30yr · 1.5% tax · 5.0% vac · 8.0% maint · 8.0% mgmt
Financing live
Cash to close
- Down payment
- $22,475
- Closing costs
- $2,697
- Reserves months
- —
- Total cash needed
- —
Loan-product check · same deal, 3 products live
Conventional
25% down · 7.5% · 30yr
- Down + closing
- —
- Monthly P&I
- —
- Monthly cashflow
- —
- DSCR
- —
- Eligible?
- —
Personal DTI + credit; lowest rate.
DSCR
20% down · 8.5% · 30yr
- Down + closing
- —
- Monthly P&I
- —
- Monthly cashflow
- —
- DSCR
- —
- Eligible?
- —
No personal income docs; deal must DSCR.
Hard money
10% down · 12.0% · 12mo
- Down + closing
- —
- Monthly P&I
- —
- Monthly cashflow
- —
- DSCR
- —
- Eligible?
- —
Short-term bridge; refi at stabilization.
Rent comps 40 comps
| Address | Beds | Baths | Sqft | Rent | $/sqft | DOM | Units | Dist |
|---|---|---|---|---|---|---|---|---|
| 513 E 41st St Baltimore, MD | 4.0 | 1.5 | 1620 | $1,900 | $1.17 | 43d | 1 | 0.08mi |
| 4033 Greenmount Ave Baltimore, MD | 2.0 | 2.5 | 1860 | $2,550 | $1.37 | 23d | 1 | 0.13mi |
| 4303 York Rd #3 Baltimore, MD | 2.0 | 1.0 | 1680 | $1,400 | $0.83 | 43d | 1 | 0.19mi |
| 720 Springfield Ave Baltimore, MD | 3.0 | 1.0 | 1160 | $2,000 | $1.72 | 43d | 1 | 0.20mi |
| 706 E 43rd St Baltimore, MD | 4.0 | 1.5 | 1596 | $1,899 | $1.19 | 1d | 1 | 0.22mi |
| 815 Gilrubin Ct Baltimore, MD | 2.0 | 1.0 | 900 | $1,695 | $1.88 | 43d | 1 | 0.25mi |
| 812 Nat Ct Apt 12 Baltimore, MD | 2.0 | 1.0 | 900 | $1,295 | $1.44 | 43d | 1 | 0.28mi |
| 3721 Ellerslie Ave Baltimore, MD | 1.0–3.0 | 1.0–2.0 | 894 | $1,603 | $1.79 | 1d | 1 | 0.30mi |
| 612 Chestnut Hill Ave Unit 1 Baltimore, MD | 2.0 | 1.0 | 900 | $1,999 | $2.22 | 43d | 1 | 0.32mi |
| 4407 Old York Rd Baltimore, MD | 3.0 | 1.5 | 1356 | $1,574 | $1.16 | 43d | 1 | 0.33mi |
| 4407 Old York Rd Baltimore, MD | 3.0 | 1.5 | 1356 | $1,574 | $1.16 | 20d | 1 | 0.33mi |
| 531 Willow Ave Unit Na Baltimore, MD | 4.0 | 1.0 | 1300 | $1,800 | $1.38 | 20d | 1 | 0.40mi |
| 835 E Cold Spring Ln Baltimore, MD | 2.0 | 1.5 | 997 | $1,400 | $1.40 | 23d | 1 | 0.47mi |
| 721 E 36th St Unit Na Baltimore, MD | 2.0 | 1.0 | 1156 | $1,650 | $1.43 | 43d | 1 | 0.49mi |
| 3529 Greenmount Ave Baltimore, MD | 3.0 | 2.0 | 1316 | $1,575 | $1.20 | 43d | 1 | 0.52mi |
| 724 E 35th St Baltimore, MD | 3.0 | 1.5 | 1368 | $2,000 | $1.46 | 14d | 1 | 0.57mi |
| 804 Radnor Ave Baltimore, MD | 3.0 | 1.0 | 1654 | $2,000 | $1.21 | 43d | 1 | 0.59mi |
| 514 Radnor Ave Baltimore, MD | 3.0 | 1.5 | 1575 | $1,500 | $0.95 | 44d | 1 | 0.63mi |
| 1040 E 33rd St Baltimore, MD | 1.0–2.0 | 1.0–2.0 | 775 | $1,525 | $1.97 | 2d | 10 | 0.68mi |
| 3601 Greenway #101 Baltimore, MD | 2.0 | 2.0 | 1470 | $2,700 | $1.84 | 3d | 1 | 0.68mi |
| 3811 Canterbury Rd Baltimore, MD | 2.0 | 1.0–2.0 | 975 | $2,495 | $2.56 | 12d | 5 | 0.73mi |
| 348 E University Pkwy Baltimore, MD | 4.0 | 2.0 | 1809 | $2,400 | $1.33 | 43d | 1 | 0.74mi |
| 1 E University Pkwy Baltimore, MD | 1.0–3.0 | 1.0–2.0 | 1045 | $2,500 | $2.39 | 4d | 2 | 0.74mi |
| 1504 Upshire Rd Unit 1E Baltimore, MD | 2.0 | 1.0 | 1000 | $1,400 | $1.40 | 43d | 1 | 0.75mi |
| 3501 Saint Paul St Baltimore, MD | 3.0 | 1.0–2.5 | 916 | $2,700 | $2.95 | 1d | 172 | 0.78mi |
| 510 Winston Ave Baltimore, MD | 4.0 | 2.0 | 1600 | $2,800 | $1.75 | 20d | 1 | 0.79mi |
| 543 Chateau Ave Baltimore, MD | 3.0 | 2.0 | 1152 | $1,900 | $1.65 | 4d | 1 | 0.80mi |
| 3222 Ellerslie Ave Baltimore, MD | 4.0 | 1.5 | 1550 | $1,950 | $1.26 | 43d | 1 | 0.80mi |
| 1260 Rossiter Ave Baltimore, MD | 2.0 | 1.0 | 710 | $1,250 | $1.76 | 1d | 37 | 0.80mi |
| 108 W 39th St Baltimore, MD | 2.0 | 1.0–2.0 | 1350 | $2,189 | $1.62 | 2d | 11 | 0.81mi |
| 416 Winston Ave Unit 426-01 Baltimore, MD | 2.0 | 1.0 | 890 | $1,250 | $1.40 | 43d | 1 | 0.81mi |
| 105 W 39th St Baltimore, MD | 2.0 | 1.0 | 753 | $2,250 | $2.99 | 4d | 1 | 0.82mi |
| 1539 Ralworth Rd Baltimore, MD | 3.0 | 2.0 | 1580 | $1,950 | $1.23 | 14d | 1 | 0.82mi |
| 3221 Guilford Ave Apt A Baltimore, MD | 3.0 | 1.5 | 1025 | $2,925 | $2.85 | 17d | 1 | 0.84mi |
| 1224 Winston Ave Baltimore, MD | 3.0 | 2.0 | 1248 | $2,100 | $1.68 | 17d | 1 | 0.87mi |
| 616 Montpelier St Baltimore, MD | 3.0 | 1.0 | 1150 | $1,750 | $1.52 | 10d | 1 | 0.87mi |
| 1617 Argonne Dr Baltimore, MD | 4.0 | 2.0 | 1200 | $2,550 | $2.12 | 43d | 1 | 0.88mi |
| 1502 Fernley Rd Baltimore, MD | 3.0 | 2.0 | 1350 | $2,800 | $2.07 | 43d | 1 | 0.88mi |
| 711 1/2 McCabe Ave Baltimore, MD | 4.0 | 3.0 | 1204 | $2,350 | $1.95 | 4d | 1 | 0.91mi |
| 3201 Saint Paul St Baltimore, MD | 1.0–2.0 | 1.5–2.0 | 1532 | $3,200 | $2.09 | 2d | 1 | 0.91mi |
Listing history 18 events
-
2026-06-18days on market $89,900 Active 96 DOM
-
2026-06-17days on market $89,900 Active 95 DOM
-
2026-06-16days on market $89,900 Active 94 DOM
-
2026-06-15days on market $89,900 Active 93 DOM
-
2026-06-13days on market $89,900 Active 91 DOM
-
2026-06-09days on market $89,900 Active 87 DOM
-
2026-06-08days on market $89,900 Active 86 DOM
-
2026-06-07days on market $89,900 Active 85 DOM
-
2026-06-04days on market $89,900 Active 82 DOM
-
2026-06-03days on market $89,900 Active 81 DOM
-
2026-06-02days on market $89,900 Active 80 DOM
-
2026-06-02price $89,900 Active 79 DOM
-
2026-06-01days on market $99,900 Active 79 DOM
-
2026-05-31days on market $99,900 Active 78 DOM
-
2026-04-16price $99,900 971-char remark
Show marketing remark (971 chars)
Pen Lucy over here on the north end of Baltimore and this is a cool little classic, end of group Baltimore row home with a screened in front porch and three floors of living space. This neighborhood is a hidden treasure just south of Govans right along York Road and it's even convenient to Charles Village. Situated on a quaint little street here with awesome curb appeal, and friendly neighbors. You will be treated to a full size 3 bedroom row home with a sizable front and rear yard that offers privacy, wrapped up in a cool community vibe. Overall, the home is in good condition and actually doesn’t need much to finish out, and start enjoying. Whether you’re an owner occupant or want to add this to your rental collection, it’s pretty much a slam dunk. Don't miss out on the opportunity ! Restaurants, parks, and great schools are all nearby. Get in now while the prices are low! Buyer to determine if ground rent exists, seller will not redeem.
-
2026-03-14$114,900 Active 971-char remark
Show marketing remark (971 chars)
Pen Lucy over here on the north end of Baltimore and this is a cool little classic, end of group Baltimore row home with a screened in front porch and three floors of living space. This neighborhood is a hidden treasure just south of Govans right along York Road and it's even convenient to Charles Village. Situated on a quaint little street here with awesome curb appeal, and friendly neighbors. You will be treated to a full size 3 bedroom row home with a sizable front and rear yard that offers privacy, wrapped up in a cool community vibe. Overall, the home is in good condition and actually doesn’t need much to finish out, and start enjoying. Whether you’re an owner occupant or want to add this to your rental collection, it’s pretty much a slam dunk. Don't miss out on the opportunity ! Restaurants, parks, and great schools are all nearby. Get in now while the prices are low! Buyer to determine if ground rent exists, seller will not redeem.
-
1989-10-30soldstatus $36,000
-
1989-06-06soldstatus $15,000
ⓘ Source: listings_history table (triggers on properties + properties_extension) + one-shot
backfill from property_details.listing_events for pre-trigger history.
Tax reassessment forecast MD · Partial reset (capped growth)
- Current annual tax
- $3,218 · $268/mo
- Projected year-2 tax
- $3,218 · $268/mo
- Expected delta
- $0/yr ($0/mo · 0.0%)
ⓘ Screening estimate from a state-policy table — verify with the county assessor before closing.
Climate risk First Street
- Flood 1/10 Low FEMA zone X (unshaded) · 0% chance over 30 yrs
- Wildfire 1/10 Low
- Heat 7/10 Severe 7 d/yr ≥103°F today · 15 d/yr by 30 yrs out
- Wind 6/10 Major 27% chance of damaging wind over 30 yrs
- Air quality 4/10 Moderate 6 unhealthy d/yr today · 7 by 30 yrs out
Nearby sold comps map
Loading sold comps map…
Walkable amenities ~0.75 mi
Loading nearby amenities…
Taxation est. · year 1
- Rental income
- $23,438
- − Mortgage interest
- −$5,036
- − Property taxes
- −$3,218
- − Insurance
- −$450
- − Repairs & maintenance
- −$1,875
- − Management
- −$1,875
- − Depreciation
- −$2,615
- Taxable income
- $8,369
- Est. tax owed @ 24.0%
- −$2,009
- After-tax cash flow
- $7,183/yr
For passive investors: Depreciation is non-cash, so a rental often shows a tax loss while cash-flowing — sheltering income. Rental losses are passive: they offset passive income freely, and up to $25,000/yr can offset ordinary (W-2) income if you actively participate and your MAGI is under $100k (phasing out to $0 by $150k); unused losses carry forward. On sale, claimed depreciation is recaptured at up to 25%, and gains may owe capital-gains tax (a 1031 exchange can defer both). Figures are a year-1 estimate at your 24.0% rate — not tax advice; consult a CPA.
Schools (NCES district)
- District
- Baltimore City Public Schools
- NCES district ID
- 2400090
- Math proficiency
- 7% ▼ -9.00%
- Reading proficiency
- 16% ▼ -5.00%
- Median HH income
- $42,108
- Composite
- 10.08/100
- National rank
- #9805
- State rank
- #24 of 24 in MD
Livability — Baltimore
- Score
- 76/100
- State rank
- #90
- US rank
- #3396
Category grades
Schools grade is shown separately in the Schools card above.
Census & demographics
- Census place
- Baltimore, MD
- County
- Baltimore City · 558,601 people
- City population
- 588,727
- Metro
- Baltimore-Columbia-Towson, MD
- Population (ZIP)
- 44,014
- Household income
- $62,488
- Rent vs Own
- Severe rent burden
- 2564.0
Population outlook (Baltimore County) Hauer SSP2
- Today (2025)
- 624,249 people
- By 2030
- 621,541 · -0.4%
- By 2040
- 609,756 · -2.3%
- By 2050
- 597,249 · -4.3%
- By 2075
- 552,236 · -11.5%
- By 2100
- 513,934 · -17.7%
Race, ethnicity, and origin ACS 2023
- Neighborhood character
- Diverse neighborhood (Simpson 0.58)
- Race & ethnicity
- Black 60% White 26% Two or more races 6% Hispanic / Latino 5% Asian 5%
- Hispanic origin (detail)
- Common ancestry
- Romanian 2% Italian 1% Scotch-Irish 1%
- Foreign-born
- 10% · Canada, China, South Korea
- Languages at home
- 87% English-only · Spanish 4% French/Haitian/Cajun 2% Chinese 2%
Political lean MEDSL · Baltimore
- 2024 margin
- Solid D (+73.0) · D 85.2% · R 12.2% · Other 2.6%
- 2008→2024 swing
- -2.5pp toward R · 2008: 75.5pp · 2024: 73.0pp
- All cycles
- 2024: D+73.0 2020: D+76.6 2016: D+74.6 2012: D+76.4 2008: D+75.5
Not yet ingested
- Civics
- —
Market trends
- HPI YoY
- ▼ -463.14%
- Current HPI
- 292.3986
- Rent YoY
- ▲ 1.63%
- Metro
- Baltimore-Columbia-Towson, MD
- State GDP YoY
- ▲ 2.97%
- F500 in state
- 12
Industry mix (Fortune 500 HQ in MD)
| Industry | F500 HQs | Revenue |
|---|---|---|
| Aerospace / Defense | 1 | $71B |
|
||
| Utilities | 1 | $25B |
|
||
| Hotels | 1 | $24B |
|
||
| Consumer Goods | 1 | $7B |
|
||
| Real Estate | 1 | $6B |
|
||
| Chemicals | 1 | $2B |
|
||
Price history
+566.0% since first listed4 events — show timeline
- 2026-04-16 Price Changed $99,900 BRIGHT MLS
- 2026-03-14 Listed $114,900 BRIGHT MLS
- 1989-10-30 Sold (Public Records) $36,000 Public Records
- 1989-06-06 Sold (Public Records) $15,000 Public Records
Property tax history
+3.2%/yrLatest (2025): $3,218 · +8.4% YoY. Source: county tax records.
Cash-flow waterfall
monthlySold comps — $/sqft
last 12 mo · ≤1 miLoading sold comps…