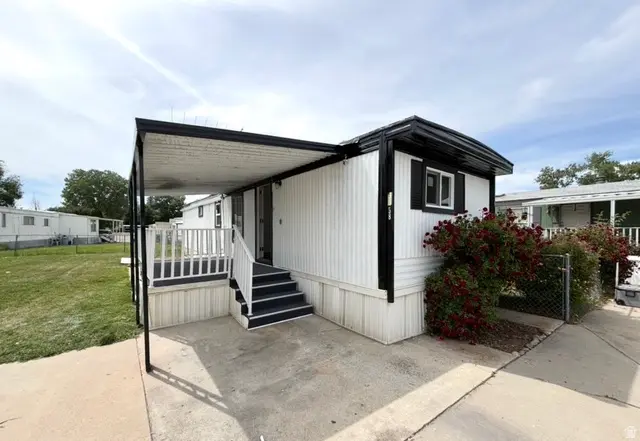
4375 S Weber Dr #58 · Riverdale, UT
Flood risk No data
- FEMA flood zone
- —
- Chance of flooding over 30 yrs
- —
- Est. flood insurance / yr
- —
Fire risk No data
- Est. fire insurance / yr
- —
Heat risk No data
- Hot days now (above threshold)
- —
- Hot days in 30 yrs
- —
Wind risk No data
- Chance of severe wind over 30 yrs
- —
Air-quality risk No data
- Unhealthy air days now
- —
- Unhealthy air days in 30 yrs
- —
Risk factors via First Street. Map © Google.
Why this score? — see what drove the D+ grade
The composite is a weighted blend of 9 inputs, each scored 0–100. Each bar is that input's sub-score; the figure is the points it added to the 100-point composite (weight × sub-score).
- Cash flow +15.0/30.0
- ARV discount +7.5/15.0
- 1% rule +5.0/10.0
- DSCR +5.0/10.0
- Livability +4.0/5.0
- Rent growth +3.7/5.0
- Schools +3.2/10.0
- Condition / age +2.5/5.0
- Appreciation +0.0/10.0
$29,485
🖨 Deal sheet 📄 Offer letter ✓ Due diligence
Listing remarks
Welcome to Riverside Village! This well-maintained 1971 mobile home offers 2 bedrooms, 2 bathrooms, and 660 sq ft of comfortable living space. Enjoy efficient year-round comfort with a newer mini-split air conditioning and heating system. The functional layout maximizes space while providing a cozy and inviting atmosphere. Conveniently located within the Riverside Village community, close to shopping, dining, and everyday amenities. Affordable living with great potential for owner-occupants or investors alike!
Key facts
- Close to dining
- Functional layout
- Close to shopping
Tags
Property features AI
Finance
- Other: Subdivision: RIVERSIDE VILLAGE; Zoned for single-family
- HOA & community: Homeowners association (monthly fee); Monthly HOA fee of $837; HOA covers water, sewer and trash; Community amenities include pet rules, pets permitted, picnic area, storage
Exterior
- Parking: 2 uncovered open parking spaces
- Utilities: Natural gas connected; Electricity connected; Sewer connected; Culinary water connected
- Home design: Manufactured home; Single-story; Faces east; Residential use
- Construction: Aluminum and rubber roof; Built and standing
- Exterior features: Cul-de-sac lot; Full landscaping
Interior
- Kitchen: Range hood; Refrigerator
- Bedrooms: 2 bedrooms on the main level
- Flooring: Carpet; Laminate
- Bathrooms: 2 full bathrooms
- Heating & cooling: Gas central heating; Central air conditioning
- Interior features: Blinds on some windows; Single-level living; No basement; 7 total rooms
- Laundry & utility: Electric dryer hookup
Neighborhood map
What this means for you Summary
Snapshot
- This is a 2-bed/2.0-bath land listed at $29k.
Deal economics
- At list price, monthly cash flow is $-32 ($-389/yr) — negative.
- To cash-flow at today's rent, offer at most $25k (15.9% below list).
- Meets the 1% rule at list price ($1k rent vs $29k).
- Recommended offer: $25k (15.9% below list) — sets the bar for cash-flow.
Location & tenants
- Location reads 81/100 on livability (#33 in UT, #1,547 nationally) — a professional / high-income tenant draw. Strengths: amenities A+, commute A+, housing A+; Watch: crime F.
- Weber District (suburban): math 36% / reading 35% proficiency, ranked #56 of 80 in UT (top 70%) — families likely to look elsewhere, expect single-tenant / working-renter base with shorter leases.
- Zoned schools: Riverdale School (math 31% / reading 27%, grade F, #444 of 585 statewide, top 77%, 416 students, 42% FRL); T.H. Bell Jr High (math 12% / reading 16%, grade F, #136 of 138 statewide, top 99%, 670 students, 42% FRL); Bonneville High (math 15% / reading 36%, grade F, #139 of 171 statewide, top 81%, 1,361 students, 29% FRL).
- Zoned-school proficiency averages 23% at this address vs 36% district-wide (-13 pts) — the specific schools serving this property underperform the Weber District average; the district grade overstates school quality for this exact location.
- Market conditions: Rents rising fast (+4.7%/yr); 209 active listings in the ZIP; 4 comparable units currently listed for rent nearby; rentals at typical pace (median 23d on market — plan ~3-4 weeks tenant-placement turnaround); solid renter incomes; 1,630 units permitted in Weber County in 2024 (521 in 5+ unit buildings).
Forward outlook
- Local home prices are declining (-3.0%/yr); year-one equity from $204 of loan paydown is wiped out by about $885 of value loss. Plan a longer hold.
- Weber County population projected at +24% by 2050 — long-run rental-demand tailwind backs the buy-and-hold thesis.
Negotiation context
- It's been on market 34 days — a 3% lower offer ($29k) is reasonable based on typical stale-listing flexibility.
- 3 sale attempts since 26y ago; this cycle's ask has dropped $3k (8%) from the opening price — seller is motivated, your offer sets the floor, not the list.
Risks & watch-outs
- Watch-outs: HOA is 66% of rent.
Questions for the listing agent
- What do current leases actually rent for vs. the listed asking? Can we see a recent rent roll and the last 12 months of T-12 income?
- It's been on market 34 days. Have you received any prior offers? Is the seller open to a 16% concession, seller financing, or rate buy-down credit?
- Built in 1971 — when were the roof, HVAC, electrical panel, plumbing, and water heater last replaced?
- What does the HOA fee cover, when was the last increase, and are there any pending special assessments or reserve-fund shortfalls?
- Is there a deadline driving the sale (1031 exchange, divorce, estate, relocation)? That informs how much negotiation room exists.
- Schools are D-rated, which usually means shorter tenancies and higher turnover. Who's the typical renter profile here, and what's been the actual vacancy rate?
- Crime grade is F in this area — have there been break-ins, vandalism, or insurance claims at this property in the last 3 years? What carrier currently insures it and at what premium?
- The area grade is low — what's the realistic commute time and amenity access for the typical tenant pool here? Any planned neighborhood developments (good or bad) we should know about?
- What's the average days-on-market for RENTAL listings here right now (not sales)? A rising rental-DOM trend means longer vacancies and softer asking-rent achievability than the comps imply.
- What's the recent tenant-quality profile in this submarket — average credit score on applications, eviction rate, late-payment / NSF rate, and stable-employment percentage? A property-management company in the area should have these aggregated.
- How much new for-sale + rental construction is in the pipeline within 1–3 miles? Heavy new supply typically softens prices + rents 12–24 months out; constrained supply supports both.
Investment metrics
- 1% rule
- 4.33% ✓
- Cap rate
- 4.97%
- Cash-on-cash
- -4.71%
- DSCR
- 0.79
- GRM
- 1.9
CMA / ARV
No comps found within radius.
Projected returns pro-forma
-3.0% appreciation · 4.67% rent growth · sell at horizon
- IRR
- -12.7%
- Equity multiple
- 0.50×
- Total profit
- $-4,130
- Equity at exit
- $4,396
- IRR
- 6.1%
- Equity multiple
- 1.63×
- Total profit
- $5,169
- Equity at exit
- $2,549
Cash invested: $8,256 (down + closing). Projections, not guarantees.
Landlord ↔ Tenant lean methodology
- Overall (STATE)
- 86 Strongly Landlord-Friendly
- State Utah
- 86 Strongly Landlord-Friendly · R+15
- County
- — inherits STATE
- City
- — inherits STATE
ZIP-level market 84405
- Rents YoY
- 4.7%
- Active inventory
- 209
- Price-to-rent
- 1.9×
Monthly cashflow live
- Estimated rent
- $1,276 medium interval (Pro) →
- Mortgage (P&I)
- −$155
- Tax est. 1.5%
- −$37 /mo · $442/yr
- Insurance
- −$12
- HOA
- −$837
- Vacancy / Maint / Mgmt
- −$268
- Net cashflow
- $-32
Break-even live
UW: 25.0% down · 7.5% · 30yr · 1.5% tax · 5.0% vac · 8.0% maint · 8.0% mgmt
Financing live
Cash to close
- Down payment
- $7,371
- Closing costs
- $885
- Reserves months
- —
- Total cash needed
- —
Loan-product check · same deal, 3 products live
Conventional
25% down · 7.5% · 30yr
- Down + closing
- —
- Monthly P&I
- —
- Monthly cashflow
- —
- DSCR
- —
- Eligible?
- —
Personal DTI + credit; lowest rate.
DSCR
20% down · 8.5% · 30yr
- Down + closing
- —
- Monthly P&I
- —
- Monthly cashflow
- —
- DSCR
- —
- Eligible?
- —
No personal income docs; deal must DSCR.
Hard money
10% down · 12.0% · 12mo
- Down + closing
- —
- Monthly P&I
- —
- Monthly cashflow
- —
- DSCR
- —
- Eligible?
- —
Short-term bridge; refi at stabilization.
Rent comps 4 comps
| Address | Beds | Baths | Sqft | Rent | $/sqft | DOM | Units | Dist |
|---|---|---|---|---|---|---|---|---|
| 4189 S 300 W Riverdale, UT | 1.0–2.0 | 1.0 | 700 | $1,150 | $1.64 | 23d | 7 | 0.61mi |
| 4400 Washington Blvd Ogden, UT | 1.0–2.0 | 1.0–2.0 | 891 | $1,550 | $1.74 | 23d | 2 | 1.20mi |
| 3697 S Riverdale Rd Riverdale, UT | 2.0 | 1.0–2.0 | 654 | $1,513 | $2.31 | 14d | 4 | 1.26mi |
| 3704 Grant Ave Unit 3704 Ogden, UT | 2.0 | 1.0 | 750 | $845 | $1.13 | 19d | 1 | 1.29mi |
HOA detail
- Monthly dues
- $837 · $10,044/yr
Listing history 20 events
-
2026-06-18days on market $29,485 Active 34 DOM
-
2026-06-17days on market $29,485 Active 33 DOM
-
2026-06-16days on market $29,485 Active 32 DOM
-
2026-06-15days on market $29,485 Active 31 DOM
-
2026-06-14days on market $29,485 Active 29 DOM
-
2026-06-10pricedays on market $29,485 Active 26 DOM
-
2026-06-09days on market $29,985 Active 25 DOM
-
2026-06-08days on market $29,985 Active 24 DOM
-
2026-06-07days on market $29,985 Active 23 DOM
-
2026-06-05days on market $29,985 Active 20 DOM
-
2026-06-03days on market $29,985 Active 19 DOM
-
2026-06-02days on market $29,985 Active 18 DOM
-
2026-06-01days on market $29,985 Active 17 DOM
-
2026-05-31days on market $29,985 Active 16 DOM
-
2026-05-31days on market $29,985 Active 15 DOM
-
2026-05-15$31,995 Active
-
2001-03-01historical
-
2000-11-03$40,000
-
2000-03-30historical
-
2000-01-31$35,500
ⓘ Source: listings_history table (triggers on properties + properties_extension) + one-shot
backfill from property_details.listing_events for pre-trigger history.
Nearby sold comps map
Loading sold comps map…
Walkable amenities ~0.75 mi
Loading nearby amenities…
Taxation est. · year 1
- Rental income
- $15,316
- − Mortgage interest
- −$1,652
- − Property taxes
- −$442
- − Insurance
- −$147
- − Repairs & maintenance
- −$1,225
- − Management
- −$1,225
- − HOA
- −$10,044
- − Depreciation
- −$858
- Taxable loss
- −$277
- Est. tax savings @ 24.0%
- +$67
- After-tax cash flow
- $-323/yr
For passive investors: Depreciation is non-cash, so a rental often shows a tax loss while cash-flowing — sheltering income. Rental losses are passive: they offset passive income freely, and up to $25,000/yr can offset ordinary (W-2) income if you actively participate and your MAGI is under $100k (phasing out to $0 by $150k); unused losses carry forward. On sale, claimed depreciation is recaptured at up to 25%, and gains may owe capital-gains tax (a 1031 exchange can defer both). Figures are a year-1 estimate at your 24.0% rate — not tax advice; consult a CPA.
Schools (NCES district)
- District
- Weber District
- NCES district ID
- 4901200
- Math proficiency
- 36% ▼ -4.00%
- Reading proficiency
- 35% ▼ -5.00%
- Median HH income
- $65,750
- Composite
- 32.28/100
- National rank
- #5757
- State rank
- #56 of 80 in UT
Livability — Riverdale
- Score
- 81/100
- State rank
- #33
- US rank
- #1547
Category grades
Schools grade is shown separately in the Schools card above.
Census & demographics
- Census place
- Riverdale, UT
- County
- Weber County · 260,557 people
- Metro
- Ogden-Clearfield, UT
- Population (ZIP)
- 34,818
- Household income
- $84,106
- Rent vs Own
- Severe rent burden
- 693.0
Population outlook (Weber County) Hauer SSP2
- Today (2025)
- 274,329 people
- By 2030
- 288,577 · +5.2%
- By 2040
- 314,848 · +14.8%
- By 2050
- 338,710 · +23.5%
- By 2075
- 384,412 · +40.1%
- By 2100
- 409,305 · +49.2%
Race, ethnicity, and origin ACS 2023
- Neighborhood character
- Predominantly White (79%)
- Race & ethnicity
- White 79% Hispanic / Latino 13% Two or more races 7% Asian 2% Black 1%
- Hispanic origin (detail)
- Mexican 11%
- Common ancestry
- Italian 5% Iranian 3% Slovak 2%
- Foreign-born
- 5% · Canada
- Languages at home
- 89% English-only · Spanish 8% Other Indo-European 1% Other Asian/Pacific 1%
Political lean MEDSL · Weber
- 2024 margin
- Strong R (+23.5) · D 36.8% · R 60.3% · Other 2.9%
- 2008→2024 swing
- +4.1pp toward D · 2008: -27.6pp · 2024: -23.5pp
- All cycles
- 2024: R+23.5 2020: R+22.7 2016: R+20.0 2012: R+46.0 2008: R+27.6
Not yet ingested
- Civics
- —
Market trends
- HPI YoY
- ▼ -253.19%
- Current HPI
- 288.6978
- Rent YoY
- ▲ 4.67%
- Metro
- Ogden-Clearfield, UT
- State GDP YoY
- ▲ 3.54%
- F500 in state
- 2
Industry mix (Fortune 500 HQ in UT)
| Industry | F500 HQs | Revenue |
|---|---|---|
| Financial Services | 1 | $3B |
|
||
Price history
-9.9% since first listed5 events — show timeline
- 2026-05-15 Listed $31,995 WFRMLS
- 2001-03-01 Listing Removed — WFRMLS
- 2000-11-03 Listed $40,000 WFRMLS
- 2000-03-30 Listing Removed — WFRMLS
- 2000-01-31 Listed $35,500 WFRMLS
Cash-flow waterfall
monthlySold comps — $/sqft
last 12 mo · ≤1 miLoading sold comps…