899 Conklin Rd · Binghamton, NY
Flood risk 10/10 · Severe
- FEMA flood zone
- AE
- Chance of flooding over 30 yrs
- 0.99%
- Est. flood insurance / yr
- $2,026 – $9,024
Fire risk 1/10 · Minimal
- Est. fire insurance / yr
- $691 – $1,283
Heat risk 3/10 · Minor
- Hot days now (above 94°F)
- 7 days/yr
- Hot days in 30 yrs
- 16 days/yr
Wind risk 2/10 · Minimal
- Chance of severe wind over 30 yrs
- 2.0%
Air-quality risk 2/10 · Minimal
- Unhealthy air days now
- 0 days/yr
- Unhealthy air days in 30 yrs
- 1 days/yr
Risk factors via First Street. Map © Google.
Why this score? — see what drove the A grade
The composite is a weighted blend of 9 inputs, each scored 0–100. Each bar is that input's sub-score; the figure is the points it added to the 100-point composite (weight × sub-score).
- Cash flow +30.0/30.0
- ARV discount +15.0/15.0
- 1% rule +10.0/10.0
- DSCR +10.0/10.0
- Appreciation +10.0/10.0
- Schools +4.6/10.0
- Livability +3.9/5.0
- Rent growth +2.5/5.0
- Condition / age +2.5/5.0
$105,000
🖨 Deal sheet 📄 Offer letter ✓ Due diligence
Listing remarks
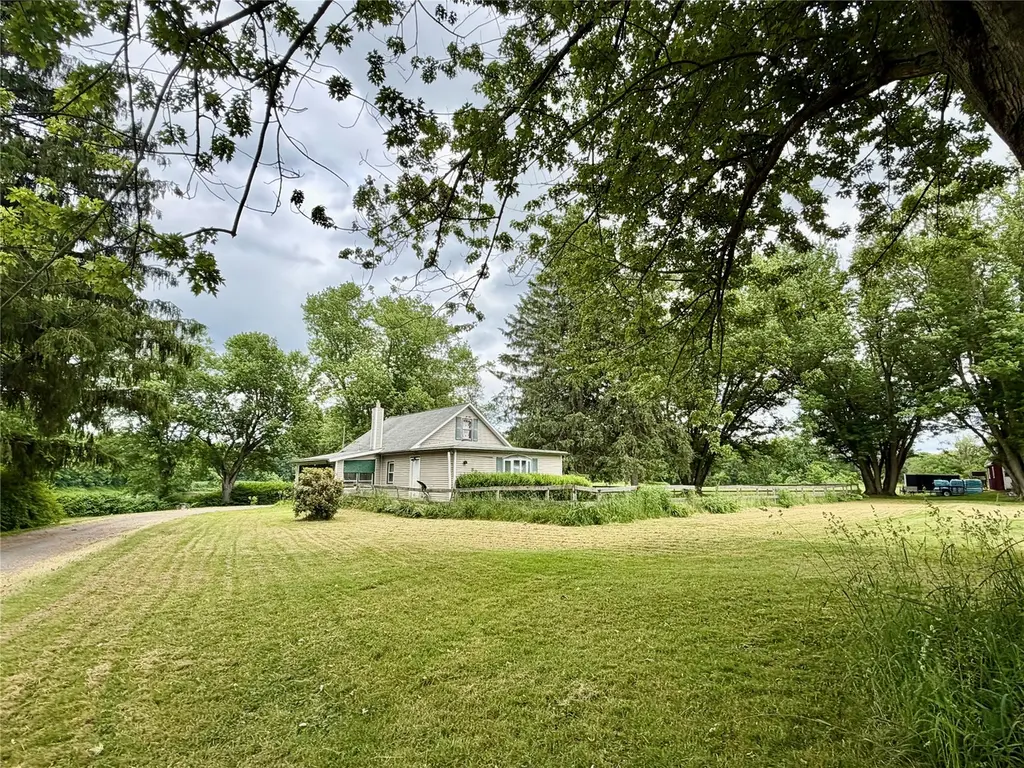
Bring your vision and make this riverfront property your own private retreat on almost 3 acres. A long driveway leads you back to a peaceful setting with water views, fruit trees, and easy access to the river, perfect for relaxing in nature. The very large fenced backyard provides space for gardens, pets, and play areas, with plenty of room to design the outdoor living spaces you’ve been dreaming of. Inside, the main floor offers convenient living with two bedrooms and a full bath, plus all-new appliances to give you a strong starting point. A third bedroom upstairs adds flexibility for guests, an office, or a cozy escape, while the rest of the home is ready for your updates, design i
Key facts
- Water views
- Riverfront property
- Almost 3 acres
Tags
Property features AI
Finance
- Other: Taxes listed (see broker for details)
Exterior
- Parking: Carport; Driveway
- Utilities: Public water; Public sewer; Cable available
- Home design: Single family residence; Residential property
- Construction: Vinyl siding; 1,500 above-grade finished area
- Exterior features: Enclosed porch; Porch; Shed(s); Level lot with views; Waterfront on a river
Interior
- Kitchen: Range; Free-Standing Range; Dishwasher; Refrigerator; Electric Water Heater
- Flooring: Hardwood floors; Vinyl flooring
- Bathrooms: 1 full bathroom
- Heating & cooling: Forced air heating; No central cooling
- Interior features: Range, Free-Standing Range, Refrigerator, Dishwasher, Electric Water Heater; Has basement; Cable available
- Laundry & utility: Washer and dryer included; Electric dryer hookup
Neighborhood map
What this means for you Summary
Snapshot
- This is a 3-bed/1.0-bath single-family listed at $105k.
Deal economics
- At list price, monthly cash flow is $-53 ($-639/yr) — negative.
- To cash-flow at today's rent, offer at most $96k (9.0% below list).
- Meets the 1% rule at list price ($2k rent vs $105k).
- Recommended offer: $96k (9.0% below list) — sets the bar for cash-flow.
- Cap rate 10.9% vs local median 6.4% in Binghamton — top-decile yield for the area; either an underpriced asset or a hidden risk that comps aren't pricing in. Stress-test before assuming the spread holds.
Location & tenants
- Location reads 78/100 on livability (#174 in NY, #2,710 nationally) — a middle-class / working-renter tenant base. Strengths: amenities A+, commute A+, cost of living A+; Watch: crime F, employment F.
- Susquehanna Valley Central School District (rural): math 48% / reading 57% proficiency, ranked #330 of 590 in NY (top 56%) — acceptable for families but not a draw, mixed tenant base, ~2y average lease.
- Zoned schools: F P Donnelly School (math 37% / reading 52%, grade F, #1,277 of 2,108 statewide, top 64%, 295 students, 48% FRL).
- Market conditions: 112 active listings in the ZIP; 340 units permitted in Broome County in 2024 (269 in 5+ unit buildings).
Forward outlook
- In year one you build about $11k of equity ($726 loan paydown + $10k appreciation (10.0% local appreciation)).
- Broome County population projected at -13% by 2050 — secular population decline; favor cash flow + early exit over multi-decade hold.
- At projected returns (10.0% appreciation + 3.0% rent growth), your $29k cash investment doubles in ~3 years — after that, you're playing with house money.
- By year 4, paydown + projected appreciation supports a ~$40k cash-out refi (75% LTV) — recoverable capital for the next deal without selling this one.
Negotiation context
- Only 8 days on market — expect competitive offers; lowballing is unlikely to land.
Risks & watch-outs
- Watch-outs: property tax is 2.9% of price; flood insurance adds $460/mo; built in 1940 — expect roof / HVAC / electrical / plumbing capex.
- Climate carrying-cost: in FEMA flood zone AE (mandatory federal flood insurance) — expect insurance premiums to compound above CPI over the hold.
Questions for the listing agent
- What do current leases actually rent for vs. the listed asking? Can we see a recent rent roll and the last 12 months of T-12 income?
- Built in 1940 — when were the roof, HVAC, electrical panel, plumbing, and water heater last replaced?
- Property tax is high relative to price — has the assessment been appealed recently, and will the sale trigger a re-assessment?
- What's the actual annual flood-insurance premium (NFIP or private), and is the property in a SFHA with mandatory coverage?
- Is there a deadline driving the sale (1031 exchange, divorce, estate, relocation)? That informs how much negotiation room exists.
- Schools are D-rated, which usually means shorter tenancies and higher turnover. Who's the typical renter profile here, and what's been the actual vacancy rate?
- Crime grade is F in this area — have there been break-ins, vandalism, or insurance claims at this property in the last 3 years? What carrier currently insures it and at what premium?
- What's the average days-on-market for RENTAL listings here right now (not sales)? A rising rental-DOM trend means longer vacancies and softer asking-rent achievability than the comps imply.
- What's the recent tenant-quality profile in this submarket — average credit score on applications, eviction rate, late-payment / NSF rate, and stable-employment percentage? A property-management company in the area should have these aggregated.
- How much new for-sale + rental construction is in the pipeline within 1–3 miles? Heavy new supply typically softens prices + rents 12–24 months out; constrained supply supports both.
Investment metrics
- 1% rule
- 1.51% ✓
- Cap rate
- 10.95%
- Cash-on-cash
- 16.62%
- DSCR
- 1.74
- GRM
- 5.5
CMA / ARV
- ARV (on-the-fly)
- $168,000
- Comps found
- 1
Show comp detail 1 sale within ~0.75 mi
| Address | Dist | Beds/Ba | Sqft | Sold | Price | $/sf | Match |
|---|---|---|---|---|---|---|---|
| 1 Crescent Dr | 0.54mi | 3/1.0 | 1,340 (-11%) | 5mo | $150,000 | $112 | 53 |
Match score weights: distance 35% · size 25% · config 20% · recency 20%. Top-matched comps best support the ARV.
Projected returns pro-forma
10.0% appreciation · 3.0% rent growth · sell at horizon
- IRR
- 22.9%
- Equity multiple
- 2.84×
- Total profit
- $54,174
- Equity at exit
- $94,592
- IRR
- 20.5%
- Equity multiple
- 6.54×
- Total profit
- $162,957
- Equity at exit
- $203,992
Cash invested: $29,400 (down + closing). Projections, not guarantees.
Landlord ↔ Tenant lean methodology
- Overall (STATE)
- 15 Strongly Tenant-Friendly
- State New York
- 15 Strongly Tenant-Friendly · D+10
- County
- — inherits STATE
- City
- — inherits STATE
ZIP-level market 13903
- Home prices YoY
- 4.3%
- Active inventory
- 112
- Price-to-rent
- 5.5×
Monthly cashflow live
- Estimated rent
- $1,585 medium interval (Pro) →
- Mortgage (P&I)
- −$551
- Tax from tax record
- −$250 /mo · $3,004/yr
- Insurance
- −$44
- Flood insurance flood zone
- −$460 /mo · $5,525/yr
- HOA
- −$0
- Vacancy / Maint / Mgmt
- −$333
- Net cashflow
- $-53
Break-even live
UW: 25.0% down · 7.5% · 30yr · 1.5% tax · 5.0% vac · 8.0% maint · 8.0% mgmt
Financing live
Cash to close
- Down payment
- $26,250
- Closing costs
- $3,150
- Reserves months
- —
- Total cash needed
- —
Loan-product check · same deal, 3 products live
Conventional
25% down · 7.5% · 30yr
- Down + closing
- —
- Monthly P&I
- —
- Monthly cashflow
- —
- DSCR
- —
- Eligible?
- —
Personal DTI + credit; lowest rate.
DSCR
20% down · 8.5% · 30yr
- Down + closing
- —
- Monthly P&I
- —
- Monthly cashflow
- —
- DSCR
- —
- Eligible?
- —
No personal income docs; deal must DSCR.
Hard money
10% down · 12.0% · 12mo
- Down + closing
- —
- Monthly P&I
- —
- Monthly cashflow
- —
- DSCR
- —
- Eligible?
- —
Short-term bridge; refi at stabilization.
Listing history 8 events
-
2026-06-19days on market $105,000 Active 8 DOM
-
2026-06-18days on market $105,000 Active 7 DOM
-
2026-06-17days on market $105,000 Active 6 DOM
-
2026-06-16days on market $105,000 Active 5 DOM
-
2026-06-15days on market $105,000 Active 4 DOM
-
2026-06-14days on market $105,000 Active 2 DOM
-
2026-06-13remarks 693-char remark
-
2026-06-13$105,000 Active 1 DOM
ⓘ Source: listings_history table (triggers on properties + properties_extension) + one-shot
backfill from property_details.listing_events for pre-trigger history.
Tax reassessment forecast NY · Partial reset (capped growth)
- Current annual tax
- $3,004 · $250/mo
- Projected year-2 tax
- $3,004 · $250/mo
- Expected delta
- $0/yr ($0/mo · 0.0%)
ⓘ Screening estimate from a state-policy table — verify with the county assessor before closing.
Climate risk First Street
- Flood 10/10 Extreme FEMA zone AE · 99% chance over 30 yrs
- Wildfire 1/10 Low
- Heat 3/10 Moderate 7 d/yr ≥94°F today · 16 d/yr by 30 yrs out
- Wind 2/10 Low 2% chance of damaging wind over 30 yrs
- Air quality 2/10 Low 0 unhealthy d/yr today · 1 by 30 yrs out
Nearby sold comps map
Loading sold comps map…
Walkable amenities ~0.75 mi
Loading nearby amenities…
Taxation est. · year 1
- Rental income
- $19,016
- − Mortgage interest
- −$5,882
- − Property taxes
- −$3,004
- − Insurance
- −$6,050
- − Repairs & maintenance
- −$1,521
- − Management
- −$1,521
- − Depreciation
- −$3,055
- Taxable loss
- −$2,017
- Est. tax savings @ 24.0%
- +$484
- After-tax cash flow
- $-155/yr
For passive investors: Depreciation is non-cash, so a rental often shows a tax loss while cash-flowing — sheltering income. Rental losses are passive: they offset passive income freely, and up to $25,000/yr can offset ordinary (W-2) income if you actively participate and your MAGI is under $100k (phasing out to $0 by $150k); unused losses carry forward. On sale, claimed depreciation is recaptured at up to 25%, and gains may owe capital-gains tax (a 1031 exchange can defer both). Figures are a year-1 estimate at your 24.0% rate — not tax advice; consult a CPA.
Schools (NCES district)
- District
- Susquehanna Valley Central School District
- NCES district ID
- 3628380
- Math proficiency
- 48% ▼ -9.00%
- Reading proficiency
- 57% ▲ 1.00%
- Median HH income
- $57,681
- Composite
- 45.56/100
- National rank
- #2599
- State rank
- #330 of 590 in NY
Livability — Binghamton
- Score
- 78/100
- State rank
- #174
- US rank
- #2710
Category grades
Schools grade is shown separately in the Schools card above.
Census & demographics
- County
- Broome County · 126,805 people
- City population
- 65,170
- Metro
- Binghamton, NY
- Population (ZIP)
- 17,569
- Household income
- $66,278
- Rent vs Own
- Severe rent burden
- 602.0
Population outlook (Broome County) Hauer SSP2
- Today (2025)
- 187,989 people
- By 2030
- 183,066 · -2.6%
- By 2040
- 172,228 · -8.4%
- By 2050
- 163,161 · -13.2%
- By 2075
- 153,641 · -18.3%
- By 2100
- 140,851 · -25.1%
Race, ethnicity, and origin ACS 2023
- Neighborhood character
- Predominantly White (80%)
- Race & ethnicity
- White 80% Black 9% Two or more races 6% Hispanic / Latino 4% Asian 1%
- Common ancestry
- Romanian 6% Slovak 2% Scotch-Irish 2%
- Foreign-born
- 5% · Canada
- Languages at home
- 94% English-only · Spanish 2% Other Indo-European 1% Arabic 1%
Political lean MEDSL · Broome
- 2024 margin
- Toss-up / Even · D 50.2% · R 49.8%
- 2008→2024 swing
- -7.6pp toward R · 2008: 8.0pp · 2024: 0.4pp
- All cycles
- 2024: D+0.4 2020: D+3.5 2016: R+3.7 2012: D+4.6 2008: D+8.0
Not yet ingested
- Civics
- —
Market trends
- HPI YoY
- ▲ 11.68%
- Current HPI
- 286.1001
- Rent YoY
- —
- Metro
- Binghamton, NY
- State GDP YoY
- ▲ 2.60%
- F500 in state
- 92
Industry mix (Fortune 500 HQ in NY)
| Industry | F500 HQs | Revenue |
|---|---|---|
| Financial Services | 10 | $950B |
|
||
| Consumer Goods | 9 | $162B |
|
||
| Insurance | 4 | $225B |
|
||
| Telecommunications | 2 | $144B |
|
||
| Pharmaceuticals | 2 | $112B |
|
||
| Media / Entertainment | 2 | $69B |
|
||
Price history
1 event — show timeline
- 2026-06-11 Listed $105,000 GBAOR
Property tax history
+16.1%/yrLatest (2025): $3,004 · +2.6% YoY. Source: county tax records.
Cash-flow waterfall
monthlySold comps — $/sqft
last 12 mo · ≤1 miLoading sold comps…