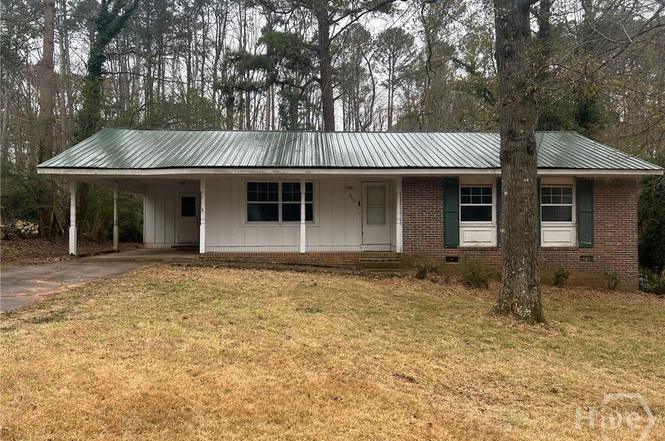
355 Camelot Dr · Athens-Clarke County unified government (balance), GA
Flood risk 1/10 · Minimal
- FEMA flood zone
- X (unshaded)
- Chance of flooding over 30 yrs
- 0.0%
- Est. flood insurance / yr
- $507 – $1,088
Fire risk 1/10 · Minimal
- Est. fire insurance / yr
- $963 – $1,789
Heat risk 6/10 · Moderate
- Hot days now (above 106°F)
- 7 days/yr
- Hot days in 30 yrs
- 17 days/yr
Wind risk 5/10 · Moderate
- Chance of severe wind over 30 yrs
- 25.0%
Air-quality risk 3/10 · Minor
- Unhealthy air days now
- 4 days/yr
- Unhealthy air days in 30 yrs
- 4 days/yr
Risk factors via First Street. Map © Google.
Why this score? — see what drove the C- grade
The composite is a weighted blend of 9 inputs, each scored 0–100. Each bar is that input's sub-score; the figure is the points it added to the 100-point composite (weight × sub-score).
- Cash flow +16.9/30.0
- ARV discount +15.0/15.0
- DSCR +5.2/10.0
- 1% rule +4.1/10.0
- Rent growth +2.5/5.0
- Livability +2.5/5.0
- Condition / age +2.5/5.0
- Schools +1.6/10.0
- Appreciation +0.0/10.0
$177,000
🖨 Deal sheet (PDF) 📄 Offer letter ✓ Due diligence
Key facts
- 0.76 acre lot
- Built 1965
- Listed 18 days
Neighborhood map
What this means for you Summary
Snapshot
- This is a 3-bed/1.5-bath single-family listed at $177k.
Deal economics
- At list price, monthly cash flow is $115 ($1k/yr) — positive.
- The deal already cash-flows at list — no discount required.
- To meet the 1% rule (rent ≥ 1% of price), the offer needs to be $161k (8.8% below list).
- Recommended offer: $161k (8.8% below list) — sets the bar for 1% rule.
- Cap rate 7.1% vs local median 3.4% in Athens-Clarke County unified government (balance) — top-decile yield for the area; either an underpriced asset or a hidden risk that comps aren't pricing in. Stress-test before assuming the spread holds.
Location & tenants
- Location reads: area grade C — affects rentability + tenant quality, not the cash-flow math above.
- Clarke County (urban): math 17% / reading 21% proficiency, ranked #146 of 174 in GA (top 84%) — low school quality limits family demand, transient renter base, plan for 1-2y turnover; 74% free/reduced lunch — lower-income household profile, screen leases tightly.
- Zoned schools: Whitehead Road Elementary School (math 20% / reading 21%, grade F, #860 of 1,228 statewide, top 70%, 691 students, 83% FRL); Burney-Harris-Lyons Middle School (math 19% / reading 23%, grade F, #342 of 470 statewide, top 73%, 728 students, 83% FRL); Clarke Central High School (math 15% / reading 24%, grade F, #238 of 424 statewide, top 57%, 1,836 students, 83% FRL).
- Market conditions: 91 active listings in the ZIP; 27 comparable units currently listed for rent nearby; rentals at typical pace (median 23d on market — plan ~3-4 weeks tenant-placement turnaround); 1,172 units permitted in Clarke County in 2024 (876 in 5+ unit buildings).
Forward outlook
- Local home prices are declining (-3.0%/yr); year-one equity from $1k of loan paydown is wiped out by about $5k of value loss. Plan a longer hold.
- Clarke County population projected at +31% by 2050 — long-run rental-demand tailwind backs the buy-and-hold thesis.
Negotiation context
- It's been on market 18 days — a 2% lower offer ($174k) is reasonable based on typical stale-listing flexibility.
- Current owner paid $58k; list at $177k implies a 208% gain — meaningful room to come down on a strong offer.
Risks & watch-outs
- Climate carrying-cost: moderate wind risk, 25% chance of damaging wind over 30y; extreme-heat days projected 7→17/yr by 2055 (HVAC capex compounding) — expect insurance premiums to compound above CPI over the hold.
Questions for the listing agent
- Built in 1965 — when were the roof, HVAC, electrical panel, plumbing, and water heater last replaced?
- Is there a deadline driving the sale (1031 exchange, divorce, estate, relocation)? That informs how much negotiation room exists.
- What's the average days-on-market for RENTAL listings here right now (not sales)? A rising rental-DOM trend means longer vacancies and softer asking-rent achievability than the comps imply.
- What's the recent tenant-quality profile in this submarket — average credit score on applications, eviction rate, late-payment / NSF rate, and stable-employment percentage? A property-management company in the area should have these aggregated.
- How much new for-sale + rental construction is in the pipeline within 1–3 miles? Heavy new supply typically softens prices + rents 12–24 months out; constrained supply supports both.
Investment metrics
- 1% rule
- 0.91% ✗
- Cap rate
- 7.07%
- Cash-on-cash
- 2.79%
- DSCR
- 1.12
- GRM
- 9.1
CMA / ARV
- ARV (on-the-fly)
- $245,387
- Comps found
- 12
Show comp detail 12 sales within ~0.75 mi
| Address | Dist | Beds/Ba | Sqft | Sold | Price | $/sf | Match |
|---|---|---|---|---|---|---|---|
| 210 Lavender Road Rd | 0.53mi | 3/2.0 | 1,050 (-3%) | 3mo | $249,900 | $238 | 66 |
| 325 Edgewood Dr Dr | 0.45mi | 2/1.0 (-1) | 1,110 (+3%) | 3mo | $250,000 | $225 | 65 |
| 120 Whitehead Ter E | 0.64mi | 3/1.5 | 1,116 (+3%) | 1mo | $265,000 | $237 | 64 |
| 154 Mcleroy Dr | 0.33mi | 3/2.0 | 1,189 (+10%) | 3mo | $279,000 | $235 | 63 |
| 574 Whitehead Rd | 0.42mi | 3/1.0 | 1,173 (+8%) | 2mo | $258,000 | $220 | 63 |
| 235 Round Table Rd | 0.22mi | 3/2.0 | 1,225 (+13%) | 5mo | $288,000 | $235 | 61 |
| 545 Roberts Rd | 0.29mi | 3/2.0 | 1,200 (+11%) | 6mo | $265,000 | $221 | 61 |
| 150 Whitehead Ter E | 0.70mi | 3/2.0 | 1,107 (+2%) | 2mo | $251,000 | $227 | 60 |
| 105 Round Table Ct | 0.23mi | 3/2.0 | 1,215 (+12%) | 9mo | $275,000 | $226 | 59 |
| 149 Caroline Ave | 0.41mi | 3/2.0 | 1,215 (+12%) | 1mo | $339,000 | $279 | 58 |
| 102 Whitehead Cir | 0.59mi | 2/1.0 (-1) | 1,130 (+4%) | 6mo | $224,500 | $199 | 53 |
| 100 Whitehead Ter E | 0.61mi | 2/1.5 (-1) | 1,162 (+8%) | 3mo | $227,500 | $196 | 51 |
Match score weights: distance 35% · size 25% · config 20% · recency 20%. Top-matched comps best support the ARV.
Projected returns pro-forma
-3.0% appreciation · 3.0% rent growth · sell at horizon
- IRR
- -11.9%
- Equity multiple
- 0.57×
- Total profit
- $-21,369
- Equity at exit
- $26,391
- IRR
- -2.8%
- Equity multiple
- 0.81×
- Total profit
- $-9,232
- Equity at exit
- $15,304
Cash invested: $49,560 (down + closing). Projections, not guarantees.
Landlord ↔ Tenant lean methodology
- Overall (STATE)
- 90 Strongly Landlord-Friendly
- State Georgia
- 90 Strongly Landlord-Friendly · R+3
- County
- — inherits STATE
- City
- — inherits STATE
ZIP-level market 30607
- Home prices YoY
- -22.9%
- Active inventory
- 91
- Price-to-rent
- 9.1×
Monthly cashflow live
- Estimated rent
- $1,614 high interval (Pro) →
- Mortgage (P&I)
- −$928
- Tax from tax record
- −$158 /mo · $1,892/yr
- Insurance
- −$74
- HOA
- −$0
- Vacancy / Maint / Mgmt
- −$339
- Net cashflow
- $115
Break-even live
Sensitivity live
| Price | -10% $215 | -5% $165 | +0% $115 | +5% $65 | +10% $15 |
|---|---|---|---|---|---|
| Rent | -10% $-12 | -5% $51 | +0% $115 | +5% $179 | +10% $243 |
| Rate | -1.0pp $204 | -0.5pp $160 | base $115 | +0.5pp $69 | +1.0pp $23 |
UW: 25.0% down · 7.5% · 30yr · 1.5% tax · 5.0% vac · 8.0% maint · 8.0% mgmt
Financing live
Cash to close
- Down payment
- $44,250
- Closing costs
- $5,310
- Reserves months
- —
- Total cash needed
- —
Loan-product check · same deal, 3 products live
Conventional
25% down · 7.5% · 30yr
- Down + closing
- —
- Monthly P&I
- —
- Monthly cashflow
- —
- DSCR
- —
- Eligible?
- —
Personal DTI + credit; lowest rate.
DSCR
20% down · 8.5% · 30yr
- Down + closing
- —
- Monthly P&I
- —
- Monthly cashflow
- —
- DSCR
- —
- Eligible?
- —
No personal income docs; deal must DSCR.
Hard money
10% down · 12.0% · 12mo
- Down + closing
- —
- Monthly P&I
- —
- Monthly cashflow
- —
- DSCR
- —
- Eligible?
- —
Short-term bridge; refi at stabilization.
Rent comps 27 comps
| Address | Beds | Baths | Sqft | Rent | $/sqft | DOM | Units | Dist |
|---|---|---|---|---|---|---|---|---|
| 135 Lillian Dr Athens, GA | 3.0 | 2.0 | 1430 | $1,500 | $1.05 | 45d | 1 | 0.42mi |
| 330 Edgewood Dr Athens, GA | 2.0 | 1.0 | 957 | $1,150 | $1.20 | 45d | 1 | 0.45mi |
| 150 Bel Air Dr Athens, GA | 3.0 | 2.0 | 1369 | $2,195 | $1.60 | 45d | 1 | 0.48mi |
| 102 Whitehead Ter E Athens, GA | 3.0 | 1.5 | 1416 | $1,900 | $1.34 | 23d | 1 | 0.62mi |
| 110 Addison Rd Athens, GA | 1.0–3.0 | 1.0–2.0 | 995 | $2,180 | $2.19 | 15d | 22 | 0.68mi |
| 105 Whitehead Rd Athens, GA | 2.0 | 2.5 | 1088 | $1,650 | $1.52 | 15d | 1 | 0.73mi |
| 183 Vaughn Rd Athens, GA | 2.0 | 1.0 | 700 | $1,200 | $1.71 | 15d | 1 | 1.06mi |
| 127 Lake Pl Athens, GA | 2.0 | 1.0 | 986 | $1,050 | $1.06 | 23d | 1 | 1.10mi |
| 195 Michele Dr Unit 197 Athens, GA | 2.0 | 1.0 | 986 | $1,050 | $1.06 | 23d | 1 | 1.14mi |
| 200 Michele Dr Athens, GA | 2.0 | 1.0 | 986 | $1,050 | $1.06 | 23d | 1 | 1.14mi |
| 112 Lake Ct Unit 114 Athens, GA | 2.0 | 1.0 | 986 | $1,050 | $1.06 | 23d | 1 | 1.18mi |
| 121 Lake Dr Athens, GA | 2.0 | 1.0 | 986 | $1,050 | $1.06 | 23d | 1 | 1.21mi |
| 888 Horizon Blvd Athens, GA | 1.0–2.0 | 1.0–2.0 | 1066 | $1,795 | $1.68 | 45d | 1 | 1.22mi |
| 115 Lake Dr Athens, GA | 2.0 | 1.0 | 986 | $1,050 | $1.06 | 23d | 1 | 1.22mi |
| 110 Michele Dr Athens, GA | 2.0 | 1.0 | 986 | $1,050 | $1.06 | 23d | 1 | 1.23mi |
| 113 Michele Dr Athens, GA | 2.0 | 1.0 | 986 | $1,050 | $1.06 | 23d | 1 | 1.25mi |
| 180 Chalfont Ln Unit 6 Athens, GA | 2.0 | 1.5 | 1000 | $1,250 | $1.25 | 45d | 1 | 1.25mi |
| 119 Michele Pl Athens, GA | 2.0 | 1.0 | 986 | $1,050 | $1.06 | 23d | 1 | 1.25mi |
| 305 Lorien Way Athens, GA | 3.0 | 2.5 | 1336 | $2,000 | $1.50 | 15d | 1 | 1.25mi |
| 345 Lorien Way Athens, GA | 3.0 | 2.5 | 1336 | $1,950 | $1.46 | 23d | 1 | 1.28mi |
| 130 Cole Manor Dr Athens, GA | 2.0 | 1.0–1.5 | 705 | $1,349 | $1.91 | 15d | 4 | 1.32mi |
| 205 Westchester Dr Athens, GA | 1.0–3.0 | 1.0–2.0 | 1100 | $1,505 | $1.37 | 45d | 1 | 1.44mi |
| 565 Rustwood Dr Athens, GA | 2.0 | 2.0 | 1271 | $1,500 | $1.18 | 45d | 1 | 1.44mi |
| 195 Lavender Lakes Dr Athens, GA | 3.0 | 2.0 | 1148 | $1,450 | $1.26 | 45d | 1 | 1.45mi |
| 105 Westchester Dr Athens, GA | 2.0 | 2.5 | 1206 | $1,825 | $1.51 | 45d | 2 | 1.47mi |
| 105 Westchester Dr Athens, GA | 2.0 | 2.5 | 1206 | $1,675 | $1.39 | 15d | 3 | 1.47mi |
| 197 Lavender Lakes Dr Athens, GA | 2.0 | 2.0 | 988 | $1,300 | $1.32 | 45d | 1 | 1.49mi |
Listing history 4 events
-
2026-01-06status Pending
-
2026-01-01price $177,000
-
2025-12-19$206,000 Active
-
1998-05-13soldstatus $57,500
ⓘ Source: listings_history table (triggers on properties + properties_extension) + one-shot
backfill from property_details.listing_events for pre-trigger history.
Tax reassessment forecast GA · Resets to sale price
- Current annual tax
- $1,892 · $158/mo
- Projected year-2 tax
- $1,892 · $158/mo
- Expected delta
- $0/yr ($0/mo · 0.0%)
ⓘ Screening estimate from a state-policy table — verify with the county assessor before closing.
Climate risk First Street
- Flood 1/10 Low FEMA zone X (unshaded) · 0% chance over 30 yrs
- Wildfire 1/10 Low
- Heat 6/10 Major 7 d/yr ≥106°F today · 17 d/yr by 30 yrs out
- Wind 5/10 Major 25% chance of damaging wind over 30 yrs
- Air quality 3/10 Moderate 4 unhealthy d/yr today · 4 by 30 yrs out
Nearby sold comps map
Loading sold comps map…
Walkable amenities ~0.75 mi
Loading nearby amenities…
Taxation est. · year 1
- Rental income
- $19,362
- − Mortgage interest
- −$9,915
- − Property taxes
- −$1,892
- − Insurance
- −$885
- − Repairs & maintenance
- −$1,549
- − Management
- −$1,549
- − Depreciation
- −$5,149
- Taxable loss
- −$1,577
- Est. tax savings @ 24.0%
- +$378
- After-tax cash flow
- $1,759/yr
For passive investors: Depreciation is non-cash, so a rental often shows a tax loss while cash-flowing — sheltering income. Rental losses are passive: they offset passive income freely, and up to $25,000/yr can offset ordinary (W-2) income if you actively participate and your MAGI is under $100k (phasing out to $0 by $150k); unused losses carry forward. On sale, claimed depreciation is recaptured at up to 25%, and gains may owe capital-gains tax (a 1031 exchange can defer both). Figures are a year-1 estimate at your 24.0% rate — not tax advice; consult a CPA.
Schools (NCES district)
- District
- Clarke County
- NCES district ID
- 1301170
- Math proficiency
- 17% ▼ -15.00%
- Reading proficiency
- 21% ▼ -12.00%
- Median HH income
- $33,649
- Composite
- 15.51/100
- National rank
- #9302
- State rank
- #146 of 174 in GA
Livability — Athens-Clarke County unified government (balance)
No livability data for this city. (Only ~50 U.S. cities are tracked.)
Census & demographics
- Census place
- Athens-Clarke County unified government (balance), GA
- County
- Clarke County · 126,008 people
- City population
- 119,110
- Metro
- Athens-Clarke County, GA
- Population (ZIP)
- 10,700
- Household income
- $65,361
- Rent vs Own
- Severe rent burden
- 175.0
Population outlook (Clarke County) Hauer SSP2
- Today (2025)
- 141,365 people
- By 2030
- 151,724 · +7.3%
- By 2040
- 168,541 · +19.2%
- By 2050
- 184,855 · +30.8%
- By 2075
- 221,736 · +56.9%
- By 2100
- 253,853 · +79.6%
Race, ethnicity, and origin ACS 2023
- Neighborhood character
- Diverse neighborhood (Simpson 0.69)
- Race & ethnicity
- White 43% Black 30% Hispanic / Latino 19% Two or more races 14%
- Hispanic origin (detail)
- Mexican 17%
- Common ancestry
- Lithuanian 2% Italian 2% Slovak 2%
- Foreign-born
- 9% · Canada, Jamaica
- Languages at home
- 81% English-only · Spanish 18% Other Indo-European 1%
Political lean MEDSL · Clarke
- 2024 margin
- Solid D (+38.3) · D 68.6% · R 30.4% · Other 1.0%
- 2008→2024 swing
- +7.0pp toward D · 2008: 31.3pp · 2024: 38.3pp
- All cycles
- 2024: D+38.3 2020: D+42.1 2016: D+38.0 2012: D+28.9 2008: D+31.3
Not yet ingested
- Civics
- —
Market trends
- HPI YoY
- ▼ -79.54%
- Current HPI
- 267.8527
- Rent YoY
- —
- Metro
- Athens-Clarke County, GA
- State GDP YoY
- ▲ 2.66%
- F500 in state
- 28
Industry mix (Fortune 500 HQ in GA)
| Industry | F500 HQs | Revenue |
|---|---|---|
| Paper / Packaging | 2 | $29B |
|
||
| Retail | 1 | $160B |
|
||
| Transportation / Logistics | 1 | $91B |
|
||
| Airlines | 1 | $62B |
|
||
| Consumer Goods | 1 | $47B |
|
||
| Utilities | 1 | $25B |
|
||
Price history
+207.8% since first listed4 events — show timeline
- 2026-01-06 Pending — Hive MLS
- 2026-01-01 Price Changed $177,000 Hive MLS
- 2025-12-19 Listed $206,000 Hive MLS
- 1998-05-13 Sold (Public Records) $57,500 Public Records
Property tax history
+9.1%/yrLatest (2025): $1,892 · +11.8% YoY. Source: county tax records.
Cash-flow waterfall
monthlySold comps — $/sqft
last 12 mo · ≤1 miLoading sold comps…