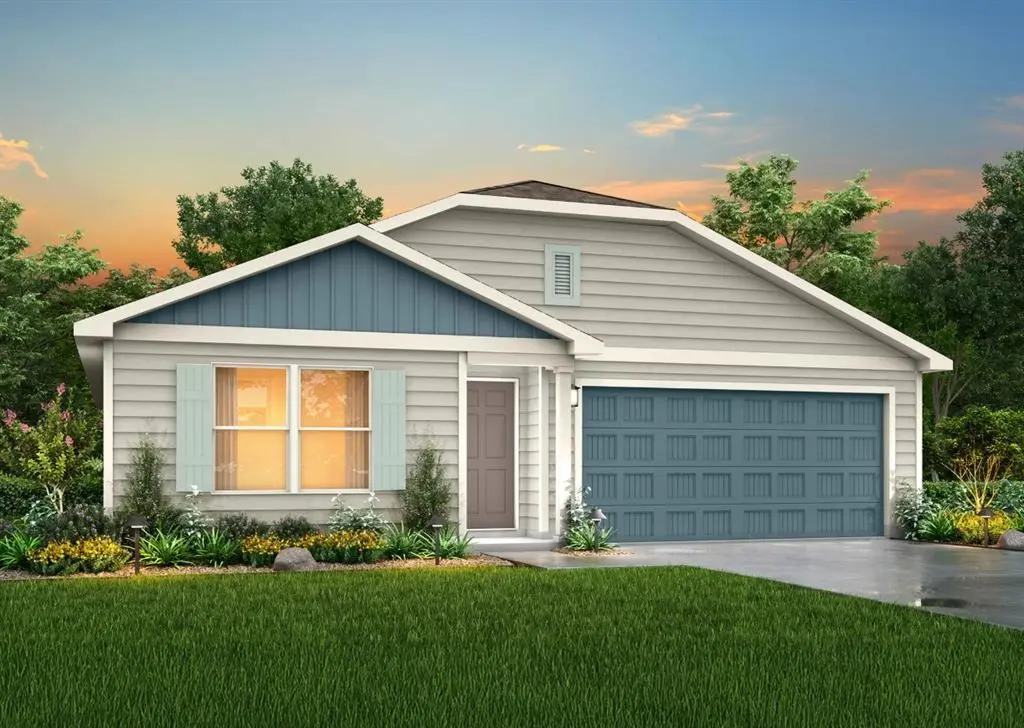
104 Peace Lily Way · Tolar, TX
Flood risk No data
- FEMA flood zone
- —
- Chance of flooding over 30 yrs
- —
- Est. flood insurance / yr
- —
Fire risk No data
- Est. fire insurance / yr
- —
Heat risk No data
- Hot days now (above threshold)
- —
- Hot days in 30 yrs
- —
Wind risk No data
- Chance of severe wind over 30 yrs
- —
Air-quality risk No data
- Unhealthy air days now
- —
- Unhealthy air days in 30 yrs
- —
Risk factors via First Street. Map © Google.
Why this score? — see what drove the D grade
The composite is a weighted blend of 9 inputs, each scored 0–100. Each bar is that input's sub-score; the figure is the points it added to the 100-point composite (weight × sub-score).
- ARV discount +14.2/15.0
- Cash flow +7.8/30.0
- Appreciation +5.0/10.0
- Schools +4.5/10.0
- Livability +3.8/5.0
- Rent growth +2.5/5.0
- Condition / age +2.5/5.0
- 1% rule +2.4/10.0
- DSCR +1.9/10.0
$266,990
🖨 Deal sheet (PDF) 📄 Offer letter ✓ Due diligence
Listing remarks MLS
No HOA. Beautiful Treed Lots with Concrete streets and curbs. Underground utilities. City water and sewer. Tolar ISD. Come see this great new community and choose your lot before they are all gone. If you do not have a builder we can provide one for you.
Key facts
- 0.25 acre lot
- Garage
- Built 2026
Property features AI
Finance
- Other: Special listing condition: Builder
- Financial info: Accepts Cash, Conventional, FHA, VA financing; No second mortgage reported
- HOA & community: No HOA
Exterior
- Parking: Attached garage facing front; 1-car garage (approx. 11' x 20'); 2-car carport; 1 covered parking space
- Utilities: City water; City sewer; Electricity available; Not in a municipal utility district
- Home design: Single family residence; One story; New construction — incomplete (year built 2026)
- Construction: Fiber cement siding; Composition roof; Slab foundation
- Exterior features: Lot under 0.5 acre (approx. 0.254 acres); Subdivision: Tolar Oaks
Interior
- Kitchen: Dishwasher; Electric range; Microwave
- Bedrooms: 4 bedrooms (all on main level); Primary bedroom on main level
- Flooring: Carpet; Laminate
- Bathrooms: 2 full bathrooms
- Heating & cooling: Central heating; Central air conditioning
- Interior features: Eat-in kitchen; Pantry; Walk-in closet(s); One living area; One dining area; Total rooms: 8
- Laundry & utility: Washer/dryer connections (utilities not specifically listed)
Neighborhood map
What this means for you Summary
Snapshot
- This is a 4-bed/2.0-bath land listed at $267k.
Deal economics
- At list price, monthly cash flow is $-293 ($-4k/yr) — negative.
- To cash-flow at today's rent, offer at most $225k (15.9% below list).
- To meet the 1% rule (rent ≥ 1% of price), the offer needs to be $197k (26.4% below list).
- Recommended offer: $197k (26.4% below list) — sets the bar for 1% rule.
- Cap rate 5.0% vs local median 3.1% in Tolar — top-decile yield for the area; either an underpriced asset or a hidden risk that comps aren't pricing in. Stress-test before assuming the spread holds.
Location & tenants
- Location reads 75/100 on livability (#146 in TX, #4,139 nationally) — a middle-class / working-renter tenant base. Strengths: crime A+, cost of living A+, housing A+; Watch: health & safety D+, amenities F, commute F.
- Tolar ISD (rural): math 55% / reading 50% proficiency, ranked #131 of 826 in TX (top 16%) — acceptable for families but not a draw, mixed tenant base, ~2y average lease.
- Zoned schools: Tolar El (math 42% / reading 42%, grade F, #1,335 of 4,322 statewide, top 33%, 393 students, 39% FRL); Tolar J H (math 62% / reading 57%, grade B, #166 of 1,662 statewide, top 11%, 201 students, 36% FRL); Tolar H S (math 67% / reading 52%, grade C+, #275 of 1,632 statewide, top 19%, 284 students, 30% FRL).
- Market conditions: 137 active listings in the ZIP; 3 comparable units currently listed for rent nearby; rentals at typical pace (median 26d on market — plan ~3-4 weeks tenant-placement turnaround); 125 units permitted in Hood County in 2024 (0 in 5+ unit buildings).
Forward outlook
- In year one you build about $2k of equity ($2k loan paydown + $177 appreciation (0.1% local appreciation)).
- Hood County population projected at +29% by 2050 — long-run rental-demand tailwind backs the buy-and-hold thesis.
Negotiation context
- It's been on market 48 days — a 3% lower offer ($259k) is reasonable based on typical stale-listing flexibility.
- 2 sale attempts since 3y ago with the ask held roughly flat each time — persistent listings suggest the price (not the market) is what's stuck; bring a comps-based counter.
Questions for the listing agent
- What do current leases actually rent for vs. the listed asking? Can we see a recent rent roll and the last 12 months of T-12 income?
- It's been on market 48 days. Have you received any prior offers? Is the seller open to a 26% concession, seller financing, or rate buy-down credit?
- Is there a deadline driving the sale (1031 exchange, divorce, estate, relocation)? That informs how much negotiation room exists.
- Schools are A-rated — typically a magnet for longer-tenancy family renters. What's the average tenant stay here, and is there a school-zone premium baked into asking?
- The area grade is low — what's the realistic commute time and amenity access for the typical tenant pool here? Any planned neighborhood developments (good or bad) we should know about?
- What's the average days-on-market for RENTAL listings here right now (not sales)? A rising rental-DOM trend means longer vacancies and softer asking-rent achievability than the comps imply.
- What's the recent tenant-quality profile in this submarket — average credit score on applications, eviction rate, late-payment / NSF rate, and stable-employment percentage? A property-management company in the area should have these aggregated.
- How much new for-sale + rental construction is in the pipeline within 1–3 miles? Heavy new supply typically softens prices + rents 12–24 months out; constrained supply supports both.
Investment metrics
- 1% rule
- 0.74% ✗
- Cap rate
- 4.98%
- Cash-on-cash
- -4.70%
- DSCR
- 0.79
- GRM
- 11.3
CMA / ARV
- ARV (median comp)
- $313,710
- List price
- $266,990
- Delta
- -14.89%
- Verdict
- UNDERPRICED
- Comps
- 20 within 1.0 mi
Projected returns pro-forma
0.07% appreciation · 3.0% rent growth · sell at horizon
- IRR
- -7.3%
- Equity multiple
- 0.66×
- Total profit
- $-25,590
- Equity at exit
- $78,411
- IRR
- -1.3%
- Equity multiple
- 0.86×
- Total profit
- $-10,197
- Equity at exit
- $94,962
Cash invested: $74,757 (down + closing). Projections, not guarantees.
Landlord ↔ Tenant lean methodology
- Overall (STATE)
- 87 Strongly Landlord-Friendly
- State Texas
- 87 Strongly Landlord-Friendly · R+5
- County
- — inherits STATE
- City
- — inherits STATE
ZIP-level market 76476
- Home prices YoY
- 0.0%
- Active inventory
- 137
- Price-to-rent
- 11.3×
Monthly cashflow live
- Estimated rent
- $1,965 medium interval (Pro) →
- Mortgage (P&I)
- −$1,400
- Tax est. 1.5%
- −$334 /mo · $4,005/yr
- Insurance
- −$111
- HOA
- −$0
- Vacancy / Maint / Mgmt
- −$413
- Net cashflow
- $-293
Break-even live
Sensitivity live
| Price | -10% $-108 | -5% $-200 | +0% $-293 | +5% $-385 | +10% $-477 |
|---|---|---|---|---|---|
| Rent | -10% $-448 | -5% $-370 | +0% $-293 | +5% $-215 | +10% $-137 |
| Rate | -1.0pp $-158 | -0.5pp $-225 | base $-293 | +0.5pp $-362 | +1.0pp $-432 |
UW: 25.0% down · 7.5% · 30yr · 1.5% tax · 5.0% vac · 8.0% maint · 8.0% mgmt
Financing live
Cash to close
- Down payment
- $66,748
- Closing costs
- $8,010
- Reserves months
- —
- Total cash needed
- —
Loan-product check · same deal, 3 products live
Conventional
25% down · 7.5% · 30yr
- Down + closing
- —
- Monthly P&I
- —
- Monthly cashflow
- —
- DSCR
- —
- Eligible?
- —
Personal DTI + credit; lowest rate.
DSCR
20% down · 8.5% · 30yr
- Down + closing
- —
- Monthly P&I
- —
- Monthly cashflow
- —
- DSCR
- —
- Eligible?
- —
No personal income docs; deal must DSCR.
Hard money
10% down · 12.0% · 12mo
- Down + closing
- —
- Monthly P&I
- —
- Monthly cashflow
- —
- DSCR
- —
- Eligible?
- —
Short-term bridge; refi at stabilization.
Rent comps 3 comps
| Address | Beds | Baths | Sqft | Rent | $/sqft | DOM | Units | Dist |
|---|---|---|---|---|---|---|---|---|
| 206 E 3rd St Tolar, TX | 3.0 | 1.0 | 1350 | $1,895 | $1.40 | 9d | 1 | 0.07mi |
| 200 Cedar Ln Tolar, TX | 3.0 | 2.0 | 1768 | $1,850 | $1.05 | 26d | 1 | 0.37mi |
| 535 Calla Lily Way Tolar, TX | 4.0 | 2.0 | 1935 | $2,550 | $1.32 | 45d | 1 | 0.66mi |
Listing history 21 events
-
2026-06-22days on market $266,990 Active 48 DOM
-
2026-06-19days on market $266,990 Active 45 DOM
-
2026-06-18days on market $266,990 Active 44 DOM
-
2026-06-17days on market $266,990 Active 43 DOM
-
2026-06-16days on market $266,990 Active 42 DOM
-
2026-06-15days on market $266,990 Active 41 DOM
-
2026-06-14days on market $266,990 Active 39 DOM
-
2026-06-13days on market $266,990 Active 38 DOM
-
2026-06-10days on market $266,990 Active 36 DOM
-
2026-06-09days on market $266,990 Active 35 DOM
-
2026-06-08days on market $266,990 Active 34 DOM
-
2026-06-07days on market $266,990 Active 33 DOM
-
2026-06-05days on market $266,990 Active 30 DOM
-
2026-06-02days on market $266,990 Active 28 DOM
-
2026-06-01days on market $266,990 Active 27 DOM
-
2026-05-31days on market $266,990 Active 26 DOM
-
2026-05-30days on market $266,990 Active 25 DOM
-
2026-05-05$266,990 Active 886-char remark
-
2026-05-01soldstatus Closed 255-char remark
Show marketing remark (255 chars)
No HOA. Beautiful Treed Lots with Concrete streets and curbs. Underground utilities. City water and sewer. Tolar ISD. Come see this great new community and choose your lot before they are all gone. If you do not have a builder we can provide one for you.
-
2026-04-28status Pending 255-char remark
Show marketing remark (255 chars)
No HOA. Beautiful Treed Lots with Concrete streets and curbs. Underground utilities. City water and sewer. Tolar ISD. Come see this great new community and choose your lot before they are all gone. If you do not have a builder we can provide one for you.
-
2023-05-18$74,900 Active 255-char remark
Show marketing remark (255 chars)
No HOA. Beautiful Treed Lots with Concrete streets and curbs. Underground utilities. City water and sewer. Tolar ISD. Come see this great new community and choose your lot before they are all gone. If you do not have a builder we can provide one for you.
ⓘ Source: listings_history table (triggers on properties + properties_extension) + one-shot
backfill from property_details.listing_events for pre-trigger history.
Nearby sold comps map
Loading sold comps map…
Walkable amenities ~0.75 mi
Loading nearby amenities…
Taxation est. · year 1
- Rental income
- $23,581
- − Mortgage interest
- −$14,956
- − Property taxes
- −$4,005
- − Insurance
- −$1,335
- − Repairs & maintenance
- −$1,886
- − Management
- −$1,886
- − Depreciation
- −$7,767
- Taxable loss
- −$8,254
- Est. tax savings @ 24.0%
- +$1,981
- After-tax cash flow
- $-1,531/yr
For passive investors: Depreciation is non-cash, so a rental often shows a tax loss while cash-flowing — sheltering income. Rental losses are passive: they offset passive income freely, and up to $25,000/yr can offset ordinary (W-2) income if you actively participate and your MAGI is under $100k (phasing out to $0 by $150k); unused losses carry forward. On sale, claimed depreciation is recaptured at up to 25%, and gains may owe capital-gains tax (a 1031 exchange can defer both). Figures are a year-1 estimate at your 24.0% rate — not tax advice; consult a CPA.
Schools (NCES district)
- District
- Tolar ISD
- NCES district ID
- 4842900
- Math proficiency
- 55% ▼ -8.00%
- Reading proficiency
- 50% ▼ -6.00%
- Median HH income
- $55,351
- Composite
- 45.4/100
- National rank
- #2629
- State rank
- #131 of 826 in TX
Livability — Tolar
- Score
- 75/100
- State rank
- #146
- US rank
- #4139
Category grades
Schools grade is shown separately in the Schools card above.
Census & demographics
- Census place
- Tolar, TX
- Population (ZIP)
- 3,638
Population outlook (Hood County) Hauer SSP2
- Today (2025)
- 63,502 people
- By 2030
- 67,459 · +6.2%
- By 2040
- 74,958 · +18.0%
- By 2050
- 81,922 · +29.0%
- By 2075
- 98,872 · +55.7%
- By 2100
- 107,796 · +69.8%
Race, ethnicity, and origin ACS 2023
- Neighborhood character
- Predominantly White (91%)
- Race & ethnicity
- White 91% Two or more races 5% Hispanic / Latino 5%
- Common ancestry
- Italian 2% Iranian 1% Slovak 1%
- Foreign-born
- 0%
- Languages at home
- 99% English-only · Spanish 1%
Political lean MEDSL · Hood
- 2024 margin
- Solid R (+66.0) · D 16.6% · R 82.6%
- 2008→2024 swing
- -11.9pp toward R · 2008: -54.0pp · 2024: -66.0pp
- All cycles
- 2024: R+66.0 2020: R+64.1 2016: R+66.5 2012: R+64.7 2008: R+54.0
Not yet ingested
- Civics
- —
Market trends
- HPI YoY
- ▲ 0.07%
- Current HPI
- 308.4789
- Rent YoY
- —
- Metro
- —
- State GDP YoY
- ▲ 3.95%
- F500 in state
- 110
Industry mix (Fortune 500 HQ in TX)
| Industry | F500 HQs | Revenue |
|---|---|---|
| Energy | 16 | $1,198B |
|
||
| Technology | 5 | $198B |
|
||
| Engineering / Construction | 4 | $72B |
|
||
| Energy Services | 3 | $60B |
|
||
| Utilities | 3 | $41B |
|
||
| Healthcare | 2 | $330B |
|
||
Price history
+256.5% since first listed4 events — show timeline
- 2026-05-05 Listed $266,990 NTREIS
- 2026-05-01 Sold (MLS) — NTREIS
- 2026-04-28 Pending — NTREIS
- 2023-05-18 Listed $74,900 NTREIS
Property tax history
-47.8%/yrLatest (2025): $416 · -47.8% YoY. Source: county tax records.
Cash-flow waterfall
monthlySold comps — $/sqft
last 12 mo · ≤1 miLoading sold comps…