2506 S Taylor St · Little Rock, AR
Flood risk 1/10 · Minimal
- FEMA flood zone
- X (unshaded)
- Chance of flooding over 30 yrs
- 0.0%
- Est. flood insurance / yr
- $507 – $1,088
Fire risk 3/10 · Minor
- Est. fire insurance / yr
- $1,499 – $2,785
Heat risk 7/10 · Major
- Hot days now (above 110°F)
- 7 days/yr
- Hot days in 30 yrs
- 19 days/yr
Wind risk 4/10 · Minor
- Chance of severe wind over 30 yrs
- 11.0%
Air-quality risk 2/10 · Minimal
- Unhealthy air days now
- 1 days/yr
- Unhealthy air days in 30 yrs
- 1 days/yr
Risk factors via First Street. Map © Google.
Why this score? — see what drove the B+ grade
The composite is a weighted blend of 9 inputs, each scored 0–100. Each bar is that input's sub-score; the figure is the points it added to the 100-point composite (weight × sub-score).
- Cash flow +30.0/30.0
- ARV discount +15.0/15.0
- 1% rule +10.0/10.0
- DSCR +10.0/10.0
- Rent growth +3.7/5.0
- Livability +3.7/5.0
- Condition / age +2.5/5.0
- Schools +2.1/10.0
- Appreciation +0.0/10.0
$64,900
🖨 Deal sheet (PDF) 📄 Offer letter ✓ Due diligence
Listing remarks MLS
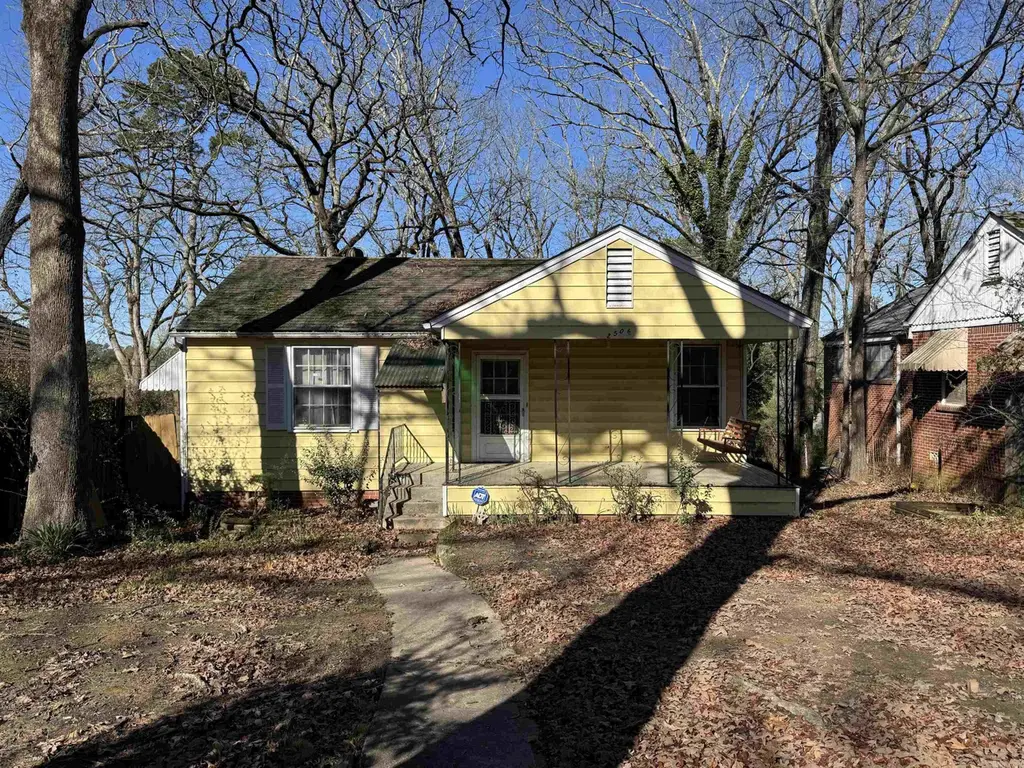
Cute yellow cottage almost in the UALR campus. Perfect for investors, students or starter home. Hardwood floors throughout. Covered front porch and back porch. Back alley parking. Large work space with concrete slab in crawl space. To be sold as-is. Agents see remarks. Recent pre-inspection available upon request.
Key facts
- Covered front porch
- Large work space
- Yellow cottage
Tags
Neighborhood map
What this means for you Summary
Snapshot
- This is a 2-bed/1.0-bath single-family listed at $65k.
Deal economics
- At list price, monthly cash flow is $374 ($4k/yr) — positive.
- The deal already cash-flows at list — no discount required.
- Meets the 1% rule at list price ($1k rent vs $65k).
- Recommended offer: $59k (9.0% below list) — sets the bar for market timing.
- Cap rate 13.2% vs local median 4.1% in Little Rock — top-decile yield for the area; either an underpriced asset or a hidden risk that comps aren't pricing in. Stress-test before assuming the spread holds.
Location & tenants
- Location reads 73/100 on livability (#22 in AR) — a middle-class / working-renter tenant base. Strengths: commute A+, cost of living A+, housing A+; Watch: crime F.
- Little Rock School District (urban): math 23% / reading 26% proficiency, ranked #183 of 238 in AR (top 77%) — low school quality limits family demand, transient renter base, plan for 1-2y turnover; 69% free/reduced lunch — lower-income household profile, screen leases tightly.
- Zoned schools: Bale Elementary School (math 17% / reading 8%, grade F, #417 of 454 statewide, top 92%, 403 students, 94% FRL) — zoned schools average 94% FRL vs 69% district-wide (24 pts higher); higher-poverty schools than district average — tighter screening recommended.
- Zoned-school proficiency averages 12% at this address vs 24% district-wide (-12 pts) — the specific schools serving this property underperform the Little Rock School District average; the district grade overstates school quality for this exact location.
- Market conditions: Rents rising fast (+4.9%/yr); 187 active listings in the ZIP; 22 comparable units currently listed for rent nearby; rentals at typical pace (median 25d on market — plan ~3-4 weeks tenant-placement turnaround); 45% of comp listings sitting > 30 days — soft ceiling on asking rent; lower-income renter base — watch delinquency; 1,006 units permitted in Pulaski County in 2024 (0 in 5+ unit buildings).
Forward outlook
- Local home prices are declining (-3.0%/yr); year-one equity from $449 of loan paydown is wiped out by about $2k of value loss. Plan a longer hold.
- Pulaski County population projected at +6% by 2050 — modest demand growth; plan on rents tracking national, not racing it.
- At projected returns (-3.0% appreciation + 4.9% rent growth), your $18k cash investment doubles in ~5 years — after that, you're playing with house money.
Negotiation context
- It's been on market 101 days — a 9% lower offer ($59k) is reasonable based on typical stale-listing flexibility.
- 2 sale attempts; this cycle's ask has dropped $20k (24%) from the opening price — seller is motivated, your offer sets the floor, not the list.
Risks & watch-outs
- Watch-outs: built in 1946 — expect roof / HVAC / electrical / plumbing capex.
- Climate carrying-cost: extreme-heat days projected 7→19/yr by 2055 (HVAC capex compounding) — expect insurance premiums to compound above CPI over the hold.
Questions for the listing agent
- It's been on market 101 days. Have you received any prior offers? Is the seller open to a 9% concession, seller financing, or rate buy-down credit?
- Built in 1946 — when were the roof, HVAC, electrical panel, plumbing, and water heater last replaced?
- Why hasn't it sold? Are there any deal-killer items the seller is aware of (foundation, flood, title, zoning, code violations)?
- Is there a deadline driving the sale (1031 exchange, divorce, estate, relocation)? That informs how much negotiation room exists.
- Crime grade is F in this area — have there been break-ins, vandalism, or insurance claims at this property in the last 3 years? What carrier currently insures it and at what premium?
- What's the average days-on-market for RENTAL listings here right now (not sales)? A rising rental-DOM trend means longer vacancies and softer asking-rent achievability than the comps imply.
- What's the recent tenant-quality profile in this submarket — average credit score on applications, eviction rate, late-payment / NSF rate, and stable-employment percentage? A property-management company in the area should have these aggregated.
- How much new for-sale + rental construction is in the pipeline within 1–3 miles? Heavy new supply typically softens prices + rents 12–24 months out; constrained supply supports both.
Investment metrics
- 1% rule
- 1.57% ✓
- Cap rate
- 13.20%
- Cash-on-cash
- 24.68%
- DSCR
- 2.10
- GRM
- 5.3
CMA / ARV
- ARV (median comp)
- $97,050
- List price
- $64,900
- Delta
- -33.13%
- Verdict
- UNDERPRICED
- Comps
- 20 within 1.0 mi
Show comp detail 12 sales within ~0.75 mi
| Address | Dist | Beds/Ba | Sqft | Sold | Price | $/sf | Match |
|---|---|---|---|---|---|---|---|
| 1908 S Buchanan St | 0.44mi | 2/1.0 | 822 (+1%) | 2mo | $100,000 | $122 | 76 |
| 2410 S Harrison St | 0.20mi | 2/1.5 | 856 (+5%) | 13mo | $135,000 | $158 | 70 |
| 4712 W 24th St | 0.56mi | 2/1.0 | 810 (-1%) | 8mo | $65,000 | $80 | 66 |
| 2324 Fair Park Blvd | 0.13mi | 2/1.0 | 936 (+15%) | 8mo | $95,000 | $101 | 63 |
| 1824 S Grant St | 0.51mi | 2/1.0 | 840 (+3%) | 15mo | $103,000 | $123 | 59 |
| 2605 S Van Buren | 0.29mi | 2/1.0 | 750 (-8%) | 17mo | $55,000 | $73 | 59 |
| 2712 Boulevard Ave | 0.39mi | 2/1.0 | 702 (-14%) | 3mo | $64,000 | $91 | 56 |
| 2119 S Harrison St | 0.34mi | 3/1.0 (+1) | 930 (+14%) | 1mo | $125,000 | $134 | 55 |
| 4716 W 31st St | 0.64mi | 1/1.0 (-1) | 825 (+1%) | 12mo | $14,500 | $18 | 53 |
| 4503 W 29th St | 0.72mi | 2/1.0 | 756 (-7%) | 2mo | $35,000 | $46 | 52 |
| 2601 Boulevard Ave | 0.41mi | 2/1.0 | 702 (-14%) | 8mo | $35,000 | $50 | 51 |
| 1704 S Fillmore St | 0.53mi | 2/1.0 | 909 (+11%) | 8mo | $93,000 | $102 | 49 |
Match score weights: distance 35% · size 25% · config 20% · recency 20%. Top-matched comps best support the ARV.
Projected returns pro-forma
-3.0% appreciation · 4.91% rent growth · sell at horizon
- IRR
- 20.2%
- Equity multiple
- 1.84×
- Total profit
- $15,282
- Equity at exit
- $9,677
- IRR
- 29.6%
- Equity multiple
- 3.89×
- Total profit
- $52,467
- Equity at exit
- $5,611
Cash invested: $18,172 (down + closing). Projections, not guarantees.
Landlord ↔ Tenant lean methodology
- Overall (STATE)
- 92 Strongly Landlord-Friendly
- State Arkansas
- 92 Strongly Landlord-Friendly · R+14
- County
- — inherits STATE
- City
- — inherits STATE
ZIP-level market 72204
- Home prices YoY
- -21.5%
- Rents YoY
- 4.9%
- Active inventory
- 187
- Price-to-rent
- 5.3×
Monthly cashflow live
- Estimated rent
- $1,017 high interval (Pro) →
- Mortgage (P&I)
- −$340
- Tax from tax record
- −$62 /mo · $743/yr
- Insurance
- −$27
- HOA
- −$0
- Vacancy / Maint / Mgmt
- −$213
- Net cashflow
- $374
Break-even live
Sensitivity live
| Price | -10% $410 | -5% $392 | +0% $374 | +5% $355 | +10% $337 |
|---|---|---|---|---|---|
| Rent | -10% $293 | -5% $334 | +0% $374 | +5% $414 | +10% $454 |
| Rate | -1.0pp $406 | -0.5pp $390 | base $374 | +0.5pp $357 | +1.0pp $340 |
UW: 25.0% down · 7.5% · 30yr · 1.5% tax · 5.0% vac · 8.0% maint · 8.0% mgmt
Financing live
Cash to close
- Down payment
- $16,225
- Closing costs
- $1,947
- Reserves months
- —
- Total cash needed
- —
Loan-product check · same deal, 3 products live
Conventional
25% down · 7.5% · 30yr
- Down + closing
- —
- Monthly P&I
- —
- Monthly cashflow
- —
- DSCR
- —
- Eligible?
- —
Personal DTI + credit; lowest rate.
DSCR
20% down · 8.5% · 30yr
- Down + closing
- —
- Monthly P&I
- —
- Monthly cashflow
- —
- DSCR
- —
- Eligible?
- —
No personal income docs; deal must DSCR.
Hard money
10% down · 12.0% · 12mo
- Down + closing
- —
- Monthly P&I
- —
- Monthly cashflow
- —
- DSCR
- —
- Eligible?
- —
Short-term bridge; refi at stabilization.
Rent comps 22 comps
| Address | Beds | Baths | Sqft | Rent | $/sqft | DOM | Units | Dist |
|---|---|---|---|---|---|---|---|---|
| 1809 S Buchanan St Little Rock, AR | 2.0 | 1.0 | 974 | $850 | $0.87 | 22d | 1 | 0.48mi |
| 4613 W 23rd St Unit B Little Rock, AR | 2.0 | 1.0 | 650 | $1,200 | $1.85 | 25d | 1 | 0.60mi |
| 9 Barbara Dr Little Rock, AR | 3.0 | 1.0 | 1035 | $1,295 | $1.25 | 22d | 1 | 0.66mi |
| 3415 Town & Country Ave Little Rock, AR | 2.0 | 1.0 | 645 | $675 | $1.05 | 45d | 1 | 0.68mi |
| 46 Glenmere Dr Little Rock, AR | 3.0 | 1.0 | 1080 | $1,150 | $1.06 | 45d | 1 | 0.73mi |
| 3107 Alameda Dr Little Rock, AR | 3.0 | 1.0 | 1042 | $1,250 | $1.20 | 45d | 1 | 0.78mi |
| 4304 W 22nd St Little Rock, AR | 2.0 | 1.0 | 896 | $895 | $1.00 | 45d | 1 | 0.82mi |
| 2701 Abigail St Little Rock, AR | 3.0 | 1.0 | 1098 | $1,195 | $1.09 | 25d | 1 | 0.83mi |
| 1100 Fair Park Blvd Apt 7 Little Rock, AR | 1.0 | 1.0 | 636 | $550 | $0.86 | 22d | 1 | 0.89mi |
| 1100 Fair Park Blvd Little Rock, AR | 1.0 | 1.0 | 636 | $550 | $0.86 | 25d | 2 | 0.89mi |
| 4319 W 17th St Little Rock, AR | 2.0 | 1.0 | 957 | $950 | $0.99 | 45d | 1 | 0.91mi |
| 1320 Adams St Little Rock, AR | 3.0 | 1.0 | 1026 | $1,025 | $1.00 | 45d | 1 | 0.93mi |
| 901 S Harrison St Little Rock, AR | 2.0 | 1.0 | 1000 | $980 | $0.98 | 20d | 1 | 1.04mi |
| 3510 S Bryant St Unit 50 Little Rock, AR | 2.0 | 1.0 | 807 | $995 | $1.23 | 45d | 1 | 1.06mi |
| 2421 S Oak St Little Rock, AR | 3.0 | 1.0 | 1092 | $950 | $0.87 | 22d | 1 | 1.13mi |
| 6408 Blue Bird Dr Unit A Little Rock, AR | 2.0 | 1.0 | 1025 | $1,000 | $0.98 | 45d | 1 | 1.32mi |
| 607 Chickadee Dr Unit 2 Little Rock, AR | 2.0 | 1.5 | 1000 | $995 | $0.99 | 25d | 1 | 1.37mi |
| 2300 S Martin St Little Rock, AR | 2.0 | 1.0 | 840 | $795 | $0.95 | 25d | 1 | 1.37mi |
| 517 Chickadee Dr Unit A Little Rock, AR | 2.0 | 1.5 | 1100 | $1,400 | $1.27 | 45d | 1 | 1.40mi |
| 517 Chickadee Dr Unit F Little Rock, AR | 2.0 | 1.5 | 1100 | $1,100 | $1.00 | 20d | 1 | 1.40mi |
| 3705 W 12th St Unit B Little Rock, AR | 1.0 | 1.0 | 598 | $650 | $1.09 | 45d | 1 | 1.42mi |
| 1500 Parham Pointe Dr Little Rock, AR | 1.0–2.0 | 1.0–2.0 | 941 | $1,300 | $1.38 | 20d | 5 | 1.49mi |
Listing history 22 events
-
2026-06-21days on market $64,900 Active 101 DOM
-
2026-06-18days on market $64,900 Active 98 DOM
-
2026-06-17days on market $64,900 Active 97 DOM
-
2026-06-16days on market $64,900 Active 96 DOM
-
2026-06-15days on market $64,900 Active 95 DOM
-
2026-06-14days on market $64,900 Active 93 DOM
-
2026-06-13days on market $64,900 Active 92 DOM
-
2026-06-10days on market $64,900 Active 90 DOM
-
2026-06-09days on market $64,900 Active 89 DOM
-
2026-06-08days on market $64,900 Active 88 DOM
-
2026-06-05days on market $64,900 Active 84 DOM
-
2026-06-03days on market $64,900 Active 83 DOM
-
2026-06-02days on market $64,900 Active 82 DOM
-
2026-06-01days on market $64,900 Active 81 DOM
-
2026-05-31days on market $64,900 Active 80 DOM
-
2026-05-31days on market $64,900 Active 79 DOM
-
2026-05-18status Back on Market 315-char remark
Show marketing remark (315 chars)
Cute yellow cottage almost in the UALR campus. Perfect for investors, students or starter home. Hardwood floors throughout. Covered front porch and back porch. Back alley parking. Large work space with concrete slab in crawl space. To be sold as-is. Agents see remarks. Recent pre-inspection available upon request.
-
2026-05-07historical Take Backups 315-char remark
Show marketing remark (315 chars)
Cute yellow cottage almost in the UALR campus. Perfect for investors, students or starter home. Hardwood floors throughout. Covered front porch and back porch. Back alley parking. Large work space with concrete slab in crawl space. To be sold as-is. Agents see remarks. Recent pre-inspection available upon request.
-
2026-05-06price $64,900 315-char remark
Show marketing remark (315 chars)
Cute yellow cottage almost in the UALR campus. Perfect for investors, students or starter home. Hardwood floors throughout. Covered front porch and back porch. Back alley parking. Large work space with concrete slab in crawl space. To be sold as-is. Agents see remarks. Recent pre-inspection available upon request.
-
2026-04-24price $74,900 315-char remark
Show marketing remark (315 chars)
Cute yellow cottage almost in the UALR campus. Perfect for investors, students or starter home. Hardwood floors throughout. Covered front porch and back porch. Back alley parking. Large work space with concrete slab in crawl space. To be sold as-is. Agents see remarks. Recent pre-inspection available upon request.
-
2026-04-08price $79,900 315-char remark
Show marketing remark (315 chars)
Cute yellow cottage almost in the UALR campus. Perfect for investors, students or starter home. Hardwood floors throughout. Covered front porch and back porch. Back alley parking. Large work space with concrete slab in crawl space. To be sold as-is. Agents see remarks. Recent pre-inspection available upon request.
-
2026-03-12$85,000 New Listing 315-char remark
Show marketing remark (315 chars)
Cute yellow cottage almost in the UALR campus. Perfect for investors, students or starter home. Hardwood floors throughout. Covered front porch and back porch. Back alley parking. Large work space with concrete slab in crawl space. To be sold as-is. Agents see remarks. Recent pre-inspection available upon request.
ⓘ Source: listings_history table (triggers on properties + properties_extension) + one-shot
backfill from property_details.listing_events for pre-trigger history.
Tax reassessment forecast AR · Resets to sale price
- Current annual tax
- $743 · $62/mo
- Projected year-2 tax
- $743 · $62/mo
- Expected delta
- $0/yr ($0/mo · 0.0%)
ⓘ Screening estimate from a state-policy table — verify with the county assessor before closing.
Climate risk First Street
- Flood 1/10 Low FEMA zone X (unshaded) · 0% chance over 30 yrs
- Wildfire 3/10 Moderate
- Heat 7/10 Severe 7 d/yr ≥110°F today · 19 d/yr by 30 yrs out
- Wind 4/10 Moderate 11% chance of damaging wind over 30 yrs
- Air quality 2/10 Low 1 unhealthy d/yr today · 1 by 30 yrs out
Nearby sold comps map
Loading sold comps map…
Walkable amenities ~0.75 mi
Loading nearby amenities…
Taxation est. · year 1
- Rental income
- $12,199
- − Mortgage interest
- −$3,635
- − Property taxes
- −$743
- − Insurance
- −$324
- − Repairs & maintenance
- −$976
- − Management
- −$976
- − Depreciation
- −$1,888
- Taxable income
- $3,656
- Est. tax owed @ 24.0%
- −$877
- After-tax cash flow
- $3,608/yr
For passive investors: Depreciation is non-cash, so a rental often shows a tax loss while cash-flowing — sheltering income. Rental losses are passive: they offset passive income freely, and up to $25,000/yr can offset ordinary (W-2) income if you actively participate and your MAGI is under $100k (phasing out to $0 by $150k); unused losses carry forward. On sale, claimed depreciation is recaptured at up to 25%, and gains may owe capital-gains tax (a 1031 exchange can defer both). Figures are a year-1 estimate at your 24.0% rate — not tax advice; consult a CPA.
Schools (NCES district)
- District
- Little Rock School District
- NCES district ID
- 0509000
- Math proficiency
- 23% ▼ -12.00%
- Reading proficiency
- 26% ▼ -8.00%
- Median HH income
- $43,346
- Composite
- 21.0/100
- National rank
- #8457
- State rank
- #183 of 238 in AR
Livability — Little Rock
- Score
- 73/100
- State rank
- #22
- US rank
- #5295
Category grades
Schools grade is shown separately in the Schools card above.
Census & demographics
- Census place
- Little Rock, AR
- County
- Pulaski County · 372,764 people
- City population
- 218,896
- Metro
- Little Rock-North Little Rock-Conway, AR
- Population (ZIP)
- 30,525
- Household income
- $40,882
- Rent vs Own
- Severe rent burden
- 1553.0
Population outlook (Pulaski County) Hauer SSP2
- Today (2025)
- 415,378 people
- By 2030
- 423,720 · +2.0%
- By 2040
- 435,182 · +4.8%
- By 2050
- 440,904 · +6.1%
- By 2075
- 445,521 · +7.3%
- By 2100
- 419,173 · +0.9%
Race, ethnicity, and origin ACS 2023
- Neighborhood character
- Predominantly Black (66%)
- Race & ethnicity
- Black 66% White 18% Hispanic / Latino 12% Two or more races 6%
- Hispanic origin (detail)
- Mexican 9%
- Common ancestry
- Slovak 1%
- Foreign-born
- 7% · Canada, Vietnam
- Languages at home
- 89% English-only · Spanish 9% Vietnamese 1%
Political lean MEDSL · Pulaski
- 2024 margin
- Strong D (+22.1) · D 59.8% · R 37.7% · Other 2.5%
- 2008→2024 swing
- +10.6pp toward D · 2008: 11.6pp · 2024: 22.1pp
- All cycles
- 2024: D+22.1 2020: D+22.5 2016: D+17.9 2012: D+11.4 2008: D+11.6
Not yet ingested
- Civics
- —
Market trends
- HPI YoY
- ▼ -47.17%
- Current HPI
- 172.3977
- Rent YoY
- ▲ 4.91%
- Metro
- Little Rock-North Little Rock-Conway, AR
- State GDP YoY
- ▲ 3.80%
- F500 in state
- 10
Industry mix (Fortune 500 HQ in AR)
| Industry | F500 HQs | Revenue |
|---|---|---|
| Retail | 1 | $681B |
|
||
| Food / Agriculture | 1 | $53B |
|
||
| Retail / Energy | 1 | $22B |
|
||
| Transportation / Logistics | 1 | $12B |
|
||
| Energy | 1 | $4B |
|
||
Price history
-23.6% since first listed6 events — show timeline
- 2026-05-18 Relisted — CARMLS
- 2026-05-07 Contingent — CARMLS
- 2026-05-06 Price Changed $64,900 CARMLS
- 2026-04-24 Price Changed $74,900 CARMLS
- 2026-04-08 Price Changed $79,900 CARMLS
- 2026-03-12 Listed $85,000 CARMLS
Property tax history
+3.3%/yrLatest (2025): $743 · +0.0% YoY. Source: county tax records.
Cash-flow waterfall
monthlySold comps — $/sqft
last 12 mo · ≤1 miLoading sold comps…