10050 W Fm 744 · Barry, TX
Flood risk 1/10 · Minimal
- FEMA flood zone
- X (unshaded)
- Chance of flooding over 30 yrs
- 0.0%
- Est. flood insurance / yr
- $507 – $1,088
Fire risk 5/10 · Moderate
- Est. fire insurance / yr
- $1,222 – $2,270
Heat risk 7/10 · Major
- Hot days now (above 109°F)
- 6 days/yr
- Hot days in 30 yrs
- 22 days/yr
Wind risk 6/10 · Moderate
- Chance of severe wind over 30 yrs
- 56.0%
Air-quality risk 2/10 · Minimal
- Unhealthy air days now
- 0 days/yr
- Unhealthy air days in 30 yrs
- 1 days/yr
Risk factors via First Street. Map © Google.
Why this score? — see what drove the B- grade
The composite is a weighted blend of 9 inputs, each scored 0–100. Each bar is that input's sub-score; the figure is the points it added to the 100-point composite (weight × sub-score).
- Cash flow +28.1/30.0
- DSCR +10.0/10.0
- ARV discount +7.5/15.0
- 1% rule +6.8/10.0
- Appreciation +6.2/10.0
- Schools +3.2/10.0
- Livability +3.0/5.0
- Rent growth +2.5/5.0
- Condition / age +2.5/5.0
$99,999
🖨 Deal sheet (PDF) 📄 Offer letter ✓ Due diligence
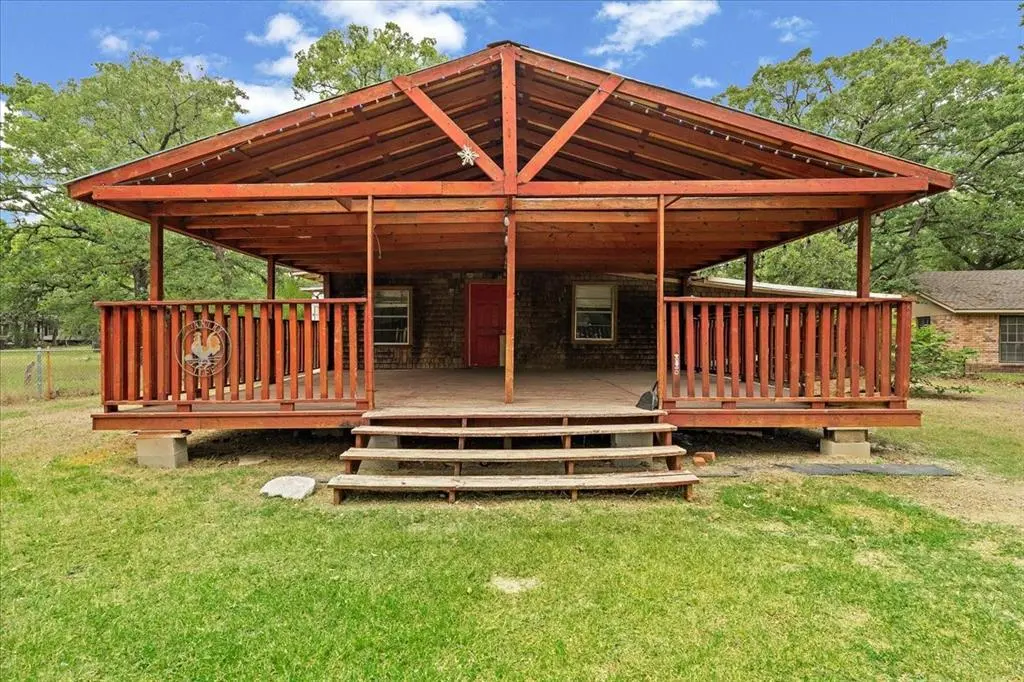
Listing remarks
Opportunity awaits on this 1-acre property with an existing home ready for a complete remodel or fresh vision. The property features a gated entrance and plenty of space to create something special. Home is being sold as-is and will require extensive renovations, making it ideal for investors, flippers, or buyers looking for a project with potential. Convenient country setting with room to transform this property into whatever you envision. Priced to sell quick!
Key facts
- Complete remodel
- Country setting
- Gated entrance
Tags
Property features AI
Finance
- Other: Property listed as Active and for sale; Directions: From Corsicana High School, travel west on FM 744 toward Barry; continue on FM 744 and the property will be on your right at 10050 FM 744 W, Barry, TX.
- Financial info: Listing terms: Cash or Conventional; No second mortgage indicated
- HOA & community: No association
Exterior
- Parking: Carport with 2 spaces; 2 covered parking spaces; Driveway
- Utilities: All-weather road (utility note); Not located in a municipal utility district
- Home design: Single-family residence; Residential property; Not attached to another property
- Construction: Built in 1999
- Exterior features: Approximately 1.048-acre lot; Will not subdivide; All-weather road access
Interior
- Kitchen: No appliances included
- Bedrooms: 3 bedrooms (primary bedroom on main level)
- Bathrooms: 1 full bathroom
- Interior features: One and one-half levels; One living area; One dining area; Other interior features; Freestanding fireplace (1)
- Laundry & utility: No washer/dryer or utility appliances listed
Neighborhood map
What this means for you Summary
Snapshot
- This is a 3-bed/1.0-bath single-family listed at $100k.
Deal economics
- At list price, monthly cash flow is $314 ($4k/yr) — positive.
- The deal already cash-flows at list — no discount required.
- Meets the 1% rule at list price ($1k rent vs $100k).
- Recommended offer: $98k (1.5% below list) — sets the bar for market timing.
Location & tenants
- Location reads 59/100 on livability (#1,129 in TX) — a working-class tenant base; expect higher turnover. Strengths: cost of living A+, housing A+, employment B+; Watch: crime F, amenities F, commute F.
- Corsicana ISD (town): math 39% / reading 37% proficiency, ranked #471 of 826 in TX (top 57%) — families likely to look elsewhere, expect single-tenant / working-renter base with shorter leases; 65% free/reduced lunch — lower-income household profile, screen leases tightly.
- Zoned schools: Jose Antonio Navarro El (math 24% / reading 24%, grade F, #3,221 of 4,322 statewide, top 75%, 621 students, 90% FRL) — zoned schools average 90% FRL vs 65% district-wide (25 pts higher); higher-poverty schools than district average — tighter screening recommended.
- Zoned-school proficiency averages 24% at this address vs 38% district-wide (-14 pts) — the specific schools serving this property underperform the Corsicana ISD average; the district grade overstates school quality for this exact location.
- Market conditions: 14 active listings in the ZIP; 522 units permitted in Navarro County in 2024 (0 in 5+ unit buildings).
Forward outlook
- In year one you build about $3k of equity ($691 loan paydown + $2k appreciation (2.3% local appreciation)).
- Navarro County population projected to shrink 4% by 2050 — rents likely to lag national; underwrite the cash flow, not the appreciation.
- At projected returns (2.3% appreciation + 3.0% rent growth), your $28k cash investment doubles in ~4 years — after that, you're playing with house money.
Negotiation context
- It's been on market 28 days — a 2% lower offer ($98k) is reasonable based on typical stale-listing flexibility.
Risks & watch-outs
- Climate carrying-cost: major wind risk, 56% chance of damaging wind over 30y; moderate wildfire risk; extreme-heat days projected 6→22/yr by 2055 (HVAC capex compounding) — expect insurance premiums to compound above CPI over the hold.
Questions for the listing agent
- Is there a deadline driving the sale (1031 exchange, divorce, estate, relocation)? That informs how much negotiation room exists.
- Schools are F-rated, which usually means shorter tenancies and higher turnover. Who's the typical renter profile here, and what's been the actual vacancy rate?
- Crime grade is F in this area — have there been break-ins, vandalism, or insurance claims at this property in the last 3 years? What carrier currently insures it and at what premium?
- What's the average days-on-market for RENTAL listings here right now (not sales)? A rising rental-DOM trend means longer vacancies and softer asking-rent achievability than the comps imply.
- What's the recent tenant-quality profile in this submarket — average credit score on applications, eviction rate, late-payment / NSF rate, and stable-employment percentage? A property-management company in the area should have these aggregated.
- How much new for-sale + rental construction is in the pipeline within 1–3 miles? Heavy new supply typically softens prices + rents 12–24 months out; constrained supply supports both.
Investment metrics
- 1% rule
- 1.18% ✓
- Cap rate
- 10.06%
- Cash-on-cash
- 13.46%
- DSCR
- 1.60
- GRM
- 7.0
CMA / ARV
No comps found within radius.
Projected returns pro-forma
2.33% appreciation · 3.0% rent growth · sell at horizon
- IRR
- 18.6%
- Equity multiple
- 2.02×
- Total profit
- $28,525
- Equity at exit
- $41,236
- IRR
- 20.4%
- Equity multiple
- 3.78×
- Total profit
- $77,966
- Equity at exit
- $60,790
Cash invested: $28,000 (down + closing). Projections, not guarantees.
Landlord ↔ Tenant lean methodology
- Overall (STATE)
- 87 Strongly Landlord-Friendly
- State Texas
- 87 Strongly Landlord-Friendly · R+5
- County
- — inherits STATE
- City
- — inherits STATE
ZIP-level market 75102
- Home prices YoY
- 2.2%
- Active inventory
- 14
- Price-to-rent
- 7.0×
Monthly cashflow live
- Estimated rent
- $1,182 medium interval (Pro) →
- Mortgage (P&I)
- −$524
- Tax from tax record
- −$54 /mo · $646/yr
- Insurance
- −$42
- HOA
- −$0
- Vacancy / Maint / Mgmt
- −$248
- Net cashflow
- $314
Break-even live
Sensitivity live
| Price | -10% $371 | -5% $342 | +0% $314 | +5% $286 | +10% $258 |
|---|---|---|---|---|---|
| Rent | -10% $221 | -5% $267 | +0% $314 | +5% $361 | +10% $408 |
| Rate | -1.0pp $365 | -0.5pp $340 | base $314 | +0.5pp $288 | +1.0pp $262 |
UW: 25.0% down · 7.5% · 30yr · 1.5% tax · 5.0% vac · 8.0% maint · 8.0% mgmt
Financing live
Cash to close
- Down payment
- $25,000
- Closing costs
- $3,000
- Reserves months
- —
- Total cash needed
- —
Loan-product check · same deal, 3 products live
Conventional
25% down · 7.5% · 30yr
- Down + closing
- —
- Monthly P&I
- —
- Monthly cashflow
- —
- DSCR
- —
- Eligible?
- —
Personal DTI + credit; lowest rate.
DSCR
20% down · 8.5% · 30yr
- Down + closing
- —
- Monthly P&I
- —
- Monthly cashflow
- —
- DSCR
- —
- Eligible?
- —
No personal income docs; deal must DSCR.
Hard money
10% down · 12.0% · 12mo
- Down + closing
- —
- Monthly P&I
- —
- Monthly cashflow
- —
- DSCR
- —
- Eligible?
- —
Short-term bridge; refi at stabilization.
Listing history 19 events
-
2026-06-19days on market $99,999 Active 28 DOM
-
2026-06-18days on market $99,999 Active 27 DOM
-
2026-06-17days on market $99,999 Active 26 DOM
-
2026-06-16days on market $99,999 Active 25 DOM
-
2026-06-15days on market $99,999 Active 24 DOM
-
2026-06-14days on market $99,999 Active 22 DOM
-
2026-06-12days on market $99,999 Active 21 DOM
-
2026-06-09days on market $99,999 Active 18 DOM
-
2026-06-08days on market $99,999 Active 17 DOM
-
2026-06-07days on market $99,999 Active 16 DOM
-
2026-06-02days on market $99,999 Active 11 DOM
-
2026-06-01days on market $99,999 Active 10 DOM
-
2026-05-31days on market $99,999 Active 9 DOM
-
2026-05-30days on market $99,999 Active 8 DOM
-
2026-05-22$109,900 Active
-
2016-06-17soldstatus
-
2010-03-26soldstatus
-
1997-04-17soldstatus
-
1976-09-13soldstatus
ⓘ Source: listings_history table (triggers on properties + properties_extension) + one-shot
backfill from property_details.listing_events for pre-trigger history.
Tax reassessment forecast TX · Resets to sale price
- Current annual tax
- $646 · $54/mo
- Projected year-2 tax
- $1,830 · $152/mo
- Expected delta
- +$1,184/yr (+$99/mo · 183.2%)
ⓘ Screening estimate from a state-policy table — verify with the county assessor before closing.
Climate risk First Street
- Flood 1/10 Low FEMA zone X (unshaded) · 0% chance over 30 yrs
- Wildfire 5/10 Major
- Heat 7/10 Severe 6 d/yr ≥109°F today · 22 d/yr by 30 yrs out
- Wind 6/10 Major 56% chance of damaging wind over 30 yrs
- Air quality 2/10 Low 0 unhealthy d/yr today · 1 by 30 yrs out
Nearby sold comps map
Loading sold comps map…
Walkable amenities ~0.75 mi
Loading nearby amenities…
Taxation est. · year 1
- Rental income
- $14,189
- − Mortgage interest
- −$5,601
- − Property taxes
- −$646
- − Insurance
- −$500
- − Repairs & maintenance
- −$1,135
- − Management
- −$1,135
- − Depreciation
- −$2,909
- Taxable income
- $2,262
- Est. tax owed @ 24.0%
- −$543
- After-tax cash flow
- $3,227/yr
For passive investors: Depreciation is non-cash, so a rental often shows a tax loss while cash-flowing — sheltering income. Rental losses are passive: they offset passive income freely, and up to $25,000/yr can offset ordinary (W-2) income if you actively participate and your MAGI is under $100k (phasing out to $0 by $150k); unused losses carry forward. On sale, claimed depreciation is recaptured at up to 25%, and gains may owe capital-gains tax (a 1031 exchange can defer both). Figures are a year-1 estimate at your 24.0% rate — not tax advice; consult a CPA.
Schools (NCES district)
- District
- Corsicana ISD
- NCES district ID
- 4815330
- Math proficiency
- 39% ▼ -9.00%
- Reading proficiency
- 37% ▬ 0.00%
- Median HH income
- $39,948
- Composite
- 31.89/100
- National rank
- #5862
- State rank
- #471 of 826 in TX
Livability — Barry
- Score
- 59/100
- State rank
- #1129
- US rank
- #19949
Category grades
Schools grade is shown separately in the Schools card above.
Census & demographics
- Population (ZIP)
- 1,722
Population outlook (Navarro County) Hauer SSP2
- Today (2025)
- 48,397 people
- By 2030
- 48,096 · -0.6%
- By 2040
- 47,394 · -2.1%
- By 2050
- 46,541 · -3.8%
- By 2075
- 44,940 · -7.1%
- By 2100
- 42,288 · -12.6%
Race, ethnicity, and origin ACS 2023
- Neighborhood character
- Predominantly White (80%)
- Race & ethnicity
- White 80% Hispanic / Latino 16% Two or more races 9%
- Hispanic origin (detail)
- Mexican 15%
- Common ancestry
- Italian 2% Romanian 1%
- Foreign-born
- 5% · Canada
- Languages at home
- 88% English-only · Spanish 12% Arabic 1%
Political lean MEDSL · Navarro
- 2024 margin
- Solid R (+51.8) · D 23.7% · R 75.6%
- 2008→2024 swing
- -18.7pp toward R · 2008: -33.1pp · 2024: -51.8pp
- All cycles
- 2024: R+51.8 2020: R+45.5 2016: R+48.8 2012: R+42.4 2008: R+33.1
Not yet ingested
- Civics
- —
Market trends
- HPI YoY
- ▲ 2.33%
- Current HPI
- 107.7429
- Rent YoY
- —
- Metro
- —
- State GDP YoY
- ▲ 3.95%
- F500 in state
- 110
Industry mix (Fortune 500 HQ in TX)
| Industry | F500 HQs | Revenue |
|---|---|---|
| Energy | 16 | $1,198B |
|
||
| Technology | 5 | $198B |
|
||
| Engineering / Construction | 4 | $72B |
|
||
| Energy Services | 3 | $60B |
|
||
| Utilities | 3 | $41B |
|
||
| Healthcare | 2 | $330B |
|
||
Price history
5 events — show timeline
- 2026-05-22 Listed $109,900 NTREIS
- 2016-06-17 Sold (Public Records) — Public Records
- 2010-03-26 Sold (Public Records) — Public Records
- 1997-04-17 Sold (Public Records) — Public Records
- 1976-09-13 Sold (Public Records) — Public Records
Property tax history
+1.9%/yrLatest (2025): $646 · +8.7% YoY. Source: county tax records.
Cash-flow waterfall
monthlySold comps — $/sqft
last 12 mo · ≤1 miLoading sold comps…