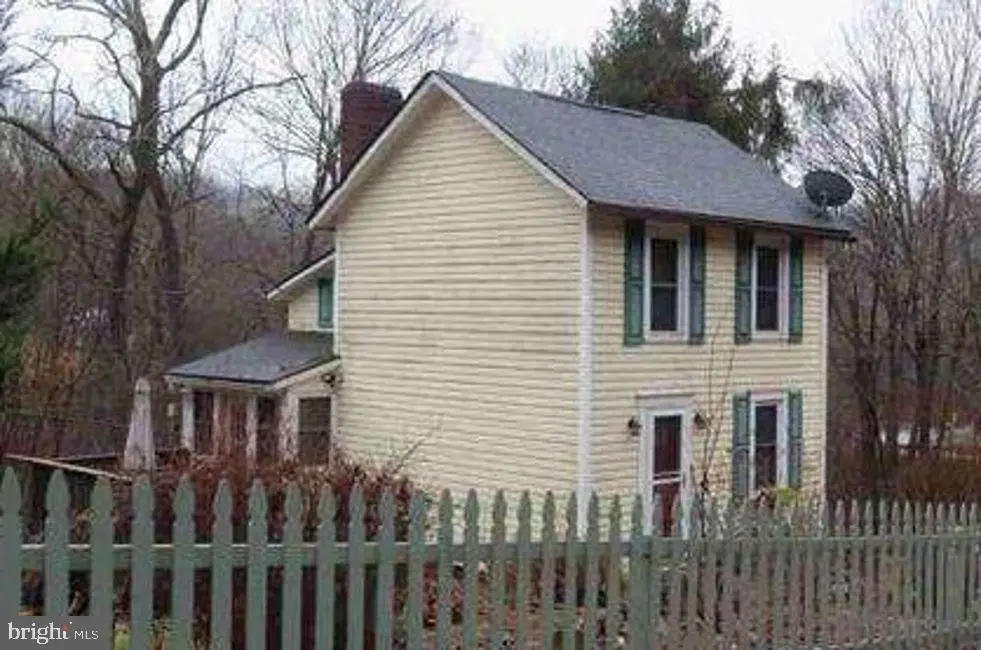
3132 Baker School Rd · North Huntingdon, PA
Flood risk 1/10 · Minimal
- FEMA flood zone
- X (unshaded)
- Chance of flooding over 30 yrs
- 0.0%
- Est. flood insurance / yr
- $507 – $1,088
Fire risk 1/10 · Minimal
- Est. fire insurance / yr
- $511 – $949
Heat risk 3/10 · Minor
- Hot days now (above 97°F)
- 7 days/yr
- Hot days in 30 yrs
- 18 days/yr
Wind risk 2/10 · Minimal
- Chance of severe wind over 30 yrs
- —
Air-quality risk 4/10 · Minor
- Unhealthy air days now
- 5 days/yr
- Unhealthy air days in 30 yrs
- 7 days/yr
Risk factors via First Street. Map © Google.
Why this score? — see what drove the C+ grade
The composite is a weighted blend of 9 inputs, each scored 0–100. Each bar is that input's sub-score; the figure is the points it added to the 100-point composite (weight × sub-score).
- Cash flow +19.3/30.0
- ARV discount +15.0/15.0
- DSCR +6.1/10.0
- Schools +5.9/10.0
- 1% rule +4.5/10.0
- Rent growth +4.3/5.0
- Livability +2.5/5.0
- Condition / age +2.5/5.0
- Appreciation +0.0/10.0
$150,000
🖨 Deal sheet 📄 Offer letter ✓ Due diligence
Listing remarks MLS
AUCTION-HOME CANNOT BE SHOWN - This Colonial style single family home offers 2 bedrooms and 1 bathroom with approximately 860 square feet of living space on a 1.00 acre lot. There are no inspection or financing contingencies on this cash only purchase. It is a criminal offense to trespass on this property. No Buyer Premium on this property. The buyer has the right to select their own title/closing company. The buyer is responsible for all closing costs in this transaction. NO TRESPASSING. DO NOT DISTURB ANY OCCUPANTS!
Key facts
- Picket fence
- Full kitchen
- Main level bathroom
Tags
Neighborhood map
What this means for you Summary
Snapshot
- This is a 2-bed/1.0-bath other listed at $150k.
Deal economics
- At list price, monthly cash flow is $165 ($2k/yr) — positive.
- The deal already cash-flows at list — no discount required.
- To meet the 1% rule (rent ≥ 1% of price), the offer needs to be $142k (5.2% below list).
- Recommended offer: $132k (12.0% below list) — sets the bar for market timing.
Location & tenants
- Location reads: area grade C — affects rentability + tenant quality, not the cash-flow math above.
- Norwin SD (suburban): math 60% / reading 76% proficiency, ranked #32 of 539 in PA (top 6%) — acceptable for families but not a draw, mixed tenant base, ~2y average lease; only 18% free/reduced lunch — higher-income household profile.
- Market conditions: Rents rising fast (+7.2%/yr); 137 active listings in the ZIP; 1 comparable units currently listed for rent nearby; solid renter incomes; 415 units permitted in Westmoreland County in 2024 (10 in 5+ unit buildings).
- This rent is only 17% of the median local income ($98k/yr) — well below the 30% rent-burden line; pricing power to push rent on renewal without tenant pushback.
Forward outlook
- Local home prices are declining (-3.0%/yr); year-one equity from $1k of loan paydown is wiped out by about $4k of value loss. Plan a longer hold.
- Westmoreland County population projected at -19% by 2050 — secular population decline; favor cash flow + early exit over multi-decade hold.
- At projected returns (-3.0% appreciation + 7.2% rent growth), your $42k cash investment doubles in ~10 years — after that, you're playing with house money.
Negotiation context
- It's been on market 265 days — a 12% lower offer ($132k) is reasonable based on typical stale-listing flexibility.
- 5 sale attempts since 27y ago; this cycle's ask is 92% above the opening price — seller raised mid-cycle; expect resistance to lowballs.
- Current owner paid $77k; list at $150k implies a 95% gain — meaningful room to come down on a strong offer.
Questions for the listing agent
- It's been on market 265 days. Have you received any prior offers? Is the seller open to a 12% concession, seller financing, or rate buy-down credit?
- Why hasn't it sold? Are there any deal-killer items the seller is aware of (foundation, flood, title, zoning, code violations)?
- Is there a deadline driving the sale (1031 exchange, divorce, estate, relocation)? That informs how much negotiation room exists.
- What's the average days-on-market for RENTAL listings here right now (not sales)? A rising rental-DOM trend means longer vacancies and softer asking-rent achievability than the comps imply.
- What's the recent tenant-quality profile in this submarket — average credit score on applications, eviction rate, late-payment / NSF rate, and stable-employment percentage? A property-management company in the area should have these aggregated.
- How much new for-sale + rental construction is in the pipeline within 1–3 miles? Heavy new supply typically softens prices + rents 12–24 months out; constrained supply supports both.
Investment metrics
- 1% rule
- 0.95% ✗
- Cap rate
- 7.61%
- Cash-on-cash
- 4.70%
- DSCR
- 1.21
- GRM
- 8.8
CMA / ARV
- ARV (median comp)
- $260,573
- List price
- $150,000
- Delta
- -42.43%
- Verdict
- UNDERPRICED
- Comps
- 5 within 1.0 mi
Projected returns pro-forma
-3.0% appreciation · 7.15% rent growth · sell at horizon
- IRR
- -4.7%
- Equity multiple
- 0.82×
- Total profit
- $-7,666
- Equity at exit
- $22,365
- IRR
- 9.1%
- Equity multiple
- 1.82×
- Total profit
- $34,370
- Equity at exit
- $12,969
Cash invested: $42,000 (down + closing). Projections, not guarantees.
Landlord ↔ Tenant lean methodology
- Overall (STATE)
- 62 Landlord-Friendly
- State Pennsylvania
- 62 Landlord-Friendly · EVEN
- County
- — inherits STATE
- City
- — inherits STATE
ZIP-level market 15642
- Rents YoY
- 7.2%
- Active inventory
- 137
- Price-to-rent
- 8.8×
Monthly cashflow live
- Estimated rent
- $1,422 medium interval (Pro) →
- Mortgage (P&I)
- −$787
- Tax from tax record
- −$110 /mo · $1,319/yr
- Insurance
- −$62
- HOA
- −$0
- Vacancy / Maint / Mgmt
- −$299
- Net cashflow
- $165
Break-even live
UW: 25.0% down · 7.5% · 30yr · 1.5% tax · 5.0% vac · 8.0% maint · 8.0% mgmt
Financing live
Cash to close
- Down payment
- $37,500
- Closing costs
- $4,500
- Reserves months
- —
- Total cash needed
- —
Loan-product check · same deal, 3 products live
Conventional
25% down · 7.5% · 30yr
- Down + closing
- —
- Monthly P&I
- —
- Monthly cashflow
- —
- DSCR
- —
- Eligible?
- —
Personal DTI + credit; lowest rate.
DSCR
20% down · 8.5% · 30yr
- Down + closing
- —
- Monthly P&I
- —
- Monthly cashflow
- —
- DSCR
- —
- Eligible?
- —
No personal income docs; deal must DSCR.
Hard money
10% down · 12.0% · 12mo
- Down + closing
- —
- Monthly P&I
- —
- Monthly cashflow
- —
- DSCR
- —
- Eligible?
- —
Short-term bridge; refi at stabilization.
Rent comps 1 comps
| Address | Beds | Baths | Sqft | Rent | $/sqft | DOM | Units | Dist |
|---|---|---|---|---|---|---|---|---|
| 12341 Maple Ln Irwin, PA | 3.0 | 2.0 | 1100 | $1,695 | $1.54 | 23d | 1 | 1.38mi |
Listing history 23 events
-
2026-06-18days on market $150,000 Active 265 DOM
-
2026-06-17days on market $150,000 Active 264 DOM
-
2026-06-16days on market $150,000 Active 263 DOM
-
2026-06-15days on market $150,000 Active 262 DOM
-
2026-06-13days on market $150,000 Active 260 DOM
-
2026-06-13days on market $150,000 Active 259 DOM
-
2026-06-09days on market $150,000 Active 256 DOM
-
2026-06-08days on market $150,000 Active 255 DOM
-
2026-06-07days on market $150,000 Active 254 DOM
-
2026-06-03days on market $150,000 Active 250 DOM
-
2026-06-02days on market $150,000 Active 249 DOM
-
2026-06-01days on market $150,000 Active 248 DOM
-
2026-05-31days on market $150,000 Active 247 DOM
-
2026-05-13$78,120 Active 523-char remark
Show marketing remark (523 chars)
AUCTION-HOME CANNOT BE SHOWN - This Colonial style single family home offers 2 bedrooms and 1 bathroom with approximately 860 square feet of living space on a 1.00 acre lot. There are no inspection or financing contingencies on this cash only purchase. It is a criminal offense to trespass on this property. No Buyer Premium on this property. The buyer has the right to select their own title/closing company. The buyer is responsible for all closing costs in this transaction. NO TRESPASSING. DO NOT DISTURB ANY OCCUPANTS!
-
2025-09-26$150,000 Active 340-char remark
Show marketing remark (340 chars)
Charming 1 acre property tucked away! Enjoy privacy and seclusion on this 1 acre property. Quaint picket fence decorates the front yard. Spacious Living room, full kitchen, and side enclosed porch on the first floor. Full Bathroom on the Main level. Two spacious bedrooms upstairs. Tons of potential is waiting here with the home and land!
-
2006-09-21soldstatus $77,000
-
2006-09-19soldstatus $77,000
-
2006-07-13$79,900
-
2005-06-10soldstatus $18,900
-
2005-03-21$18,900
-
1999-12-01soldstatus $47,300
-
1999-11-24soldstatus $47,300
-
1999-04-19$45,000
ⓘ Source: listings_history table (triggers on properties + properties_extension) + one-shot
backfill from property_details.listing_events for pre-trigger history.
Tax reassessment forecast PA · Partial reset (capped growth)
- Current annual tax
- $1,319 · $110/mo
- Projected year-2 tax
- $1,844 · $154/mo
- Expected delta
- +$526/yr (+$44/mo · 39.9%)
ⓘ Screening estimate from a state-policy table — verify with the county assessor before closing.
Climate risk First Street
- Flood 1/10 Low FEMA zone X (unshaded) · 0% chance over 30 yrs
- Wildfire 1/10 Low
- Heat 3/10 Moderate 7 d/yr ≥97°F today · 18 d/yr by 30 yrs out
- Wind 2/10 Low
- Air quality 4/10 Moderate 5 unhealthy d/yr today · 7 by 30 yrs out
Nearby sold comps map
Loading sold comps map…
Walkable amenities ~0.75 mi
Loading nearby amenities…
Taxation est. · year 1
- Rental income
- $17,067
- − Mortgage interest
- −$8,402
- − Property taxes
- −$1,319
- − Insurance
- −$750
- − Repairs & maintenance
- −$1,365
- − Management
- −$1,365
- − Depreciation
- −$4,364
- Taxable loss
- −$499
- Est. tax savings @ 24.0%
- +$120
- After-tax cash flow
- $2,094/yr
For passive investors: Depreciation is non-cash, so a rental often shows a tax loss while cash-flowing — sheltering income. Rental losses are passive: they offset passive income freely, and up to $25,000/yr can offset ordinary (W-2) income if you actively participate and your MAGI is under $100k (phasing out to $0 by $150k); unused losses carry forward. On sale, claimed depreciation is recaptured at up to 25%, and gains may owe capital-gains tax (a 1031 exchange can defer both). Figures are a year-1 estimate at your 24.0% rate — not tax advice; consult a CPA.
Schools (NCES district)
- District
- Norwin SD
- NCES district ID
- 4217940
- Math proficiency
- 60% ▼ -11.00%
- Reading proficiency
- 76% ▼ -6.00%
- Median HH income
- $62,686
- Composite
- 58.86/100
- National rank
- #973
- State rank
- #32 of 539 in PA
Livability — North Huntingdon
No livability data for this city. (Only ~50 U.S. cities are tracked.)
Census & demographics
- County
- Westmoreland County · 183,777 people
- Metro
- Pittsburgh, PA
- Population (ZIP)
- 46,325
- Household income
- $97,706
- Rent vs Own
- Severe rent burden
- 349.0
Population outlook (Westmoreland County) Hauer SSP2
- Today (2025)
- 342,555 people
- By 2030
- 331,717 · -3.2%
- By 2040
- 304,976 · -11.0%
- By 2050
- 277,444 · -19.0%
- By 2075
- 224,607 · -34.4%
- By 2100
- 171,084 · -50.1%
Race, ethnicity, and origin ACS 2023
- Neighborhood character
- Predominantly White (94%)
- Race & ethnicity
- White 94% Two or more races 3% Hispanic / Latino 2%
- Common ancestry
- Romanian 9% Slovak 2% Italian 2%
- Foreign-born
- 2% · Canada
- Languages at home
- 98% English-only · Spanish 1%
Political lean MEDSL · Westmoreland
- 2024 margin
- Strong R (+28.4) · D 35.4% · R 63.9%
- 2008→2024 swing
- -11.7pp toward R · 2008: -16.7pp · 2024: -28.4pp
- All cycles
- 2024: R+28.4 2020: R+28.3 2016: R+31.3 2012: R+23.7 2008: R+16.7
Not yet ingested
- Civics
- —
Market trends
- HPI YoY
- ▼ -129.70%
- Current HPI
- 180.8812
- Rent YoY
- ▲ 7.15%
- Metro
- Pittsburgh, PA
- State GDP YoY
- ▲ 1.68%
- F500 in state
- 34
Industry mix (Fortune 500 HQ in PA)
| Industry | F500 HQs | Revenue |
|---|---|---|
| Healthcare | 2 | $309B |
|
||
| Insurance | 2 | $27B |
|
||
| Telecommunications / Media | 1 | $124B |
|
||
| Industrial Distribution | 1 | $22B |
|
||
| Financial Services | 1 | $20B |
|
||
| Chemicals / Materials | 1 | $18B |
|
||
Price history
+73.6% since first listed10 events — show timeline
- 2026-05-13 Listed $78,120 BRIGHT MLS
- 2025-09-26 Listed $150,000 West Penn MLS
- 2006-09-21 Sold (Public Records) $77,000 Public Records
- 2006-09-19 Sold (MLS) $77,000 West Penn MLS
- 2006-07-13 Listed $79,900 West Penn MLS
- 2005-06-10 Sold (MLS) $18,900 West Penn MLS
- 2005-03-21 Listed $18,900 West Penn MLS
- 1999-12-01 Sold (Public Records) $47,300 Public Records
- 1999-11-24 Sold (MLS) $47,300 West Penn MLS
- 1999-04-19 Listed $45,000 West Penn MLS
Property tax history
+2.8%/yrLatest (2026): $1,319 · +2.6% YoY. Source: county tax records.
Cash-flow waterfall
monthlySold comps — $/sqft
last 12 mo · ≤1 miLoading sold comps…