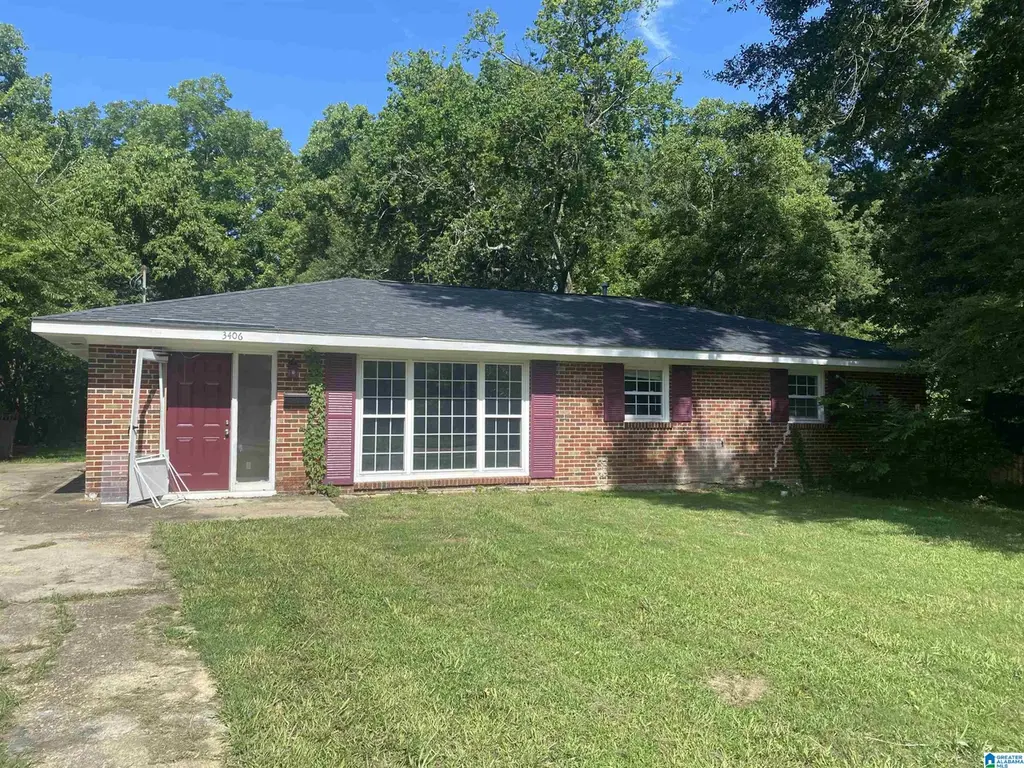
3406 Le Bron Rd · Montgomery, AL
Flood risk 1/10 · Minimal
- FEMA flood zone
- X (unshaded)
- Chance of flooding over 30 yrs
- 0.0%
- Est. flood insurance / yr
- $507 – $1,088
Fire risk 1/10 · Minimal
- Est. fire insurance / yr
- $916 – $1,700
Heat risk 7/10 · Major
- Hot days now (above 108°F)
- 7 days/yr
- Hot days in 30 yrs
- 20 days/yr
Wind risk 8/10 · Major
- Chance of severe wind over 30 yrs
- 80.0%
Air-quality risk 2/10 · Minimal
- Unhealthy air days now
- 1 days/yr
- Unhealthy air days in 30 yrs
- 1 days/yr
Risk factors via First Street. Map © Google.
Why this score? — see what drove the B grade
The composite is a weighted blend of 9 inputs, each scored 0–100. Each bar is that input's sub-score; the figure is the points it added to the 100-point composite (weight × sub-score).
- Cash flow +30.0/30.0
- ARV discount +15.0/15.0
- DSCR +10.0/10.0
- 1% rule +9.1/10.0
- Livability +3.2/5.0
- Rent growth +2.5/5.0
- Condition / age +2.5/5.0
- Schools +1.7/10.0
- Appreciation +0.0/10.0
$94,900
🖨 Deal sheet 📄 Offer letter ✓ Due diligence
Listing remarks MLS
This LeBron address home of 1,820 sqft will not be a disappointment! The roof is less than 2 months old; the HVAC is less than 5, and the windows are new! Has washer & dryer and other stainless steel appliances. The kitchen and bathroom are renovated and 2nd bathroom is invigorating! A wall of built-ins surrounds the den fireplace that gives a caliber of entertainment! Ready for tenants today. Sold AS-IS. Call for an appointment!
Key facts
- Brand new roof
- Renovated ranch
- Updated hvac
Tags
Property features AI
Finance
- Other: Lot size about 0.46 acres; Property located in the Cloverdale minor subdivision
- HOA & community: No association fee
Exterior
- Parking: Driveway parking; 2 carport spaces
- Utilities: Public water; Gas water heater; Internet service available
- Home design: 3-side brick construction; Existing structure; Slab foundation
- Construction: 3-side brick exterior; Slab foundation
- Exterior features: Fenced yard; Garden/patio area; No pool, no waterfront, no patio or decks
Interior
- Kitchen: Laminate countertops; Refrigerator included
- Bedrooms: Three bedrooms on the main level (approx. 14x13, 12x11, 11x11)
- Flooring: Hardwood floors; Tile floors
- Bathrooms: Two full bathrooms with tub/shower combos (bath sizes approx. 5x8 and 5x9)
- Heating & cooling: Central heating; Central air conditioning
- Interior features: Hardwood and tile floors; Fireplace (woodburning insert) in the family room; Attic with pull-down access; Ceilings: other (see remarks)
- Laundry & utility: Main-level laundry with washer hookup and electric dryer hookup; Washer hookup provided; dryer hookup is electric
Neighborhood map
What this means for you Summary
Snapshot
- This is a 3-bed/2.0-bath single-family listed at $95k.
Deal economics
- At list price, monthly cash flow is $433 ($5k/yr) — positive.
- The deal already cash-flows at list — no discount required.
- Meets the 1% rule at list price ($1k rent vs $95k).
- Cap rate 11.8% vs local median 6.0% in Montgomery — top-decile yield for the area; either an underpriced asset or a hidden risk that comps aren't pricing in. Stress-test before assuming the spread holds.
Location & tenants
- Location reads 65/100 on livability (#138 in AL) — a middle-class / working-renter tenant base. Strengths: cost of living A+, housing A+; Watch: employment D, crime F, amenities D-.
- Montgomery County (urban): math 9% / reading 31% proficiency, ranked #106 of 129 in AL (top 82%) — low school quality limits family demand, transient renter base, plan for 1-2y turnover; 70% free/reduced lunch — lower-income household profile, screen leases tightly.
- Zoned schools: Davis Elementary School (math 2% / reading 12%, grade F, #601 of 627 statewide, top 98%, 509 students, 97% FRL, charter); Carver Senior High School (math 2% / reading 12%, grade F, #265 of 305 statewide, top 89%, 902 students, 89% FRL) — zoned schools average 93% FRL vs 70% district-wide (23 pts higher); higher-poverty schools than district average — tighter screening recommended.
- Zoned-school proficiency averages 7% at this address vs 20% district-wide (-13 pts) — the specific schools serving this property underperform the Montgomery County average; the district grade overstates school quality for this exact location.
- Market conditions: 110 active listings in the ZIP; 38 comparable units currently listed for rent nearby; rentals lingering (median 44d on market — plan ~5-8 weeks vacancy on turnover, expect pricing pressure); 50% of comp listings sitting > 30 days — soft ceiling on asking rent; 460 units permitted in Montgomery County in 2024 (37 in 5+ unit buildings).
Forward outlook
- Local home prices are declining (-3.0%/yr); year-one equity from $656 of loan paydown is wiped out by about $3k of value loss. Plan a longer hold.
- Montgomery County population projected to shrink 8% by 2050 — rents likely to lag national; underwrite the cash flow, not the appreciation.
- At projected returns (-3.0% appreciation + 3.0% rent growth), your $27k cash investment doubles in ~7 years — after that, you're playing with house money.
Negotiation context
- Only 13 days on market — expect competitive offers; lowballing is unlikely to land.
- 7 sale attempts since 29y ago with the ask held roughly flat each time — persistent listings suggest the price (not the market) is what's stuck; bring a comps-based counter.
Risks & watch-outs
- Climate carrying-cost: severe wind risk, 80% chance of damaging wind over 30y; extreme-heat days projected 7→20/yr by 2055 (HVAC capex compounding) — expect insurance premiums to compound above CPI over the hold.
Questions for the listing agent
- Built in 1960 — when were the roof, HVAC, electrical panel, plumbing, and water heater last replaced?
- Is there a deadline driving the sale (1031 exchange, divorce, estate, relocation)? That informs how much negotiation room exists.
- Crime grade is F in this area — have there been break-ins, vandalism, or insurance claims at this property in the last 3 years? What carrier currently insures it and at what premium?
- What's the average days-on-market for RENTAL listings here right now (not sales)? A rising rental-DOM trend means longer vacancies and softer asking-rent achievability than the comps imply.
- What's the recent tenant-quality profile in this submarket — average credit score on applications, eviction rate, late-payment / NSF rate, and stable-employment percentage? A property-management company in the area should have these aggregated.
- How much new for-sale + rental construction is in the pipeline within 1–3 miles? Heavy new supply typically softens prices + rents 12–24 months out; constrained supply supports both.
Investment metrics
- 1% rule
- 1.41% ✓
- Cap rate
- 11.76%
- Cash-on-cash
- 19.53%
- DSCR
- 1.87
- GRM
- 5.9
CMA / ARV
- ARV (on-the-fly)
- $145,600
- Comps found
- 12
Show comp detail 12 sales within ~0.75 mi
| Address | Dist | Beds/Ba | Sqft | Sold | Price | $/sf | Match |
|---|---|---|---|---|---|---|---|
| 3469 Wellington Rd | 0.14mi | 3/2.0 | 1,782 (-2%) | 3mo | $49,900 | $28 | 88 |
| 3417 Wellington Rd | 0.21mi | 3/2.0 | 1,722 (-5%) | 1mo | $100,000 | $58 | 80 |
| 3237 Cloverdale Rd | 0.24mi | 3/2.0 | 1,954 (+7%) | 2mo | $240,000 | $123 | 75 |
| 3356 Cloverdale Rd | 0.14mi | 2/2.0 (-1) | 1,966 (+8%) | 1mo | $229,000 | $116 | 74 |
| 3134 S Hull St | 0.63mi | 3/2.0 | 1,830 (+0%) | 2mo | $115,000 | $63 | 68 |
| 3460 Cloverdale Rd | 0.12mi | 4/2.0 (+1) | 1,562 (-14%) | 3mo | $166,900 | $107 | 63 |
| 3357 Wilmington Rd | 0.39mi | 3/2.0 | 2,064 (+13%) | 2mo | $165,000 | $80 | 58 |
| 3622 Audubon Rd | 0.61mi | 3/2.0 | 1,659 (-9%) | 1mo | $86,000 | $52 | 56 |
| 3637 Cloverdale Rd | 0.59mi | 3/2.0 | 1,655 (-9%) | 3mo | $90,000 | $54 | 55 |
| 615 Hubbard St | 0.44mi | 3/1.0 | 1,586 (-13%) | 0mo | $112,000 | $71 | 54 |
| 1028 Magnolia Curv | 0.72mi | 3/1.5 | 1,661 (-9%) | 1mo | $250,000 | $151 | 49 |
| 1410 Glen Grattan Dr | 0.73mi | 3/3.0 | 2,092 (+15%) | 1mo | $227,775 | $109 | 36 |
Match score weights: distance 35% · size 25% · config 20% · recency 20%. Top-matched comps best support the ARV.
Projected returns pro-forma
-3.0% appreciation · 3.0% rent growth · sell at horizon
- IRR
- 11.6%
- Equity multiple
- 1.46×
- Total profit
- $12,173
- Equity at exit
- $14,150
- IRR
- 20.5%
- Equity multiple
- 2.73×
- Total profit
- $46,080
- Equity at exit
- $8,205
Cash invested: $26,572 (down + closing). Projections, not guarantees.
Landlord ↔ Tenant lean methodology
- Overall (STATE)
- 90 Strongly Landlord-Friendly
- State Alabama
- 90 Strongly Landlord-Friendly · R+15
- County
- — inherits STATE
- City
- — inherits STATE
ZIP-level market 36111
- Home prices YoY
- -6.9%
- Active inventory
- 110
- Price-to-rent
- 5.9×
Monthly cashflow live
- Estimated rent
- $1,338 high interval (Pro) →
- Mortgage (P&I)
- −$498
- Tax from tax record
- −$88 /mo · $1,051/yr
- Insurance
- −$40
- HOA
- −$0
- Vacancy / Maint / Mgmt
- −$281
- Net cashflow
- $433
Break-even live
UW: 25.0% down · 7.5% · 30yr · 1.5% tax · 5.0% vac · 8.0% maint · 8.0% mgmt
Financing live
Cash to close
- Down payment
- $23,725
- Closing costs
- $2,847
- Reserves months
- —
- Total cash needed
- —
Loan-product check · same deal, 3 products live
Conventional
25% down · 7.5% · 30yr
- Down + closing
- —
- Monthly P&I
- —
- Monthly cashflow
- —
- DSCR
- —
- Eligible?
- —
Personal DTI + credit; lowest rate.
DSCR
20% down · 8.5% · 30yr
- Down + closing
- —
- Monthly P&I
- —
- Monthly cashflow
- —
- DSCR
- —
- Eligible?
- —
No personal income docs; deal must DSCR.
Hard money
10% down · 12.0% · 12mo
- Down + closing
- —
- Monthly P&I
- —
- Monthly cashflow
- —
- DSCR
- —
- Eligible?
- —
Short-term bridge; refi at stabilization.
Rent comps 38 comps
| Address | Beds | Baths | Sqft | Rent | $/sqft | DOM | Units | Dist |
|---|---|---|---|---|---|---|---|---|
| 3369 Montezuma Rd Montgomery, AL | 3.0 | 1.0 | 1281 | $1,150 | $0.90 | 43d | 1 | 0.10mi |
| 3485 Wellington Rd Montgomery, AL | 3.0 | 2.0 | 2437 | $1,395 | $0.57 | 20d | 1 | 0.14mi |
| 3356 Audubon Rd Montgomery, AL | 2.0 | 1.5 | 1340 | $950 | $0.71 | 43d | 1 | 0.18mi |
| 3256 Montezuma Rd Montgomery, AL | 3.0 | 2.0 | 1515 | $1,450 | $0.96 | 43d | 1 | 0.28mi |
| 3386 Lexington Rd Unit B Montgomery, AL | 2.0 | 1.0 | 1950 | $900 | $0.46 | 20d | 1 | 0.28mi |
| 3510 Bankhead Ave Montgomery, AL | 3.0 | 3.0 | 2210 | $2,250 | $1.02 | 43d | 1 | 0.34mi |
| 3235 Norman Bridge Rd Montgomery, AL | 3.0 | 1.0 | 1873 | $900 | $0.48 | 43d | 1 | 0.41mi |
| 3543 Berkley Dr Montgomery, AL | 4.0 | 2.0 | 2067 | $1,575 | $0.76 | 13d | 1 | 0.42mi |
| 3338 S Hull St Montgomery, AL | 2.0 | 2.0 | 1311 | $1,150 | $0.88 | 20d | 1 | 0.53mi |
| 3735 Bridlewood Dr Montgomery, AL | 3.0 | 1.0 | 1386 | $895 | $0.65 | 43d | 1 | 0.62mi |
| 3304 Gilmer Ave Montgomery, AL | 4.0 | 2.0 | 2009 | $1,400 | $0.70 | 20d | 1 | 0.62mi |
| 2727 Boultier St Montgomery, AL | 1.0–3.0 | 1.0–2.0 | 1070 | $1,582 | $1.48 | 13d | 3 | 0.68mi |
| 3649 Princeton Rd Montgomery, AL | 3.0 | 1.0 | 1266 | $1,200 | $0.95 | 20d | 1 | 0.68mi |
| 428 Thorn Pl Montgomery, AL | 2.0 | 1.0 | 1549 | $1,450 | $0.94 | 43d | 1 | 0.71mi |
| 519 Thorn Pl Montgomery, AL | 2.0 | 1.0 | 1632 | $650 | $0.40 | 20d | 1 | 0.73mi |
| 3544 Southmont Dr Montgomery, AL | 4.0 | 1.5 | 1774 | $1,300 | $0.73 | 20d | 1 | 0.74mi |
| 1919 Norman Bridge Ct Unit 1043838P Montgomery, AL | 4.0 | 3.0 | 1539 | $4,108 | $2.67 | 43d | 1 | 0.74mi |
| 3708 Princeton Rd Montgomery, AL | 2.0 | 2.0 | 1749 | $900 | $0.51 | 20d | 1 | 0.75mi |
| 139 Mount Vernon Dr Unit A Montgomery, AL | 4.0 | 2.5 | 1700 | $1,000 | $0.59 | 43d | 1 | 0.77mi |
| 3720 Stanley Dr Montgomery, AL | 4.0 | 2.0 | 1719 | $1,650 | $0.96 | 20d | 1 | 0.79mi |
| 1437 Beaumont Dr Montgomery, AL | 4.0 | 2.0 | 2029 | $1,500 | $0.74 | 43d | 1 | 0.80mi |
| 1450 Crenshaw Pl S Montgomery, AL | 3.0 | 2.0 | 1641 | $1,775 | $1.08 | 43d | 1 | 0.90mi |
| 1067 Roslyn Dr Montgomery, AL | 4.0 | 2.0 | 1760 | $1,125 | $0.64 | 20d | 1 | 0.92mi |
| 1355 Magnolia Curv Montgomery, AL | 3.0 | 3.0 | 2260 | $1,800 | $0.80 | 13d | 1 | 0.93mi |
| 1425 Blairwood Montgomery, AL | 3.0 | 2.0 | 1700 | $1,850 | $1.09 | 13d | 1 | 0.95mi |
| 334 Felder Ave Montgomery, AL | 3.0 | 2.0 | 2223 | $2,395 | $1.08 | 43d | 1 | 0.99mi |
| 548 Winston Dr Montgomery, AL | 2.0 | 2.5 | 1396 | $1,000 | $0.72 | 43d | 1 | 1.05mi |
| 2043 Hazel Hedge Ln Montgomery, AL | 4.0 | 3.0 | 2001 | $1,650 | $0.82 | 13d | 1 | 1.21mi |
| 2226 Carter Hill Rd Montgomery, AL | 2.0 | 1.0 | 1506 | $905 | $0.60 | 43d | 1 | 1.22mi |
| 1434 E Audubon Rd Montgomery, AL | 4.0 | 2.0 | 2237 | $1,475 | $0.66 | 43d | 1 | 1.25mi |
| 1259 S Lawrence St Montgomery, AL | 3.0 | 1.0 | 1728 | $1,300 | $0.75 | 43d | 1 | 1.28mi |
| 2045 Bullard St Unit 1043526P Montgomery, AL | 3.0 | 2.0 | 1797 | $2,198 | $1.22 | 43d | 1 | 1.33mi |
| 2053 Gorgas St Montgomery, AL | 3.0 | 1.0 | 1955 | $1,200 | $0.61 | 20d | 1 | 1.37mi |
| 1314 S Court St Montgomery, AL | 2.0 | 2.0 | 1650 | $1,495 | $0.91 | 13d | 1 | 1.43mi |
| 2014 Commodore St Montgomery, AL | 3.0 | 2.0 | 1613 | $1,450 | $0.90 | 13d | 1 | 1.45mi |
| 3616 Gaston Ave Montgomery, AL | 4.0 | 2.0 | 1629 | $1,300 | $0.80 | 43d | 1 | 1.46mi |
| 1020 S Lawrence St Montgomery, AL | 2.0 | 1.0 | 1711 | $2,000 | $1.17 | 13d | 1 | 1.47mi |
| 1842 Gillespie Dr Montgomery, AL | 4.0 | 2.0 | 1620 | $1,650 | $1.02 | 43d | 1 | 1.49mi |
Listing history 11 events
-
2026-06-18days on market $94,900 Active 13 DOM
-
2026-06-17days on market $94,900 Active 12 DOM
-
2026-06-16days on market $94,900 Active 11 DOM
-
2026-06-15days on market $94,900 Active 10 DOM
-
2026-06-14days on market $94,900 Active 8 DOM
-
2026-06-13days on market $94,900 Active 7 DOM
-
2026-06-10days on market $94,900 Active 5 DOM
-
2026-06-09days on market $94,900 Active 4 DOM
-
2026-06-08days on market $94,900 Active 3 DOM
-
2026-06-07remarks 562-char remark
-
2026-06-07$94,900 Active 2 DOM
ⓘ Source: listings_history table (triggers on properties + properties_extension) + one-shot
backfill from property_details.listing_events for pre-trigger history.
Tax reassessment forecast AL · Resets to sale price
- Current annual tax
- $1,051 · $88/mo
- Projected year-2 tax
- $1,051 · $88/mo
- Expected delta
- $0/yr ($0/mo · 0.0%)
ⓘ Screening estimate from a state-policy table — verify with the county assessor before closing.
Climate risk First Street
- Flood 1/10 Low FEMA zone X (unshaded) · 0% chance over 30 yrs
- Wildfire 1/10 Low
- Heat 7/10 Severe 7 d/yr ≥108°F today · 20 d/yr by 30 yrs out
- Wind 8/10 Severe 80% chance of damaging wind over 30 yrs
- Air quality 2/10 Low 1 unhealthy d/yr today · 1 by 30 yrs out
Nearby sold comps map
Loading sold comps map…
Walkable amenities ~0.75 mi
Loading nearby amenities…
Taxation est. · year 1
- Rental income
- $16,060
- − Mortgage interest
- −$5,316
- − Property taxes
- −$1,051
- − Insurance
- −$474
- − Repairs & maintenance
- −$1,285
- − Management
- −$1,285
- − Depreciation
- −$2,761
- Taxable income
- $3,889
- Est. tax owed @ 24.0%
- −$933
- After-tax cash flow
- $4,257/yr
For passive investors: Depreciation is non-cash, so a rental often shows a tax loss while cash-flowing — sheltering income. Rental losses are passive: they offset passive income freely, and up to $25,000/yr can offset ordinary (W-2) income if you actively participate and your MAGI is under $100k (phasing out to $0 by $150k); unused losses carry forward. On sale, claimed depreciation is recaptured at up to 25%, and gains may owe capital-gains tax (a 1031 exchange can defer both). Figures are a year-1 estimate at your 24.0% rate — not tax advice; consult a CPA.
Schools (NCES district)
- District
- Montgomery County
- NCES district ID
- 0102430
- Math proficiency
- 9% ▼ -21.00%
- Reading proficiency
- 31% ▼ -1.00%
- Median HH income
- $43,902
- Composite
- 17.24/100
- National rank
- #9093
- State rank
- #106 of 129 in AL
Livability — Montgomery
- Score
- 65/100
- State rank
- #138
- US rank
- #13416
Category grades
Schools grade is shown separately in the Schools card above.
Census & demographics
- Census place
- Montgomery, AL
- City population
- 175,913
- Population (ZIP)
- 12,196
Population outlook (Montgomery County) Hauer SSP2
- Today (2025)
- 224,008 people
- By 2030
- 221,460 · -1.1%
- By 2040
- 214,179 · -4.4%
- By 2050
- 204,912 · -8.5%
- By 2075
- 177,821 · -20.6%
- By 2100
- 145,134 · -35.2%
Race, ethnicity, and origin ACS 2023
- Neighborhood character
- Majority Black (60%)
- Race & ethnicity
- Black 60% White 34% Asian 3% Hispanic / Latino 2% Two or more races 2%
- Common ancestry
- Slovak 2% Serbian 2% Italian 1%
- Foreign-born
- 3% · China, Canada
- Languages at home
- 95% English-only · Other Indo-European 2% Spanish 1% Chinese 1%
Political lean MEDSL · Montgomery
- 2024 margin
- Solid D (+30.7) · D 64.8% · R 34.1% · Other 1.1%
- 2008→2024 swing
- +11.5pp toward D · 2008: 19.2pp · 2024: 30.7pp
- All cycles
- 2024: D+30.7 2020: D+31.5 2016: D+26.2 2012: D+24.3 2008: D+19.2
Not yet ingested
- Civics
- —
Market trends
- HPI YoY
- ▼ -11.63%
- Current HPI
- 156.4412
- Rent YoY
- —
- Metro
- —
- State GDP YoY
- ▲ 2.94%
- F500 in state
- 4
Industry mix (Fortune 500 HQ in AL)
| Industry | F500 HQs | Revenue |
|---|---|---|
| Financial Services | 1 | $8B |
|
||
| Healthcare | 1 | $5B |
|
||
Price history
+14.5% since first listed15 events — show timeline
- 2026-06-05 Listed $94,900 Greater Alabama MLS
- 2026-03-21 Price Changed $74,900 MAAR
- 2026-01-23 Price Changed $84,900 MAAR
- 2025-11-18 Price Changed $94,900 MAAR
- 2025-10-21 Listed $99,900 MAAR
- 2021-05-25 Sold (Public Records) $103,000 Public Records
- 2021-05-20 Sold (MLS) $111,000 MAAR
- 2021-04-14 Listed $119,000 MAAR
- 2008-06-06 Sold (Public Records) $124,100 Public Records
- 2008-05-29 Sold (MLS) $124,000 MAAR
- 2008-03-26 Listed $128,500 MAAR
- 2007-05-25 Sold (MLS) $72,000 MAAR
- 2006-12-01 Listed $76,000 MAAR
- 2004-09-03 Listed $93,000 MAAR
- 1997-01-13 Listed $82,900 MAAR
Property tax history
+11.7%/yrLatest (2025): $1,051 · -0.5% YoY. Source: county tax records.
Cash-flow waterfall
monthlySold comps — $/sqft
last 12 mo · ≤1 miLoading sold comps…